ATF Macd Model T

Looking for a trading tool based on the MACD indicator that can display crossovers arrows on all time frames?

Introducing trading indicator : All Time Frame MACD Model T ready to help you achieve daily profits.

This tool is created using the intersection of two indicator lines of MACD : the main MACD and the signal MACD.
Using this tool makes it easier to observe the real-time dashboard and intersections of multiple timeframes simultaneously.
Viewing both higher and lower timeframes simultaneously is crucial.
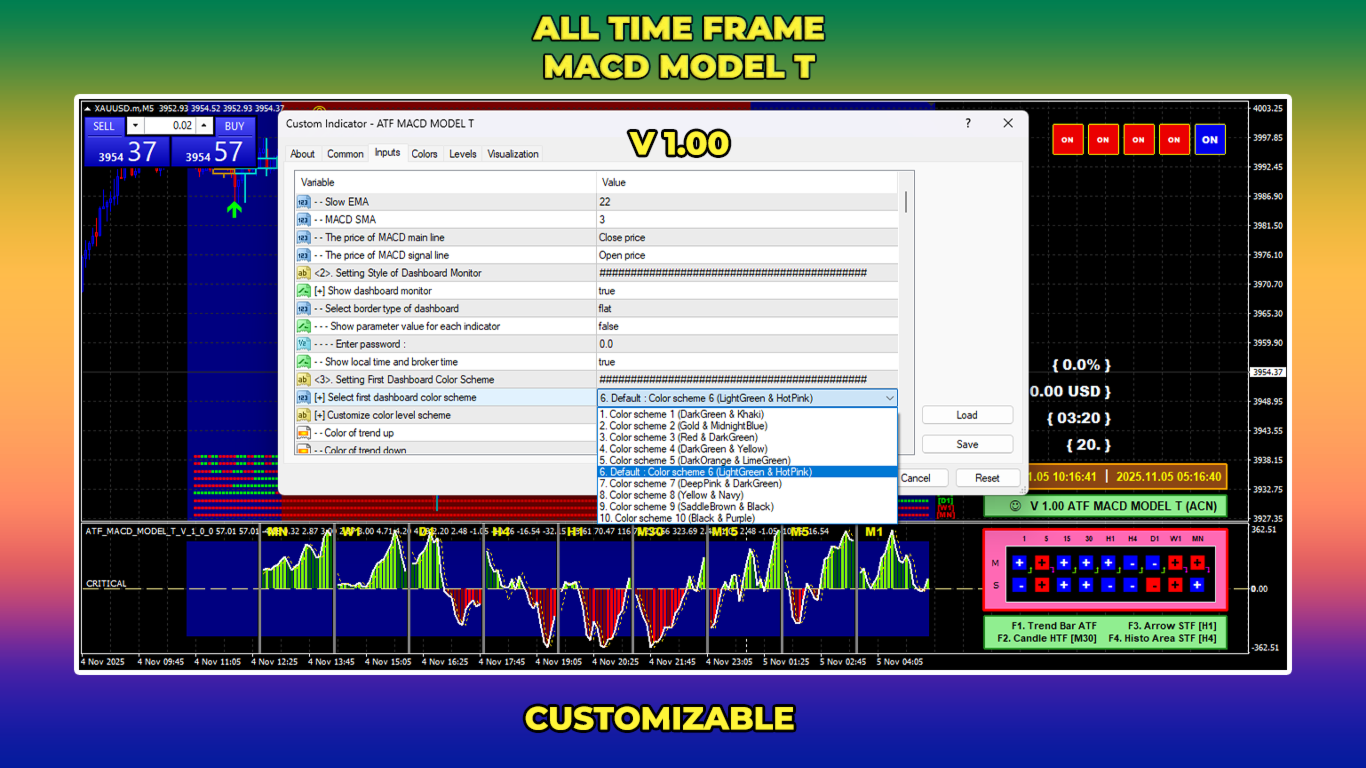
Features :

✅ Multi Time Frame
✅ Main button and Sub buttons technology
✅ Monitoring Real Time Dashboard
✅ Monitoring Per TF curve
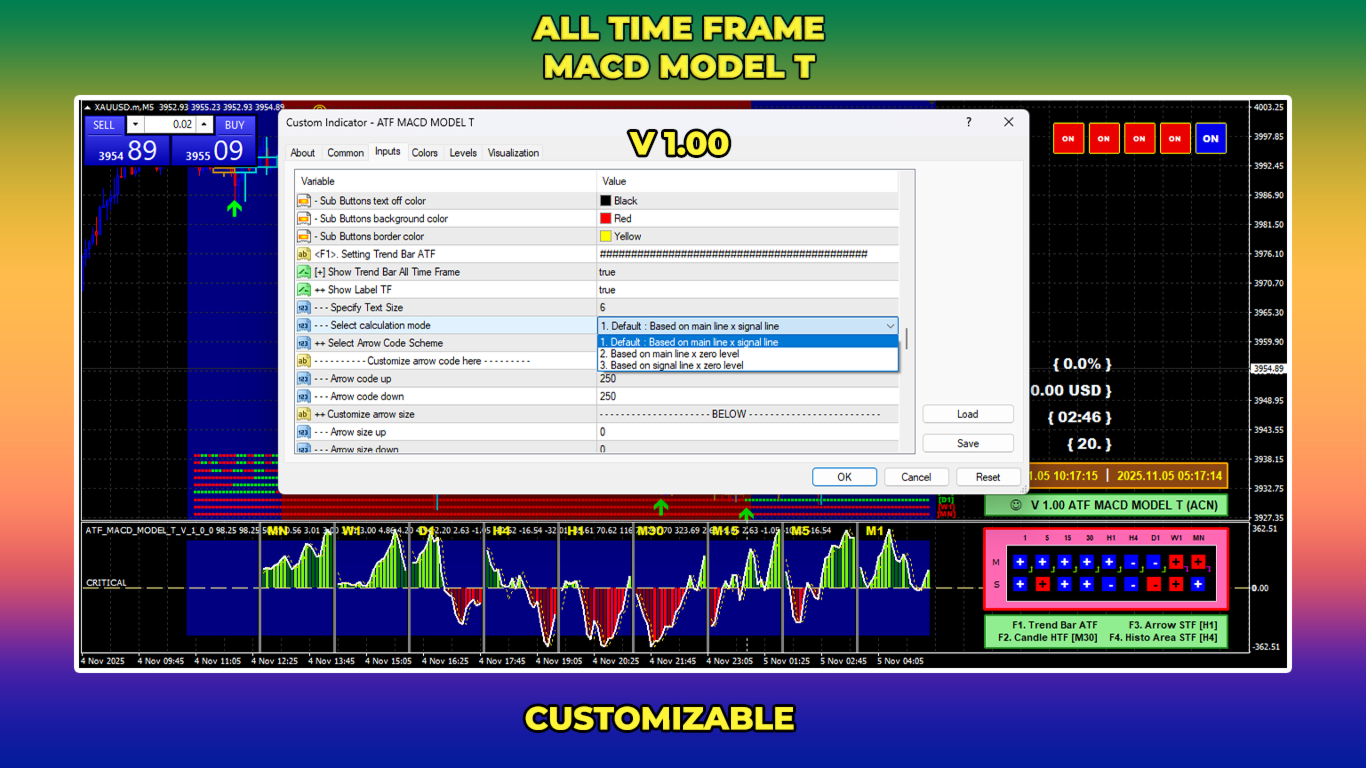
✅ F1. Trend Bar All Time Frame
✅ F2. Candle High Time Frame
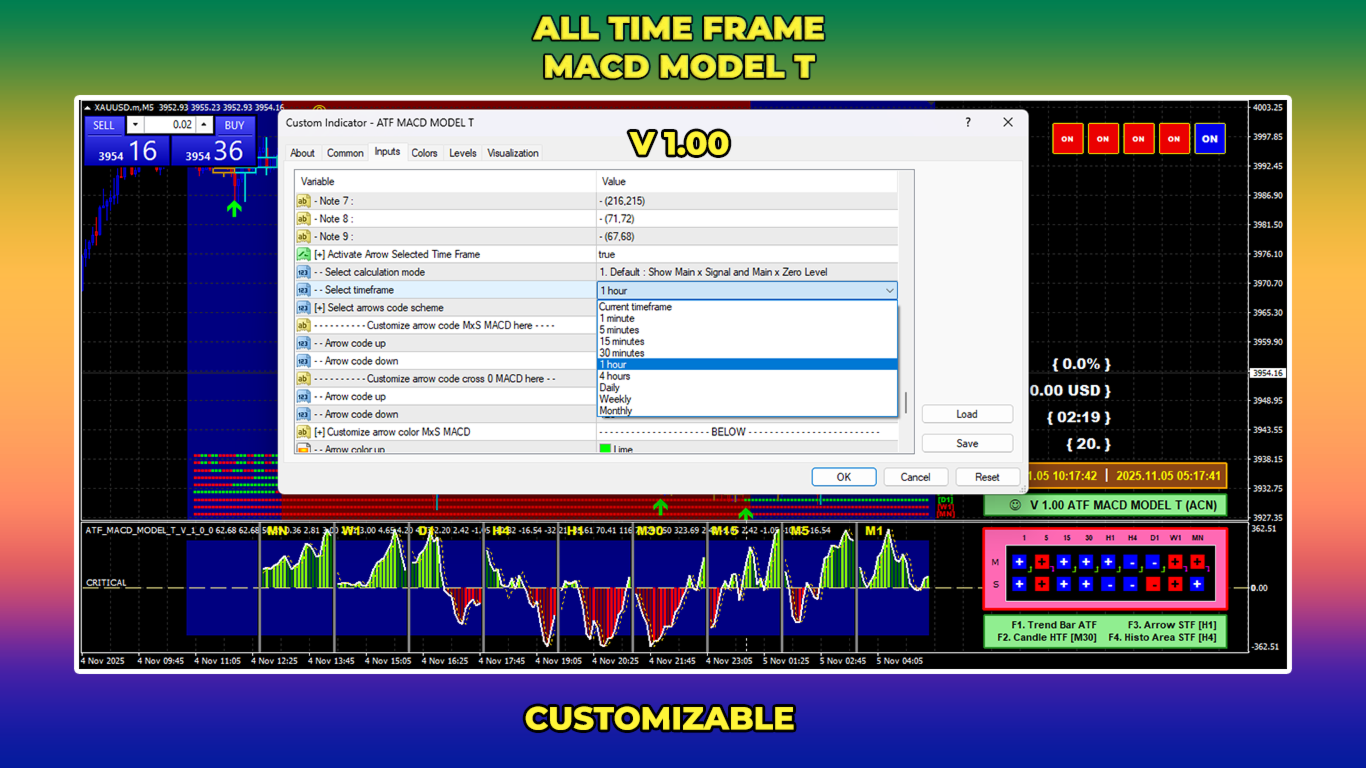
✅ F3. Arrow Crossover Selected Time Frame
✅ F4. Histogram Area Selected Time Frame
✅ Time Spread Profit Info
✅ Local Time & Broker Time
✅ Customizable Time Frame
✅ Customizable Style
✅ Customizable Parameter

Every second counts in trading. 
This tool help you make smarter, faster, and more informed decisions.

Get this trading tool now.


#MACDindicator #MACD 

Recommended products
Looking for a trading tool based on the MACD indicator that can display crossovers arrows on all time frames? Introducing trading indicator : All Time Frame MACD Model S ready to help you achieve daily profits. This tool is created using the intersection of two indicator lines of MACD : the main MACD and the signal MACD. Using this tool makes it easier to observe the real-time dashboard and intersections of multiple timeframes simultaneously. Viewing both higher and lower timeframes simultaneou
Crypto_Forex Indicator "Relative Drawdown Display" for MT4, useful trading tool. This is MUST HAVE indicator for traders who use grid trading systems!!! - Relative Drawdown Display indicator shows   current Relative DD   or   Floating Profit in %   on your account.  - PC and Mobile Alerts are built-in with adjustable Trigger level. - Indicator also indicates account   Balance and Equity. - It is possible to locate indicator values in   any corner of the chart . - It   is possible to set up colo
Before
Nadiya Mirosh
The Before indicator predicts the most likely short-term price movement based on complex mathematical calculations. Most of the standard indicators commonly used in trading strategies are based on fairly simple calculations. This does not mean that there were no outstanding mathematicians in the world at the time of their creation. It is just that computers did not yet exist in those days, or their power was not enough for the sequential implementation of complex mathematical operations. Nowad
Gets
Andrey Kozak
Gets is a smart trading system with complex market analysis mechanism. The operation principle of Gets is based on neural networks and diversified collection of information from various market analyzers. Then the system analyzes the statistical databases to create a general idea of the current market situation and the further price movement. The information is displayed on the screen in a simple and intuitive way - in the form of buy and sell arrows. Also, the information on the current trend st
Towers
Yvan Musatov
Towers - Trend indicator, shows signals, can be used with optimal risk ratio. It uses reliable algorithms in its calculations. Shows favorable moments for entering the market with arrows, that is, using the indicator is quite simple. It combines several filters to display market entry arrows on the chart. Given this circumstance, a speculator can study the history of the instrument's signals and evaluate its effectiveness. As you can see, trading with such an indicator is easy. I waited for an a
Line Magnit
Aleksey Trenin
The LineMagnit Indicator for MT4 is a highly precise tool that builds support and resistance levels which magnetically attract prices. This feature allows traders to easily determine the most probable entry and exit points in the market, as well as identify the market's directional forces, as levels are based on capital inflows into the instrument. Equipped with an intuitively understandable graphical interface, the LineMagnit Indicator enables users to quickly locate and analyze support and res
Rainbow Price Visualizer v1.21 See where the market really breathes. Turns your MT4 chart into an ultra-precise heatmap that highlights price zones favored by big players. Why it matters 300 price levels at 0.2‑pip resolution — microscopic detail. 8 visual themes (Rainbow, Fire, Ocean…) for instant readibility. Smart opacity: low noise fades, real zones pop. Lightweight rendering with automatic cleanup. Fully customizable: saturation, opacity, resolution, history depth. Bands project into the f
The BB Reversal Arrows technical trading system has been developed to predict reverse points for making retail decisions. The current market situation is analyzed by the indicator and structured for several criteria: the expectation of reversal moments, potential turning points, purchase and sale signals. The indicator does not contain excess information, has a visual understandable interface, allowing traders to make reasonable decisions. All arrows appear to close the candle, without redrawin
Looking for a trading tool based on the Stochastic indicator that can display crossovers arrows on all time frames? Introducing trading indicator : All Time Frame Stochastic Model S ready to help you achieve daily profits. This tool is created using the intersection of two indicator lines of Stochastic  : the main Stochastic and the signal Stochastic . Using this tool makes it easier to observe the real-time dashboard and intersections of multiple timeframes simultaneously. Viewing both higher
Looking for a trading tool based on the Stochastic indicator that can display crossovers arrows on all time frames? Introducing trading indicator : All Time Frame Stochastic Model T ready to help you achieve daily profits. This tool is created using the intersection of two indicator lines of Stochastic  : the main Stochastic  and the signal Stochastic . Using this tool makes it easier to observe the real-time dashboard and intersections of multiple timeframes simultaneously. Viewing both higher
BPSPanel
Remi Passanello
BPS Panel Breakout Pro Scalper Solution Panel This indicator is part of the   RPTrade Pro Solutions  systems. BPS Panel   is a daily trend indicator using Price Action, Dynamic Support and Resistances. It's designed to be used by anyone, even the absolute beginner in trading can use it. NEVER repaints . Indications are given   from close to close . Designed to   be used alone , no other indicators are required. Gives you the trend and potential Take Profit at the beginning of the day. How doe
Chart Patterns Detect 15 patterns (Ascending Triangle, Descending Triangle, Rising Wedge, Falling Wedge, Bullish Flag, Bearish Flag, Bullish Rectangle, Bearish Rectangle Symmetrical triangle, Head and Shoulders, Inverted Head and Shoulders, Triple top, Triple Bottom, Double Top, Double Bottom) Use historical data to calculate the probability of each pattern to succeed (possibility to filter notification according to the chance of success) gives graphic indication about the invalidation level and
Delta Fusion Pro
Francesco Secchi
5 (2)
Delta Fusion Pro – Advanced Order Flow Analysis for Intraday Trading Delta Fusion Pro is a professional indicator for MetaTrader 4 that reveals aggressive order flow, showing the intensity and direction of institutional pressure in real time. Unlike traditional volume indicators, it analyzes the delta between Ask and Bid volumes to anticipate reversals, confirm trends, and identify professional interest zones. Key Features Intelligent Auto-Tuning System Automatically adjusts all parameters ba
Alpha Trend sign has been a very popular trading tool in our company for a long time. It can verify our trading system and clearly indicate trading signals, and the signals will not drift. Main functions: Based on the market display of active areas, indicators can be used to intuitively determine whether the current market trend belongs to a trend market or a volatile market. And enter the market according to the indicator arrows, with green arrows indicating buy and red arrows indicating se
Gold Phoenix
Yaroslav Varankin
The perfect tool for Scalng in the Forex markets You can trade both from signal to signal and using take profit  The algorithm does not use Zigzag!  No redrawing!  This is a channel instrument that uses a moving average as a filter. Moving Average  There are 2 parameters for the settings Ma Period = 5 period Moving Average  Channel 1.0 distance of channel lines from the chart Price Signal Filter - calculation of signal opening and filter There is a complete set of Alert There is a multi-timefram
Powerful Binary Options
Ellan Dirgantara Tholkhah
This is the binary options signal you all have been looking for. This in a modified version of the Garuda Scalper, that has been modified for Binary Options traders. Signals are very unique! Why this is so effective for binary options is because  it is a trend following system, it understands that the trend is your friend. It takes advantage of the buying/selling after the pullback in continuation of the current trend wave.  Because  signals are generated after the pullback,   you can place shor
WanaScalper MT4
Isaac Wanasolo
1 (1)
A scalping indicator based on mathematical patterns, which on average gives signals with relatively small SL, and also occasionally helps to catch big moves in the markets (more information in the video) This indicator has three main types of notifications: The first type warns of a possible/upcoming signal on the next bar The second type indicates the presence of a ready signal to enter the market/open a position The third type is for SL and TP levels - you will be notified every time price re
Renko, Heiken Ashi, Ticks Bar, Range Bar.    Easy switching, easy setup, all in one window.        Place the Custom Chart indicator and view Renko, Heiken Ashi, Tick bar, Range bar charts in real time at real chart.    Position the offline chart window so that the indicator control panel is visible.    Switch the chart mode by click of a button.    Connect to the output chart any indicator, expert advisor without any restrictions.    No, it doesn't work in the tester.    Yes, you can use an
UniversalIndicator is a universal indicator. A great helper for beginners and professional traders. The indicator algorithm uses probabilistic and statistical methods for analyzing the price of a trading instrument. The indicator is set in the usual way. Advantages of the indicator works on any time period works with any trading tool has a high probability of a positive forecast does not redraw Indicator Parameters LengthForecast = 30 - the number of predicted bars
BinaryUniversal
Andrey Spiridonov
BinaryUniversal is a signal indicator for binary options and Forex. In its work, the indicator uses a complex algorithm for generating signals. Before forming a signal, the indicator analyzes volatility, candlestick patterns, important support and resistance levels. The indicator has the ability to adjust the accuracy of the signals, which makes it possible to apply this indicator for both aggressive and conservative trading. The indicator is set in the usual way, it works on any time period and
This is an arrow indicator without a future function,developed based on the most advanced profit trading algorithms.It has the most innovative and advanced dual trend analysis module, as well as the latest and highly effective market trend prediction algorithm.Trends are your friends, and following larger trends can earn the maximum profit in foreign exchange. This indicator helps traders identify current trends and track them. Someone once made a profit of 10 times in a week by relying on it.No
Happy Scalping Indicator
Leandro Bernardez Camero
This indicator was designed for aggressive scalping and quick entries in binary options , generating signals on every candle , so you can know exactly what is happening at all times. Join the Happy Scalping channel: MQL5 It does not repaint : the current candle's signal is generated in REAL TIME , which means it may change while the candle is still forming, depending on whether the price rises or falls compared to the previous candle's close. But once the candle closes , the signal color becom
BinaryScalping
Andrey Spiridonov
BinaryScalping is a professional indicator for trading binary options and scalping. The algorithm of the indicator is based on the calculation of pivot points for each time period separately, the location of the price of the trading instrument relative to the pivot points is analyzed and the probability of a trading operation is calculated. The indicator has a built-in filter of trading signals based on the global trend. The indicator is installed in the usual way and works with any trading inst
Gold Trader Pro Indicator
Massimiliano Tuzzolino
4.4 (5)
Gold Trader Pro is an advanced analytical tool specifically engineered for professional trading on XAUUSD (Gold). It provides an immediate comprehensive overview of market structure across 7 different timeframes, allowing traders to identify flow direction and signal strength through a modern, draggable, and interactive interface. Key Features Multi-Timeframe Analysis: Real-time monitoring of M1, M5, M15, M30, H1, H4, and D1. Two Operational Modes: MODE_SCALPING: Optimized for fast-paced analys
FREE
PZ Divergence Trading
PZ TRADING SLU
5 (2)
Unlock hidden profits: accurate divergence trading for all markets Tricky to find and scarce in frequency, divergences are one of the most reliable trading scenarios. This indicator finds and scans for regular and hidden divergences automatically using your favourite oscillator. [ Installation Guide | Update Guide | Troubleshooting | FAQ | All Products ] Easy to trade Finds regular and hidden divergences Supports many well known oscillators Implements trading signals based on breakouts Display
Trend PA
Mikhail Nazarenko
5 (3)
The Trend PA indicator uses   Price Action   and its own filtering algorithm to determine the trend. This approach helps to accurately determine entry points and the current trend on any timeframe. The indicator uses its own algorithm for analyzing price changes and Price Action. Which gives you the advantage of recognizing, without delay, a new nascent trend with fewer false positives. Trend filtering conditions can be selected in the settings individually for your trading style. The indicator
Market Vortex
Adolfina Denysenko
Market Vortex.mq4 is a powerful arrow indicator designed to accurately identify reversal points and trend continuations. Built on a smoothed oscillator and adaptive moving averages, it helps traders quickly find market entry and exit points without complex calculations. Key Features: Clear arrow signals: The indicator displays Buy/Sell arrows directly on the chart. Real-time operation: Signals are generated without delays or repainting. Adaptive calculation: The indicator uses a do
The concepts within this indicator which give it a unique and sharp edge are based on FAIR VALUE GAPS ''THEORY'' designed and curated by Arjo which is one of the best mentors , and myself have added the development aspect to the concepts explained. The series of videos will include original youtube links for a complete comprehensive explanations, screenshots of the compiled mt4/5 system running. All published  systems will be available on MT4 & MT5 separately to accommodate all platforms and use
QuantumEdge Trader
Hossam Ali Ahmed Ali
QuantumEdge Trader v1.0 AI-Powered Precision Signals for Serious Traders QuantumEdge Trader is a smart and reliable indicator that delivers accurate BUY and SELL signals using advanced market analysis and trend detection. Designed for M1 to M60 timeframes, it's ideal for scalping and intraday strategies. --- Key Features: No Repaint – Signals never change after appearing Smart trend filters to reduce noise Adjustable sensitivity and alerts Perfect for XAUUSD, EURUSD, and m
Trendiness Index
Libertas LLC
5 (3)
"The trend is your friend" is one of the best known sayings in investing, because capturing large trendy price movements can be extremely profitable. However, trading with the trend is often easier said than done, because many indicators are based on price reversals not trends. These aren't very effective at identifying trendy periods, or predicting whether trends will continue. We developed the Trendiness Index to help address this problem by indicating the strength and direction of price trend
Buyers of this product also purchase
The Propfolio Master Suite is the ultimate all-in-one analytical workstation for professional traders. Combining the power of the Beat The Market Maker (BTMM) methodology, Smart Money Concepts (SND/Liquidity), and Advanced Volume Profile, this suite replaces multiple different indicators with one optimized engine. Monitor up to 14 pairs simultaneously from a single chart, instantly identify market cycles, and seamlessly map institutional footprints with the click of a button. The Command Center
NAM Order Blocks
NAM TECH GROUP, CORP.
3.67 (3)
MT4 Multi-timeframe Order Blocks detection indicator. Features - Fully customizable on chart control panel, provides complete interaction. - Hide and show control panel wherever you want. - Detect OBs on multiple timeframes. - Select OBs quantity to display. - Different OBs user interface. - Different filters on OBs. - OB proximity alert. - ADR High and Low lines. - Notification service (Screen alerts | Push notifications). Summary Order block is a market behavior that indicates order collection
Quants HL Break
Ferhat Mutlu
5 (2)
Advanced calculation made by pure price action to find LH and HL breakouts. It will give you a great reversal points in the market. LH and HL signals can used for the traingle breakouts as well. Once breakout happens its indicate strong reversal. Nice filter for Moving Averages. I highly suggest to use that with trend indicators. Can be used as an extra confirmation for support and resistance , supply demand indicators. The indicator is not repainting. Buffers :   SetIndexBuffer ( 0 ,UpBar);
Dynamic Forex28 Navigator
Bernhard Schweigert
4.43 (7)
Specials Discount now. The Next Generation Forex Trading Tool. Dynamic Forex28 Navigator is the evolution of our long-time, popular indicators, combining the power of three into one: Advanced Currency Strength28 Indicator (695 reviews) + Advanced Currency IMPULSE with ALERT (520 reviews) + CS28 Combo Signals (recent Bonus) Details about the indicator  https://www.mql5.com/en/blogs/post/758844 What Does The Next-Generation Strength Indicator Offer? Everything you loved about the originals, now
GoldRush Trend Arrow Signal V1.6 The GoldRush Trend Arrow Signal indicator V1.6 continues to provide precise, real-time trend analysis tailored for high-speed, short-term scalpers in XAU/USD , but it now has additional features and improved efficiency and reliability. Built specifically for the 1-minute time frame, this tool displays directional arrows for clear entry points, allowing scalpers to navigate volatile market conditions with confidence. The indicator consists of PRIMARY and SECONDARY
Introduction to Fractal Pattern Scanner Fractal Indicator refers to the technical indicator that makes use of the fractal geometry found in the financial market. Fractal Pattern Scanner is the advanced Fractal Indicator that brings the latest trading technology after the extensive research and development work in the fractal geometry in the financial market. The most important feature in Fractal Pattern Scanner is the ability to measure the turning point probability as well as the trend probabi
The " Dynamic Scalper System " indicator is designed for the scalping method of trading within trend waves. Tested on major currency pairs and gold, compatibility with other trading instruments is possible. Provides signals for short-term opening of positions along the trend with additional price movement support. The principle of the indicator. Large arrows determine the trend direction. An algorithm for generating signals for scalping in the form of small arrows operates within trend waves.
Technical indicator that structures charts and identifies cyclical price movements. Can work on any charts. Several types of alerts. There are additional arrows on the chart itself. Without redrawing on history, works on closing a candle. Recommended TF from M5 and higher. Easy to use and configure parameters. When using 2 indicators with different parameters, you can use without other indicators. Has 2 input parameters Cyclicality and Signal duration These 2 parameters work with the processin
KuKl
IGOR KIRIANEN
The indicator is built on a non-standard Zig Zag, it draws accumulations after which if the price leaves this zone and a test of this zone occurs, then a sound signal is given and an arrow appears - after the test candle closes.The indicator does not redraw its signals, it is very easy to use, there are only three settings 1- this is the zig zag parameter 2- this is the minimum price exit from the zone 3- this is the maximum price exit from the zone. The lower the parameter for Zig Zag, the more
NAM Divergences
NAM TECH GROUP, CORP.
5 (1)
MT4 Multi-timeframe Divergence and Overbougt/Oversold detection indicator. Features - Fully customizable on chart control panel, provides complete interaction. - Hide and show control panel wherever you want. - Real time information about non-capitalized divergences. - Real time information about overbougt / oversold situations. - Real time information about regular divergences. - Real time information about hidden divergences. - Oscillators available for divergences detection: AO, RSI, CCI, MA
Super Signal – Skyblade Edition Professional No-Repaint / No-Lag Trend Signal System with Exceptional Win Rate | For MT4 / MT5 It works best on lower timeframes, such as 1-minute, 5-minute, and 15-minute charts. Core Features: Super Signal – Skyblade Edition is a smart signal system designed specifically for trend trading. It applies a multi-layered confirmation mechanism to detect only strong, directional moves supported by real momentum. This system does not attempt to predict tops or bottoms
Gold Channel is a volatility-based indicator, developed with a specific timing algorithm for the XAUUSD pair, which consists of finding possible corrections in the market. This indicator shows two outer lines, an inner line (retracement line) and an arrow sign, where the theory of the channel is to help identify overbought and oversold conditions in the market. The market price will generally fall between the boundaries of the channel. If prices touch or move outside the channel it is a tradi
Miraculous Indicator – 100% Non-Repaint Forex and Binary Tool Based on Gann Square of Nine This video introduces the Miraculous Indicator , a highly accurate and powerful trading tool specifically developed for Forex and Binary Options traders. What makes this indicator unique is its foundation on the legendary Gann Square of Nine and Gann's Law of Vibration , making it one of the most precise forecasting tools available in modern trading. The Miraculous Indicator is fully non-repaint, meaning t
Trend Signal Advanced System - is a trading system operating within a trend channel, detecting price movements following a trend correction. The signal search algorithm operates on the current price candle, generating signals at the highs and lows of the last candle. It includes integrated built-in indicators and filters. It allows you to find trading signals based on the intraday trend-correction system, detecting short- and medium-term movements. The system features a trend detector based on
IQ FX Gann Levels a precision trading indicator based on W.D. Gann’s square root methods . It plots real-time, non-repainting support and resistance levels to help traders confidently spot intraday and scalping opportunities with high accuracy. William Delbert Gann (W.D. Gann) was an exceptional market analyst, whose trading technique was based on a complex blend of mathematics, geometry, astrology, and ancient mathematics which proved to be extremely accurate. Setup & Guide:  Download  MT5 Ver
Precautions for subscribing to indicator This indicator only supports the computer version of MT4 Does not support MT5, mobile phones, tablets The indicator only shows the day's entry arrow The previous history arrow will not be displayed (Live broadcast is for demonstration) The indicator is a trading aid Is not a EA automatic trading No copy trading function The indicator only indicates the entry position No exit (target profit)  The entry stop loss point is set at 30-50 PIPS Or the front hi
Please send me Direct message on MQL5 CHAT after purchasing the Indicator for Training and Installation Support There are some additional files that is important to use with the Indicator . So be sure to contact me after purchasing the Indicator So that I can add you for training and support . If you find any difficulty with installation then send me Direct message here So that I can connect with you via Anydesk or Teamview for the product installation. " Smart Order Block Indicator " to find m
KT Alpha Hunter Arrows MT4
KEENBASE SOFTWARE SOLUTIONS
Most arrow indicators give you a signal and leave you to figure out the rest. KT Alpha Hunter Arrows gives you the full trading plan. Every signal arrow prints with a full plan already drawn: entry line, stop-loss, four take-profit levels, and a live edge verdict telling you whether this symbol and time-frame is worth trading right now. An included Trade Manager EA handles the execution after you enter, so discipline stays intact when the market gets loud. Non-repaint. Closed-bar signals only. B
Supply and Demand Dashboard PRO
Bernhard Schweigert
4.8 (20)
Trading Special – 40% OFF This dashboard is a very powerful piece of software working on multiple symbols and up to 9 timeframes. It is based on our main indicator (Best reviews:   Advanced Supply Demand ). The dashboard gives a great overview. It shows: Filtered Supply and Demand values including zone strength rating, Pips distances to/and within zones, It highlights nested zones, It gives 4 kind of alerts for the chosen symbols in all (9) time-frames. It is highly configurable for your pers
Trading Special – 40% OFF Best Solution for any Newbie or Expert Trader! This dashboard software is working on 28 currency pairs plus one. It is based on 2 of our main indicators (Advanced Currency Strength 28 and Advanced Currency Impulse). It gives a great overview of the entire Forex market plus Gold or 1 indices. It shows Advanced Currency Strength values, currency speed of movement and signals for 28 Forex pairs in all (9) timeframes. Imagine how your trading will improve when you can watch
El indicador "MR BEAST ALERTAS DE LIQUIDEZ" es una herramienta avanzada diseñada para proporcionar señales y alertas sobre la liquidez del mercado basándose en una serie de indicadores técnicos y análisis de tendencias. Ideal para traders que buscan oportunidades de trading en función de la dinámica de precios y los niveles de volatilidad, este indicador ofrece una visualización clara y detallada en la ventana del gráfico de MetaTrader. Características Principales: Canal ATR Adaptativo: Calcula
First of all Its worth emphasizing here that this Trading Tool is Non-Repainting Non-Redrawing and Non-Lagging Indicator Which makes it ideal for professional trading . [Online course] ,   and   [manual] The Smart Price Action Concepts Indicator is a very powerful tool for both new and experienced traders . It packs more than 20 useful indicators into one combining advanced trading ideas like Inner Circle Trader Analysis and Smart Money Concepts Trading Strategies . This indicator focuses on Sm
Meravith
Ivan Stefanov
5 (3)
Market makers' tool. Meravith will: Analyze all timeframes and display the current trend in force. Highlight liquidity zones (volume equilibrium) where bullish and bearish volumes are equal. Display all liquidity levels across different timeframes directly on your chart. Generate and present text-based market analysis for your reference. Calculate targets, support levels, and stop-loss points based on the current trend. Compute the risk/reward ratio for your trades. Determine position size accor
TPA True Price Action indicator reveals the true price action of the market makers through 100% non-repainting signals (except early signals mode) strictly at the close of a candle! TPA shows entries and re-entries, every time the bulls are definitely stronger than the bears and vice versa. Not to confuse with red/green candles. The shift of power gets confirmed at the earliest stage and is ONE exit strategy of several. There are available now two free parts of the TPA User Guide for our custom
No Repaint Bext
Andrey Kozak
1 (1)
No Repaint Bext is a ready-made trading system. Shows when to open and when to close trades, as well as in which direction. Every time a green arrow appears, you need to open a buy trade. Close all buy trades when a red arrow appears. The same goes for the opposite direction, every time a red arrow appears, open sell trades and close them all when a green arrow appears. We use the M5 timeframe for trading. You can trade on any cozy pair. This indicator does not repaint and practically does not
RelicusRoad Pro
Relicus LLC
4.65 (107)
RelicusRoad Pro: Quantitative Market Operating System 70% OFF LIFETIME ACCESS (LIMITED TIME) - JOIN 2,000+ TRADERS Why do most traders fail even with "perfect" indicators? Because they trade Single Concepts in a vacuum. A signal without context is a gamble. To win consistently, you need CONFLUENCE . RelicusRoad Pro is not a simple arrow indicator. It is a complete Quantitative Market Ecosystem . It maps the "Fair Value Road" price travels on, distinguishing between random noise and true structur
Binary Booster
Yaroslav Varankin
5 (1)
Binary Options Trading Indicator: A Reliable Tool for Your Trades This indicator is specifically designed for binary options trading and has proven its high quality, reliability, and adequate accuracy, depending on the dynamics of the chart. Key Points: Signal Interpretation: When a blue cross signal appears, it indicates a potential entry into a trade, though it is considered a weak signal on its own. However, if the blue cross is accompanied by an arrow, it is considered a more reliable buy s
Advanced Market Footprint Profiles is a specialized market analysis tool, representing a customized volume distribution profile enhanced with Delta and Bid/Ask profiles. The indicator builds fixed horizontal profiles (Fixed Range), displaying the distribution of Volume, Delta, and Bid/Ask at each price level with high precision. Unlike standard horizontal volume profiles, which only show overall volume distribution, this indicator combines Volume, Delta, and Bid/Ask within the selected range a
Binary Options Support Resistance Indicator This indicator is designed for binary options trading and effectively shows retracements from support and resistance levels. Signals appear on the current candle. A red arrow pointing downwards indicates a potential selling opportunity, while a blue arrow pointing upwards suggests buying opportunities. All that needs adjustment is the color of the signal arrows. It is recommended to use it on the M1-M5 timeframes as signals are frequent on these timef
ECM Elite Channel is a volatility-based indicator, developed with a specific time algorithm, which consists of finding possible corrections in the market. This indicator shows two outer lines, an inner line (retracement line) and an arrow sign, where the channel theory is to help identify overbought and oversold conditions in the market. The market price will generally fall between the boundaries of the channel. If prices touch or move outside the channel, it's a trading opportunity. The ind
More from author
Analyzing multiple time frames of a currency pair in one window can make you confused. To analyze multiple time frames, you need reliable indicators. One of them is using 9TF STOCH RSI . I've been working day and night to create code that is simple but reliable and covers all nine time frames in just one indicator .  Let's look at some of the advantages of this indicator: Colorful histogram . The color of the curve in each timeframe is different from one another.  Arrows indicating the crossing
Analyzing multiple time frames of a currency pair in one window can make you confused. To analyze multiple time frames, you need reliable indicators. One of them is using 9TF RSI MA . I've been working day and night to create code that is simple but reliable and covers all nine time frames in just one indicator .  Let's look at some of the advantages of this indicator: Colorful histogram . The color of the curve in each timeframe is different from one another.  Arrows indicating the crossing of
Analyzing multiple time frames of a currency pair in one window can make you confused. To analyze multiple time frames, you need reliable indicators. One of them is using 9TF Double RSI Double MA . I've been working day and night to create code that is simple but reliable and covers all nine time frames in just one indicator .  Let's look at some of the advantages of this indicator: Double RSI , i.e RSI faster & RSI slower. Double MA , i.e MA faster & MA slower. MA angle of fast & slow. ( Note
Analyzing multiple time frames of a currency pair in one window can make you confused. To analyze multiple time frames, you need reliable indicators. One of them is using 9TF Double CCI Double MA . I've been working day and night to create code that is simple but reliable and covers all nine time frames in just one indicator .  Let's look at some of the advantages of this indicator: Double CCI , i.e CCI faster & CCI slower. Double MA , i.e MA faster & MA slower. MA angle of fast & slow. ( Note
An accurate CCI indicator is available. Dashboard Trend Bar Smart Level 9TF Double CCI. Double CCI , i.e Fast CCI & Slow CCI Why you need second CCI? Using additional indicators will convince us more in live trading 9TF Fast CCI curve 9TF Slow CCI curve 9TF real time  CCI angle 9TF real time CCI value 9TF real time CCI direction/phase 9TF Trend Bar   New algo in calculating trend bar On/off Button . Very useful to show/hide indicator in just one click Real time 9TF dashboard monitor   Ability to
An accurate RSI indicator is available. Dashboard Trend Bar Smart Level 9TF Double RSI. Double RSI , i.e Fast RSI & Slow RSI Why you need second RSI? Using additional indicators will convince us more in live trading 9TF Fast RSI curve 9TF Slow RSI curve 9TF real time  RSI angle 9TF real time RSI value 9TF real time RSI direction/phase 9TF Trend Bar   New algo in calculating trend bar On/off Button . Very useful to show/hide indicator in just one click Real time 9TF dashboard monitor   Ability to
An accurate MACD indicator is available. Dashboard Trend Bar Smart Level 9TF Dual MACD. Dual MACD , i.e Fast (MACD 1) & Slow (MACD 2) Why you need second MACD? Using additional indicators will convince us more in live trading 9TF Fast MACD 1 curve 9TF Slow MACD 2 curve 9TF real time  MACD angle 9TF real time MACD value 9TF real time MACD direction/phase 9TF Trend Bar   New algo in calculating trend bar On/off Button . Very useful to show/hide indicator in just one click Real time 9TF dashboard m
An accurate Stochastic indicator is available. Dashboard Trend Bar Smart Level 9TF Dual Stochastic. Dual Stochastic , i.e Fast Stochastic & Slow Stochastic  Why you need second Stochastic? Using additional indicators will convince us more in live trading 9TF Fast Stochastic curve 9TF Slow Stochastic curve 9TF real time  Stochastic angle 9TF real time Stochastic value 9TF real time Stochastic direction/phase 9TF Trend Bar   New algo in calculating trend bar On/off Button . Very useful to show/hid
If you are looking for a trading tool that combines various indicators, then you are on the right page. Why do we need to combine different indicators? THE ANSWER IS TO STRENGTHEN THE SIGNAL. It is possible that the RSI is rising at that time but is the moving average also rising? Is the stochastic also rising? Is the CCI also rising? Sometimes RSI keeps going up even though it is already in the overbought area. Even at 100 it is still going up. Is it safe for us to take a sell position when R
[V 2.00] MTF NRPA 5 Moving Average RTD has been released! ( New sub buttons 2025 ) Non repaint arrow real time dashboard. If you are looking for the best moving average indicator then you are on the right page. Generally people will install two moving averages because the intersection of the two moving averages (the crossover) will determine the direction of the next price trend. If the fast moving average intersects with the slow moving average and fast > slow then the trend is up. Conversely,
[V 1.90] MTF NRPA 5 RSI RTD has been released! ( New sub buttons 2025 ) Non repaint arrow real time dashboard. If you are tired of using various RSI indicators but find that they are inaccurate, then try this one tool. Usually people only install 1 RSI to determine the OBOS level in a timeframe. The bad news is that you can't see OBOS levels and trends in various timeframes at once. That's why I developed this trading tool. Here's how it's explained: On this trading tool, I use five RSI. Yes, o
Introducing the advanced trading tools of 2023. MTF PPAAF Model S. This is sub window version of my best trading tool : MTF Precise Price Action Arrow Filtered.  Click here to learn more about MTF PPAAF . This trading tool is equipped with various powerful features : MTF = Multi Time Frame = Time Frame can be changed. On/off button. Non Repaint Arrows.  Customizable parameter, color etc.  Can show all time frame (ATF) crossover arrows of fast stochastic main line & fast stochastic signal line (
If you are curious about the position of the stochastic, RSI, CCI curve, whether it is at the OBOS level or not, then this trading tool is for you. Introducing the advanced trading tools of 2024. ATF Trend Following Trend Bar OBOS. This indicator is similar to MTF PPAAF Model S but have two layers.  Click here to learn more about MTF PPAAFS . This trading tool is equipped with various powerful features : MTF = Multi Time Frame = Time Frame can be changed. On/off button. Customizable parameter,
Hello traders. Introducing my best trading tool : MTF PPAAF Model T. Multi Time Frame Precise Price Action Arrow Filtered Model T. This trading tool is my best work after years of making various trading tools. This trading tool is similar to the original MTF PPAAF but you can monitor per TF curve of Double RSI and Stochastic visually from M1 to MN which is very very important! If you are looking for a multi-timeframe trading tool that combines several indicators and is equipped with a dashboar
With this trading tool, you can scan 15 markets simultaneously . Introducing, new trading indicator 2024 : ️ Dashboard Multi Currency Multi Time Frame Stochastic. There are at least two reasons why I created this trading tool : First , I'm bored of only observing one market. Second , I don't want to lose the entry moment in another market. That's why I want to know other market conditions at the same time. For this reason, I need a scanner that can scan the conditions of several markets si
With this trading tool, you can scan 15 markets simultaneously . Introducing, new trading indicator 2024 : ️ Dashboard Multi Currency Multi Time Frame Double CCI. There are at least two reasons why I created this trading tool : First , I'm bored of only observing one market. Second , I don't want to lose the entry moment in another market. That's why I want to know other market conditions at the same time. For this reason, I need a scanner that can scan the conditions of several markets si
With this trading tool, you can scan 15 markets simultaneously . Introducing, new trading indicator 2024 : ️ Dashboard Multi Currency Multi Time Frame Double RSI. There are at least two reasons why I created this trading tool : First , I'm bored of only observing one market. Second , I don't want to lose the entry moment in another market. That's why I want to know other market conditions at the same time. For this reason, I need a scanner that can scan the conditions of several markets si
Looking for a trading tool based on the CCI indicator that can display crossovers arrows on all time frames? Introducing trading indicator : All Time Frame Double CCI Model T ready to help you achieve daily profits. This tool is created using the intersection of two CCI (Double CCI) indicator lines: the main CCI and the signal CCI. Using this tool makes it easier to observe the real-time dashboard and intersections of multiple timeframes simultaneously. Viewing both higher and lower timeframes
Looking for a trading tool based on the CCI indicator that can display crossovers arrows on all time frames? Introducing trading indicator : All Time Frame Double CCI Model S ready to help you achieve daily profits. This tool is created using the intersection of two CCI (Double CCI) indicator lines: the main CCI and the signal CCI. Using this tool makes it easier to observe the real-time dashboard and intersections of multiple timeframes simultaneously. Viewing both higher and lower timeframes
Looking for a trading tool based on the MACD indicator that can display crossovers arrows on all time frames? Introducing trading indicator : All Time Frame MACD Model S ready to help you achieve daily profits. This tool is created using the intersection of two indicator lines of MACD : the main MACD and the signal MACD. Using this tool makes it easier to observe the real-time dashboard and intersections of multiple timeframes simultaneously. Viewing both higher and lower timeframes simultaneou
Looking for a trading tool based on the Stochastic indicator that can display crossovers arrows on all time frames? Introducing trading indicator : All Time Frame Stochastic Model T ready to help you achieve daily profits. This tool is created using the intersection of two indicator lines of Stochastic  : the main Stochastic  and the signal Stochastic . Using this tool makes it easier to observe the real-time dashboard and intersections of multiple timeframes simultaneously. Viewing both higher
Looking for a trading tool based on the Stochastic indicator that can display crossovers arrows on all time frames? Introducing trading indicator : All Time Frame Stochastic Model S ready to help you achieve daily profits. This tool is created using the intersection of two indicator lines of Stochastic  : the main Stochastic and the signal Stochastic . Using this tool makes it easier to observe the real-time dashboard and intersections of multiple timeframes simultaneously. Viewing both higher
Looking for a trading tool based on the RSI indicator that can display crossovers arrows on all time frames? Introducing trading indicator : All Time Frame Double RSI Model T ready to help you achieve daily profits. This tool is created using the intersection of two RSI (Double RSI) indicator lines: the main RSI and the signal RSI. Using this tool makes it easier to observe the real-time dashboard and intersections of multiple timeframes simultaneously. Viewing both higher and lower timeframes
Looking for a trading tool based on the RSI indicator that can display crossovers arrows on all time frames? Introducing trading indicator : All Time Frame Double RSI Model S ready to help you achieve daily profits. This tool is created using the intersection of two RSI (Double RSI) indicator lines: the main RSI and the signal RSI. Using this tool makes it easier to observe the real-time dashboard and intersections of multiple timeframes simultaneously. Viewing both higher and lower timeframes
Looking for a trading tool based on the moving average indicator that can display crossovers arrows on all time frames? Introducing trading indicator : All Time Frame Two MA Model T ready to help you achieve daily profits. This tool is created using the intersection of two moving average  indicator lines: the main MA1 and the signal MA2. Using this tool makes it easier to observe the real-time dashboard and intersections of multiple timeframes simultaneously. Viewing both higher and lower timef
Looking for a trading tool based on the moving average indicator that can display crossovers arrows on all time frames? Introducing trading indicator : All Time Frame Two MA Model S ready to help you achieve daily profits. This tool is created using the intersection of two moving average indicator lines: the main MA1 and the signal MA2. Using this tool makes it easier to observe the real-time dashboard and intersections of multiple timeframes simultaneously. Viewing both higher and lower timefr
Filter:
No reviews
Reply to review