Nine Timeframes Stoch RSI
- Indicateurs
-
Anon Candra N
 I am a professional trader who has been in the stock market for several years. After making in-depth observations of the stock market, I developed the trading tools that have helped my trading career so far. The good news is, you can have these trading tools on this website.
 - Version: 1.10
- Mise à jour: 9 décembre 2022
- Activations: 15
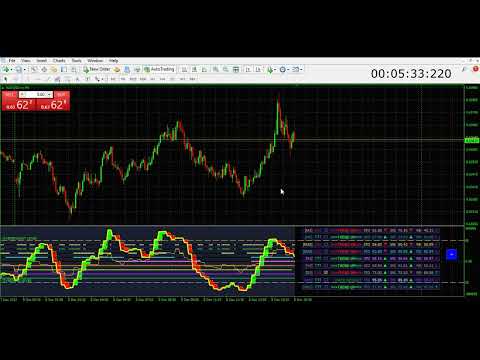
L'analyse de plusieurs périodes d'une paire de devises dans une seule fenêtre peut vous rendre confus.
Pour analyser plusieurs échelles de temps, vous avez besoin d'indicateurs fiables.
L'un d'eux utilise 9TF STOCH RSI.
J'ai travaillé jour et nuit pour créer un code simple mais fiable et couvrant les neuf périodes de temps dans un seul indicateur.
Regardons quelques-uns des avantages de cet indicateur :
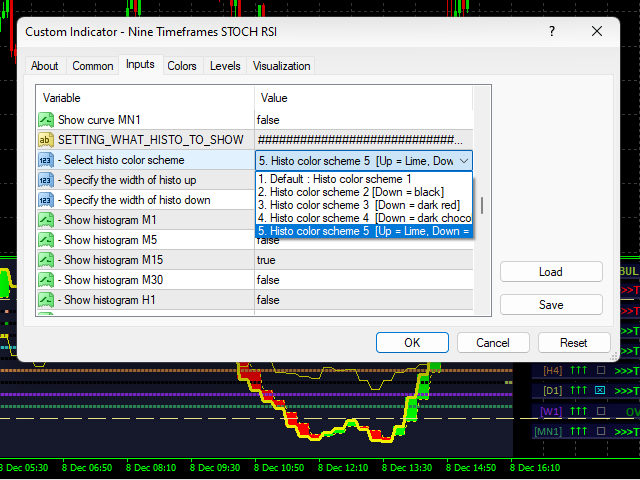
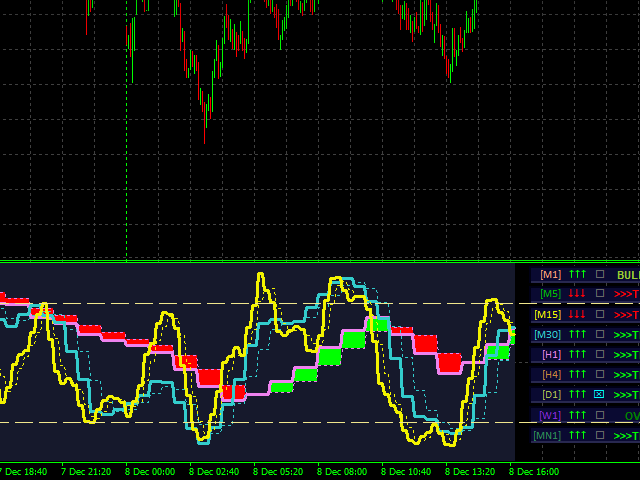
Histogramme coloré.
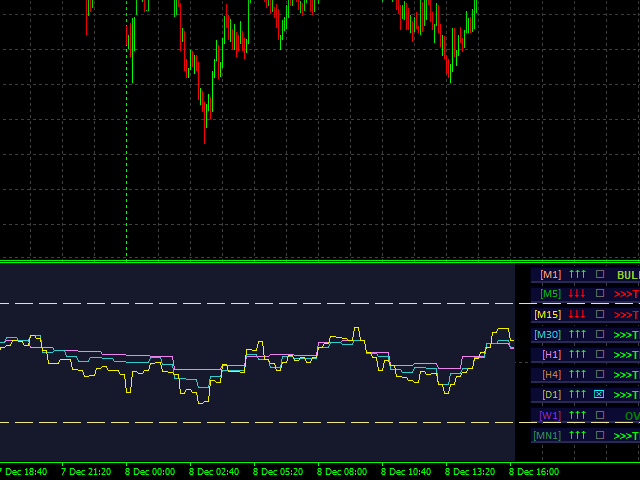
La couleur de la courbe dans chaque période est différente l'une de l'autre.
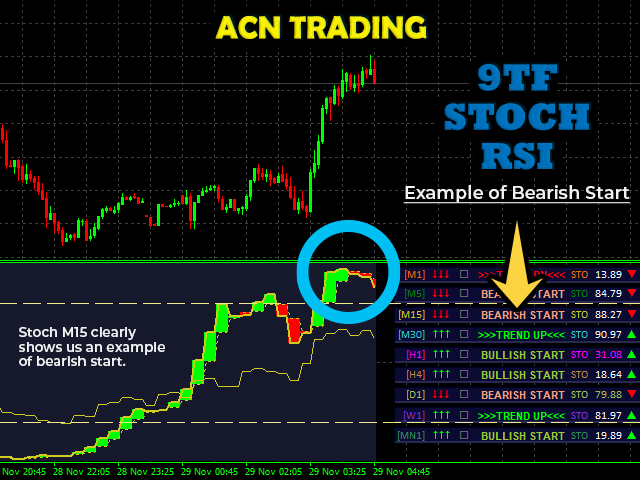
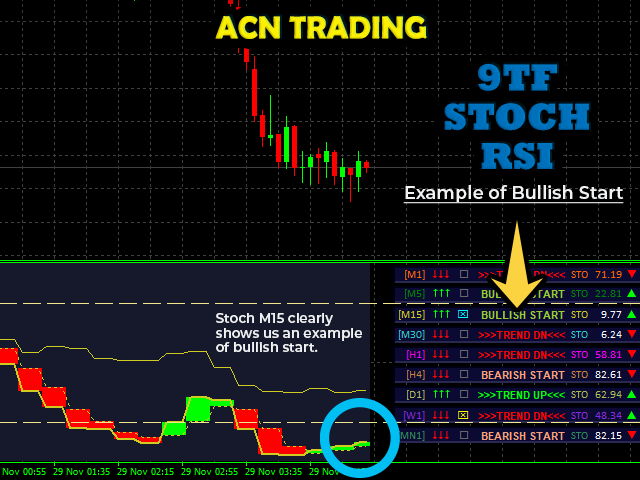
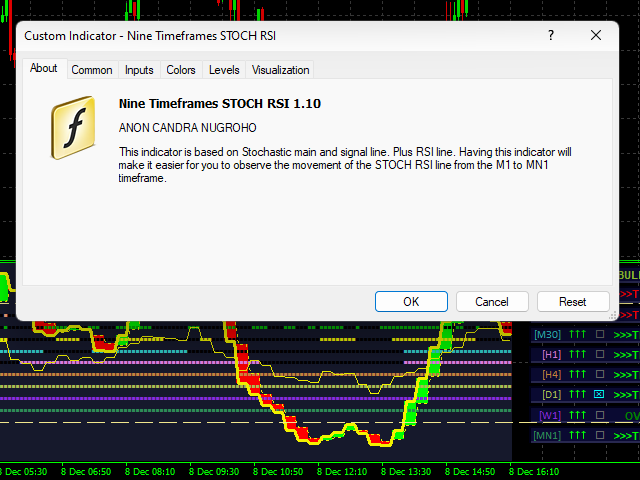
Flèches indiquant le croisement de la ligne principale STOCHASTIC et de la ligne de signal. (Remarque : ignorez la dernière flèche qui apparaît !)
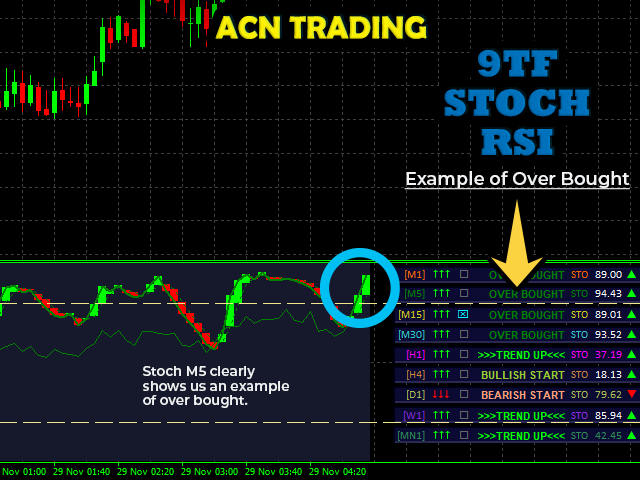
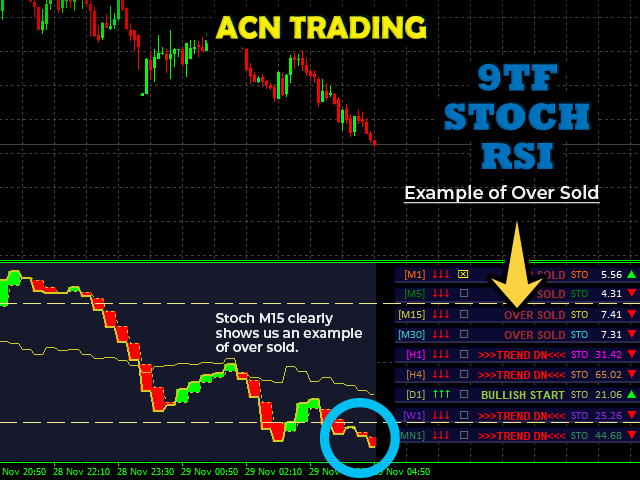
Ligne de niveau OBOS.
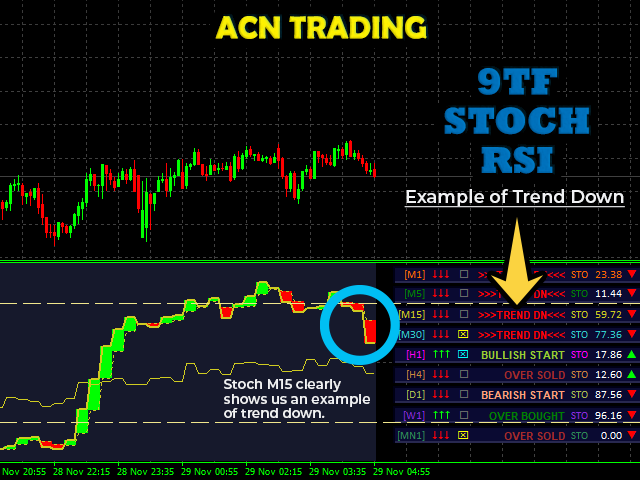
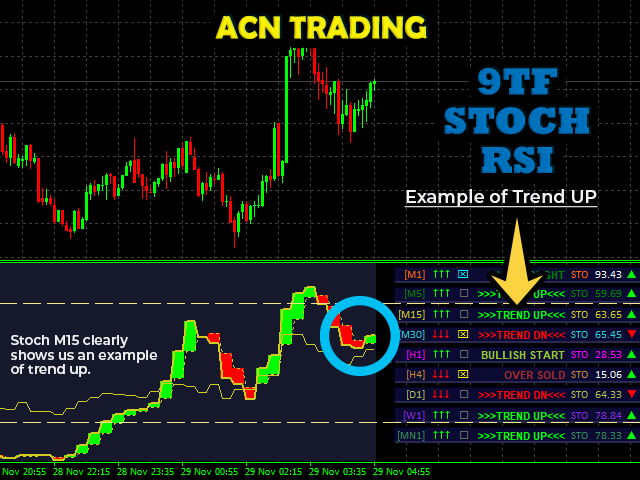
Moniteur de tableau de bord 9TF en temps réel.
Les calculs du moniteur de tableau de bord 9TF sont très précis même si vous changez d'une période à l'autre.
Surveiller quelle courbe est au-dessus du niveau de surachat et laquelle est en dessous du niveau de survente.
Surveiller la courbe si le STOCH principal est au-dessus du signal STOCH ou vice versa.
Surveiller la courbe s'il y a un croisement entre le STOCH principal et le signal STOCH.
Surveillance du mouvement du signal actuel avec le signal précédent. A la hausse ou à la baisse. (Remarque : il s'agit d'une fonctionnalité très importante pour le scalping !)
Surveillance du mouvement de la ligne RSI.
Une fonction de barre de tendance très importante pour repérer la tendance à plus long terme.
Possibilité de changer la couleur.
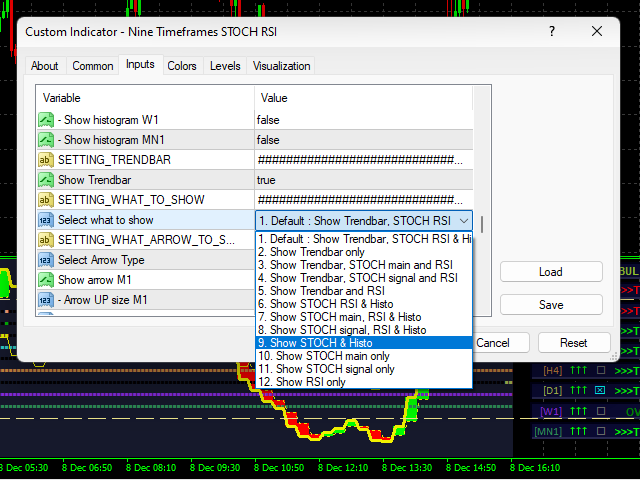
Possibilité de choisir la courbe à afficher.
Possibilité de choisir l'histogramme à afficher.
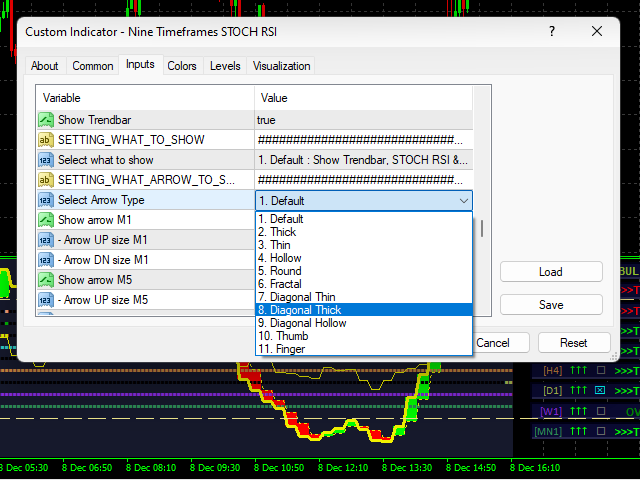
Possibilité de choisir quelle flèche afficher.
Possibilité de placer le moniteur de tableau de bord 9TF à l'emplacement souhaité.
Possibilité d'afficher ou de masquer l'indicateur en un seul clic.
Capacité à surveiller le mouvement de l'action des prix de la période la plus élevée à la petite période.
Peut être utilisé pour analyser le forex, les indices, le métal/l'énergie, les actions et la crypto-monnaie.
Vous pouvez regarder la fonctionnalité complète sur ma chaîne YouTube. Rien à cacher.
Mon intention de créer cet indicateur est d'augmenter vos gains et vos profits.
Faites des entrées en toute confiance avec le meilleur indicateur de trading STOCH RSI.
Obtenez maintenant et tradez comme un pro.
Merci.