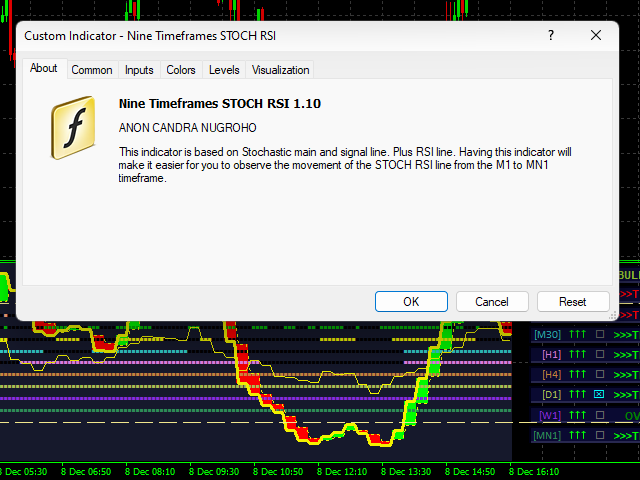
Nine Timeframes Stoch RSI
- 指标
- 版本: 1.10
- 更新: 9 十二月 2022
- 激活: 15

在一个窗口中分析货币对的多个时间范围可能会让您感到困惑。
要分析多个时间范围,您需要可靠的指标。
其中之一是使用 9TF STOCH RSI。
我夜以继日地工作,以创建简单但可靠的代码,并在一个指标中涵盖所有九个时间范围。
让我们看一下该指标的一些优点:
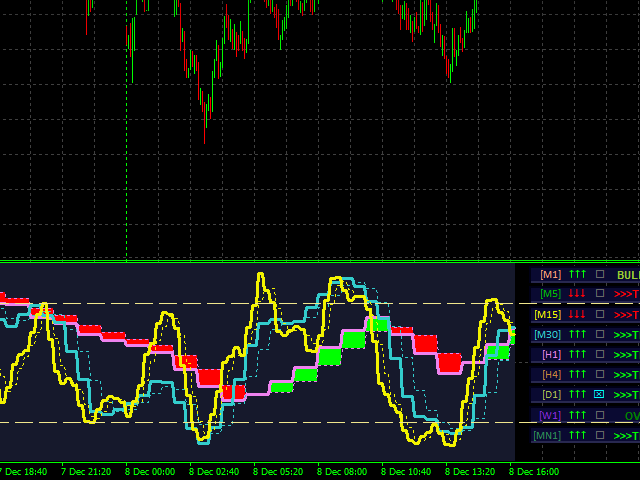
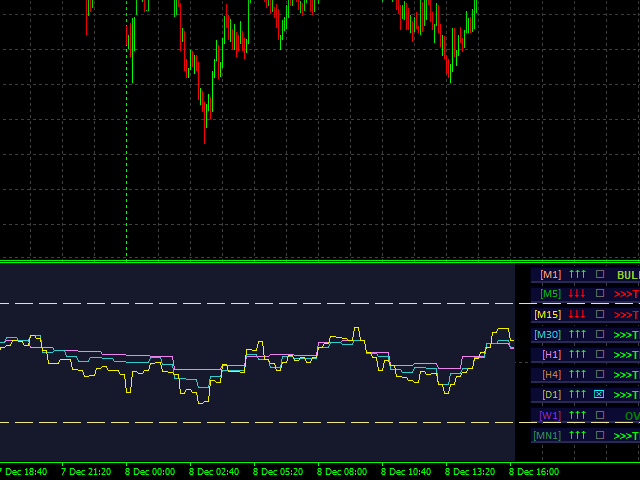
彩色直方图。
每个时间范围内的曲线颜色各不相同。
指示 STOCHASTIC 主线和信号线交叉的箭头。 (注意:忽略出现的最后一个箭头!)
OBOS水平线。
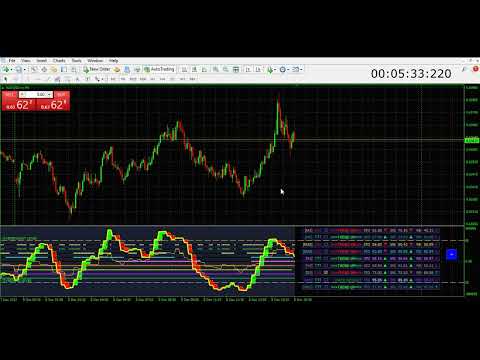
实时 9TF 仪表板监视器。
9TF 仪表板监视器计算非常准确,即使您从一个时间范围更改为另一个时间范围也是如此。
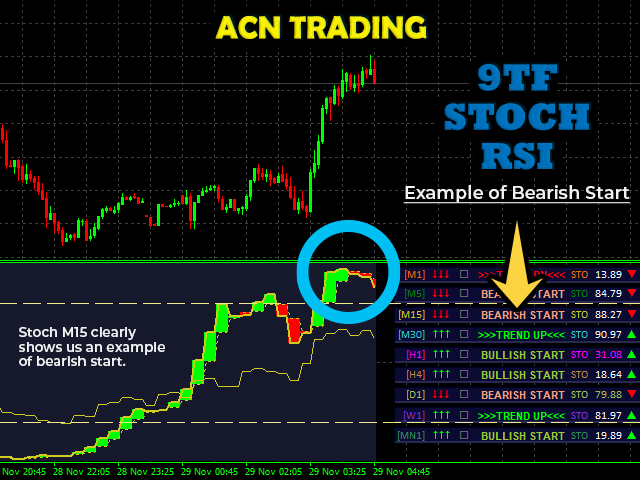
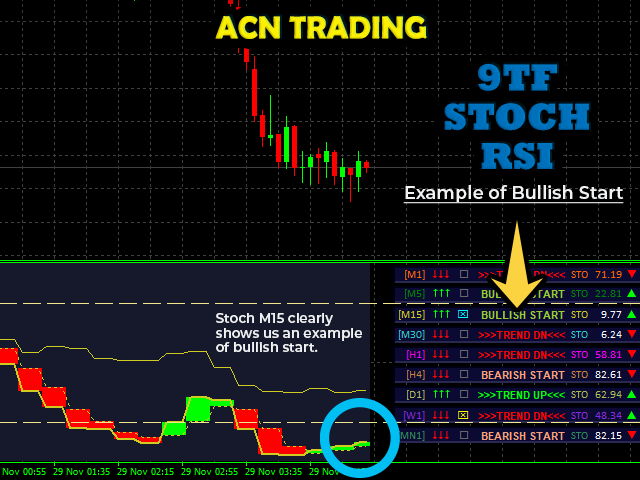
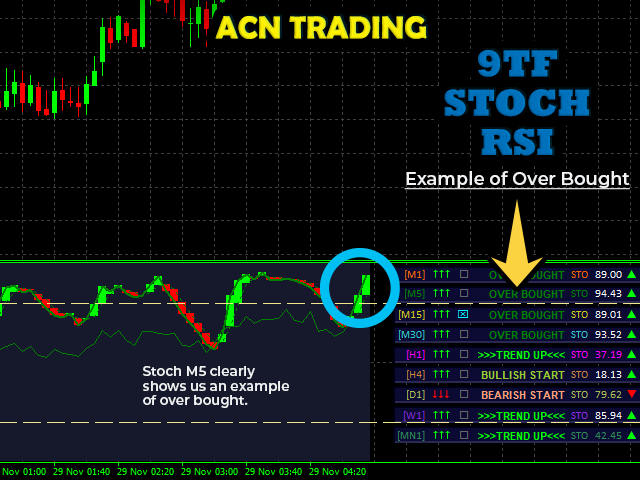
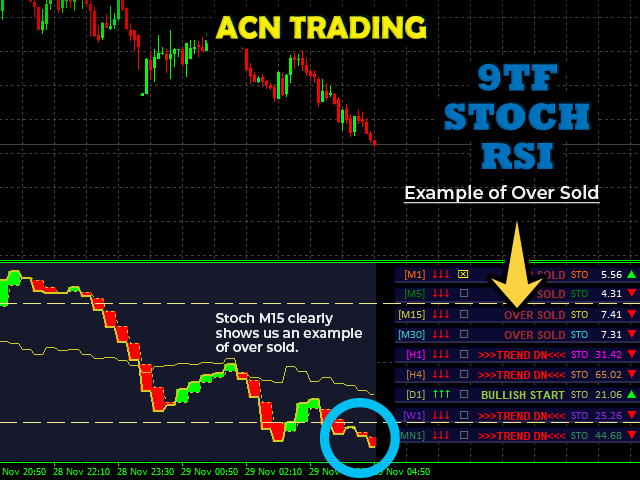
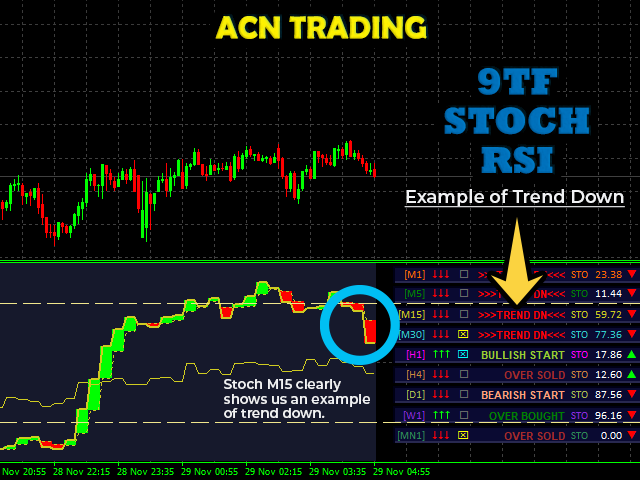
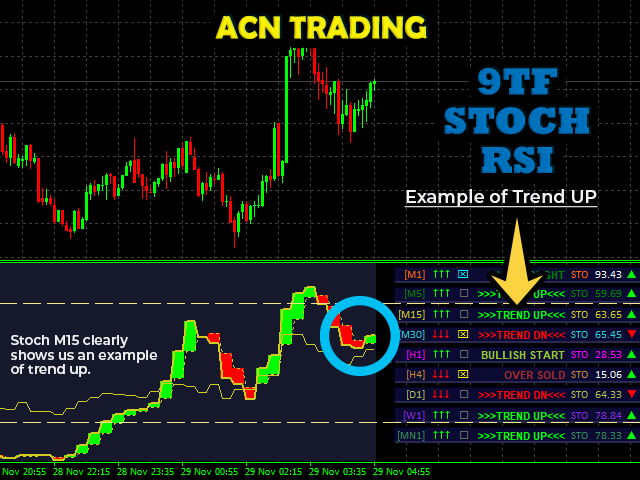
监控哪条曲线高于超买水平,哪条曲线低于超卖水平。
监测主 STOCH 是否高于信号 STOCH 的曲线,反之亦然。
监控主 STOCH 和信号 STOCH 之间是否有交叉的曲线。
监视当前信号与先前信号的移动。 在上升或下降的过程中。 (注意:这是剥头皮非常重要的功能!)
监测 RSI 线的运动。
一个非常重要的趋势栏功能,用于发现长期趋势。
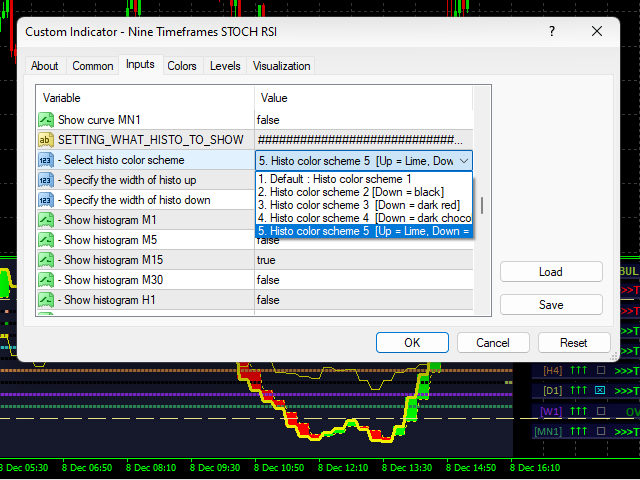
改变颜色的能力。
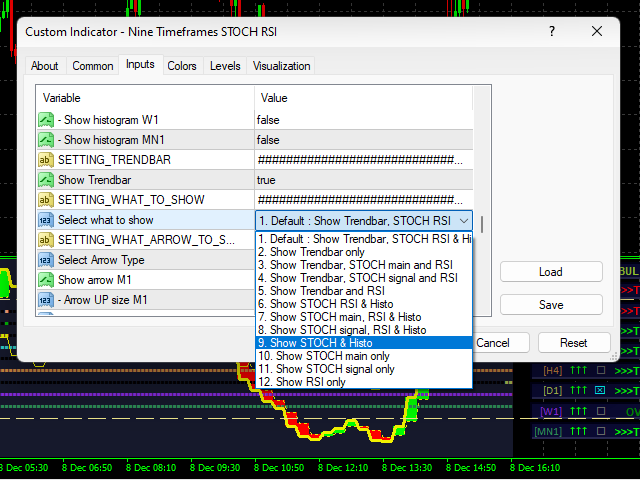
能够选择要显示的曲线。
能够选择要显示的直方图。
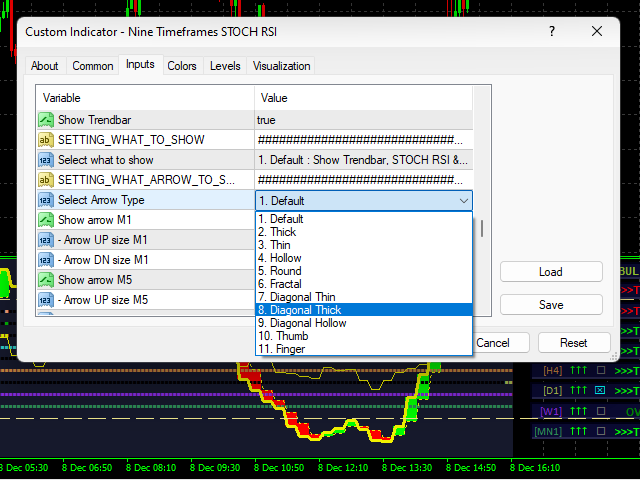
能够选择显示哪个箭头。
能够将 9TF 仪表板显示器放置在您想要的位置。
只需单击一下按钮即可显示或隐藏指示器。
能够监控从较高时间范围到较小时间范围的价格走势。
可用于分析外汇、指数、金属/能源、股票和加密货币。
您可以在我的 YouTube 频道上观看完整功能。 没有什么好隐藏的。
我制作此指标的目的是增加您的获胜和利润。
使用最好的 STOCH RSI 交易指标自信入场。
立即获取并像专业人士一样进行交易。
谢谢你。