MTF Non Repaint Arrow Five RSI RTD
- Indicators
-
Anon Candra N
 I am a professional trader who has been in the stock market for several years. After making in-depth observations of the stock market, I developed the trading tools that have helped my trading career so far. The good news is, you can have these trading tools on this website.
 - Version: 2.10
- Updated: 9 July 2026
- Activations: 20
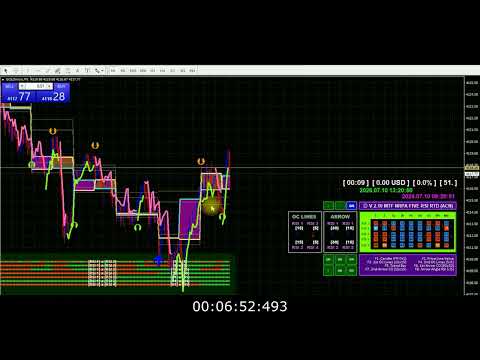
[V2.10] MTF NRPA 5 RSI RTD (New 2026 Algorithm)
Follow the steps below to maximize your trading performance:
- Open chart on 1 minute timeframe
- Don't forget to set a stop loss
In this latest update, I've added 7 brand-new Trend Bars, giving you even more flexibility to analyze market direction.
Each Trend Bar can now calculate trends based on either RSI 1 × RSI 2 or RSI 3 × RSI 4, allowing you to customize your multi-timeframe confirmation strategy.
The Arrow Crossover has also been upgraded.
In the latest version, crossover signals can now be generated using either RSI 1 × RSI 2 or RSI 3 × RSI 4, providing more accurate and versatile trading confirmations.
The On Chart Lines has also been upgraded.
In the latest version, on chart lines can now be generated using either RSI 1 × RSI 2 or RSI 3 × RSI 4 or custom parameter.
You can use double line or single line.
It DOES repaint, very disappointed.
I did purchase this because you clearly state on your title and description that your thing does NOT repaint, now you say that it DOES repaint and that it's normal. I call this a scam. By the way, keep your "keep learning" for you, you don't know who i am and if am or not an experienced trader. You refund me please as your claim "non repaint arrow" is wrong, thanks.
Why? Because they set the risk reward ratio inside the algorithm. They can't control what is going on inside the brain of millions of traders. They can't tell you precisely when to buy and when to sell. What I can do as a developer (and also trader) is anticipate whether there's crossover lines or not. This trading indicator is based on technical analysis, i.e crossover of two lines and angle of line. If there is crossover between two lines then the arrows appear and NON REPAINT. But because of price action (market volatility), after several seconds or minutes, if the two lines failed to cross (it's just a test and won't last long) then the arrows disappear. And it must be disappear. Otherwise, the algorithm is wrong. Same logic applied to angle of line. If the angle of line is positive then up arrow appear. Likewise, if the angle of line is negative then down arrow appear. So if you see why arrow M1 repaint? Because of price action (I can't control people mind).
Why arrow M5 repaint? Because of price action. Why arrow M15 repaint? Because of price action. Why arrow M30 repaint? Because of price action. etc. To help you make better decision, this indicator is also equipped with REAL TIME 9TF dashboard monitor. Please monitor patiently such as buy when RSI from M1 to H4 all UP.
And sell when RSI from M1 to H4 all Down. Thank you for your purchase. And keep learning.