- Overview
- Reviews
- Comments
Breakout Trend Lines Free
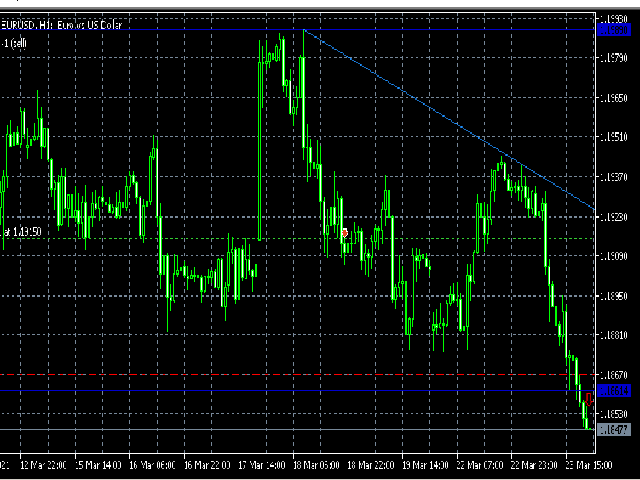
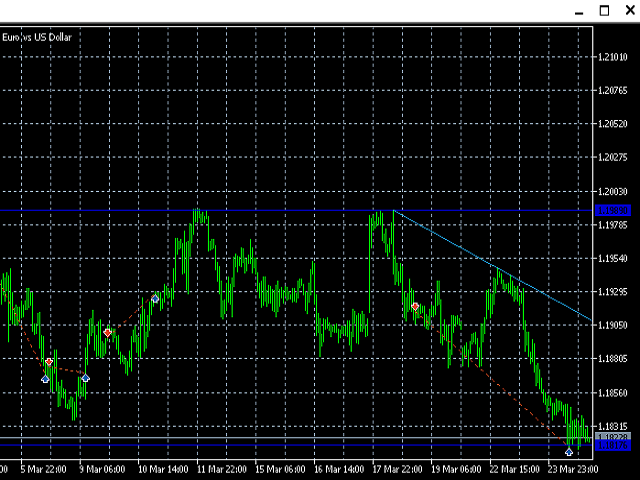
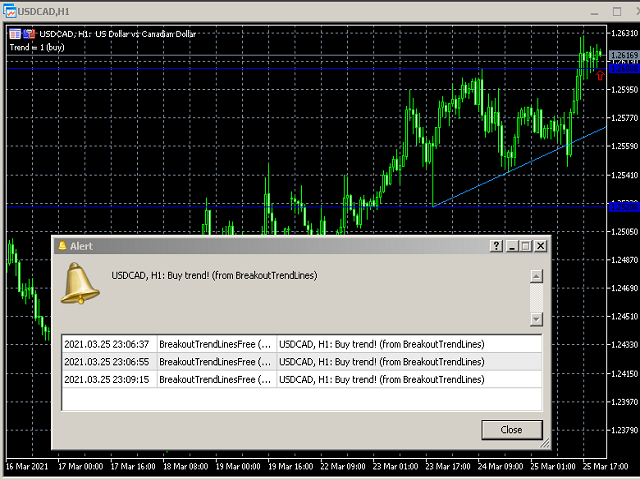
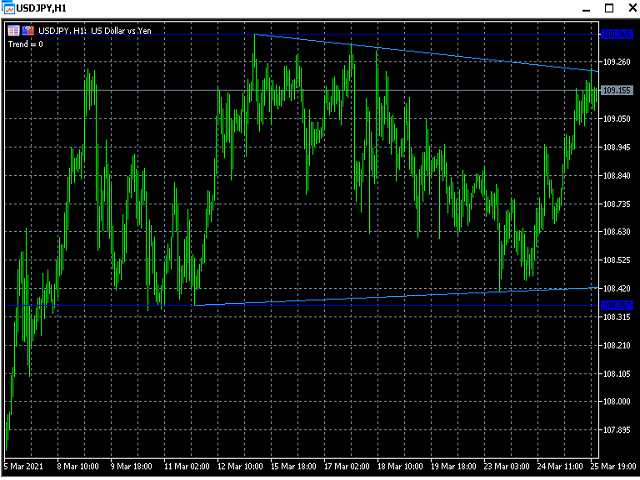
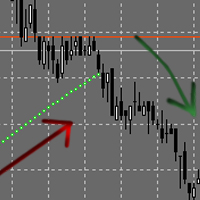
Free indicator to quickly detect trendline breakouts and high or low of a price range. It displays lines based on the highs and lows of prices, and also finds and displays inclined trend lines. As soon as the price goes beyond the line and the candlestick closes, the indicator signals this with an arrow (you can also enable an alert). This indicator is easy to use and also free. The number of candles for defining trend lines as well as the high and low of the trading range is configurable. It works only on the H1 timeframe, if you need other timeframes, use the full version of the indicator:
Also, there is a version for the MT4 platform: https://www.mql5.com/en/market/product/18335
Options
- TradingRange - the number of bars in the trading range where highs and lows will be determined;
- Distance - the minimum distance from one maximum (minimum) to another for plotting trend lines;
- Shift - shift to identify a breakout, relative to the trading range;
- EnableAlert - enable and disable alerts (true - enabled);
- TrendLinesColor - color of inclined trend lines;
- HorizontalLinesColor - the color of the horizontal lines (based on the highs and lows of the price).
Recommended products

Follow The Line MT5
FREE
Oliver Gideon Amofa Appiah
Follow The Line This indicator obeys the popular maxim that: "THE TREND IS YOUR FRIEND" It paints a GREEN line for BUY and also paints a RED line for SELL. (you can change the colors). It gives alarms and alerts of all kinds. IT DOES NOT REPAINT and can be used for all currency pairs and timeframes. Yes, as easy and simple as that. Even a newbie can use it to make great and reliable trades.
NB: For best results, get my other premium indicators for more powerful and reliable signals. Get them

Turn Hunter
FREE
Roman Pritulyak
Reversal Hunter is a new leading oscillator. It monitors small changes in volume and price volatility using second derivative, thus providing an accurate prediction of trend reversals. Though Reversal Hunter shows its best results with reliable volume data (tick or real), special option of "synthetic" volume (which uses OHLC data only) is implemented to optimize performance in case of poor or missing volume data. The oscillator is drawn as two-color line for easy detection of trend changes.

Renko Advanced lite
FREE
Marco Montemari
This Renko Advanced indicator can be considered as a trading system. It offers a different view to see the currency pair:full timeless indicator, can be used for manual trading or for automatized trading with some expert advisor. When the price reaches a threshold a new block is created. The indicator beside the Renko bars, shows also 3 moving averages. Push notification was introduced when a new bar is created or a cross between moving averages occurs. PS2: if nothing is displayed turn off the

ZigZag SupportAndResistance MT5
FREE
Nikolay Churbanov
The Zigzag Support And Resistance is an indicator for showing support and resistance zones based on the ZigZag extremums.
Indicator Settings PrecalculateBars - the number of bars for the preview; SmoothPercent - smoothing of the levels as a percentage; LiveBars - lifetime of a level in bars; D1Depth - depth of the ZigZag indicator on the D1 chart; H4Depth - depth of the ZigZag indicator on the H4 chart; H1Depth - depth of the ZigZag indicator on the H1 chart; M15Depth - depth of the ZigZag ind

Free Automatic Fibonacci MT5
FREE
Tonny Obare
Free automatic fibonacci is an indicator that automatically plots a fibonacci retracement based on the number of bars you select on the BarsToScan setting in the indicator. The fibonacci is automatically updated in real time as new highest and lowest values appears amongst the selected bars. You can select which level values to be displayed in the indicator settings. You can also select the color of the levels thus enabling the trader to be able to attach the indicator several times with differe

RSI signal
FREE
Aleksey Sergan
Technical indicator Relative Strength Index (RSI) is a price following oscillator, whose values vary between 0 and 100. Values below 30 indicate an oversold state, and values above 70 indicate an overbought state. The classic interpretation of it is the following: if the oscillator line goes out of the oversold zone, it is a signal for opening a long position. If it goes out of the overbought zone, it is a signal for opening a short position. The indicator displays entry points on the chart usin

Trend Monitor MT5 demo
FREE
Pavel Zamoshnikov
The indicator generates early signals basing on ADX reading data combined with elements of price patterns. Works on all symbols and timeframes. The indicator does not redraw its signals. You see the same things on history and in real time. For better visual perception signals are displayed as arrows (in order not to overload the chart). The indicator is a complete analogues of the Trend Monitor indicator for MetaTrader 4
Features The best results are obtained when the indicator works on two ti

Strong Trends With Magic Entries MT5 FREE
FREE
FXsolutions
With this system you can spot high-probability trades in direction of strong trends. You can profit from stop hunt moves initiated by the smart money!
Important Information How you can maximize the potential of the scanner, please read here: www.mql5.com/en/blogs/post/718109 Please read also the blog about the usage of the indicator: Professional Trading With Strong Momentum This FREE Version of the indicator works only on EURUSD and GBPUSD. The full version of the indicator can be found here:

HMA Color with Alerts MT5
FREE
Pavel Zamoshnikov
Hull Moving Average (HMA) is well-deservedly popular among traders because of the effective averaging of market noise and a relatively small delay. The current MetaTrader 5 version changes its color when the movement direction changes. Sound and text signals are available. It also supports sending email and push messages. It is possible to trigger a signal on the current incomplete bar, although such a signal may be canceled before completion if conditions are no longer appropriate. One of the p

Important Lines
FREE
Terence Gronowski
This indicator displays Pivot-Lines, preday high and low, preday close and the minimum and maximum of the previous hour. You just have to put this single indicator to the chart to have all these important lines, no need to setup many single indicators.
Why certain lines are important Preday high and low : These are watched by traders who trade in a daily chart. Very often, if price climbs over or falls under a preday low/high there is an acceleration in buying/selling. It is a breakout out of

HMA Trend Professional demo MT5
FREE
Pavel Zamoshnikov
Demo version of the HMA Trend Professional indicator. The main feature of the "HMA Trend Professional" indicator is the ability to predict the trend reversal with high probability. The trend reversal forecast is based on the statistical analysis of history data. The indicator plots statistical diagrams which can be used by traders to see the current phase of the market (impulse or correction, the beginning, middle or end of the movement) and evaluate the probability of a reversal. See the main p

Magic Channel Free
FREE
Evgeny Belyaev
Magic Channel Free is a channel indicator for the MetaTrader 5 trading platform. This indicator allows finding the most probable trend reversal points. Unlike most channel indicators, Magic Channel does not redraw. The alert system (alerts, email and push notifications) will help you to simultaneously monitor multiple trading instruments. Attach the indicator to a chart, and the alert will trigger once a signal emerges. With our alerting system, you will never miss a single position opening sign

Support Resistance Multi Time Frame MT5 FREE
FREE
FXsolutions
This indicator shows the latest untouched support and resistance as horizontal lines. The indicator can show support/resistance from higher timeframes. With this indicator you can e.g. easily see the support/resistance of the timeframes H4, D1 and W1 on a H1 chart, which can be a big advantage while time your entry on H1. This is the FREE version of the indicator: Support Resistance Multi Time Frame MT5 The free version works only on EURUSD and GBPUSD!
Parameters referenceTF: the timeframe fro

Magic Candles Free for MT5
FREE
Evgeny Belyaev
Magic Candles FREE is a new unique product that allows identifying the current market phase (uptrend, downtrend or flat). This indicator paints bars in different colors depending on the current state of the market and signals the user about trend changes with alerts. Magic Candles FREE - is a demo version, which works only on the AUDUSD currency pair. Unlimited version can be purchased here: https://www.mql5.com/en/market/product/29342
Advantages High accuracy of signals. Suitable for scal

Multi oscillator divergence FREE MT5
FREE
Jan Flodin
The indicator identifies when a divergence occurs between price and an oscillator. It identifies both regular and hidden divergences. This free version has some limitations compared with the paid version . For instance alerts are not supported. Please also check out my other divergence products : Divergence dashboard Double divergence scanner
Features Can detect divergences for the following oscillators/indicators: MACD, OsMA, Stochastics, RSI, CCI, RVI, Awesome, ADX , ATR, OBV, Composite in

ThreePointsChannelFree
FREE
Dimitr Trifonov
This is a free version of the indicator, the period between the vertical lines is always 30 bars. In the paid version the period can be set by user, so a configuration with many ThreePointsChannel indicators with different periods is possible.
The principle of construction - on top of any number of bars set by the user, a channel is constructed with maximum and minimum lines so that the bars touch the maximum and minimum of the channel at exactly three points. The name of the indicator follows

Forex Indicator Arrows
FREE
NGUYEN NGHIEM DUY
Forex Indicator Arrows is an arrow Indicator used as an assistant tool for your trading strategy. The indicator analyzes the standard deviation of bar close for a given period and generates a buy or sell signals if the deviation increases. It good to combo with Martingale EA to follow Trend and Sellect Buy Only/Sell Only for EA work Semi-Automatic. Best for combo with some EA Money Printer EA , Forex Miner EA , Gold Miner MT4 , The King EA
You can use this Indicator with any EAs in my Pro

TrendDetect
FREE
Pavel Gotkevitch
The Trend Detect indicator combines the features of both trend indicators and oscillators.
This indicator is a convenient tool for detecting short-term market cycles and identifying overbought and oversold levels. A long position can be opened when the indicator starts leaving the oversold area and breaks the zero level from below. A short position can be opened when the indicator starts leaving the overbought area and breaks the zero level from above. An opposite signal of the indicator can

Tops and Bottoms Indicator
FREE
Josue De Matos Silva
Tops & Bottoms Indicator FREE Tops abd Bottoms: An effective indicator for your trades
The tops and bottoms indicator helps you to find ascending and descending channel formations with indications of ascending and/or descending tops and bottoms. In addition, it show possibles opportunities with a small yellow circle when the indicator encounters an impulse formation.
This indicator provide to you more security and speed in making entry decisions. Also test our FREE advisor indicator:

Traditional MACD
FREE
Daniel Lewis
The MACD indicator in MetaTrader 4/5 looks different than the MACD indicator in most other charting software. That's because the MetaTrader 4/5 version of MACD displays the MACD line as a histogram when it is traditionally displayed as a line. Additionally, the MetaTrader 4/5 version computes the Signal line using an SMA whereas according to MACD definition it's supposed to be an EMA. The MetaTrader 4/5 version also does not compute a true MACD Histogram (the difference between the MACD/Signal l

BB Trend Flat MT5
FREE
Pavel Zamoshnikov
The indicator determines trend/flat status of the market using Bollinger Bands. Bollinger Bands diverge when the market moves sharply and converge when there is flat. The indicator uses this peculiarity. When the market is calm and distance between Bollinger Bands is less than some value, the indicator shows flat (gray histogram by default). When the market starts moving and divergence of Bollinger Bands exceeds this value, the indicator determines direction of the movement and shows an up trend

Peak Trough Analysis Tool MT5
FREE
Young Ho Seo
Peak Trough Analysis is the great tool to detect peaks and troughs in your chart. Peak Trough Analysis tool can use three different peaks and troughs detection algorithm. The three algorithm include the orignal Fractals Indicator by Bill Williams, the Modified Fractals indicator and ZigZag indicator. You can use this peak and trough analysis tool to detect the price pattern made up from Equilibrium Fractal-Wave process. For further usage, there are good guide line on how to use this peak trough

Curver Arrows
FREE
Francis Dube
This indicator is a straight port of a well known MetaTrader 4 indicator that is freely available on the Internet. It does not redraw at all. It implements a type of breakout strategy. The arrows indicate market direction. Use the indicator on M15 charts and higher. The indicator draws two bands near price action and generates signals when the price closes below the lower band and also above the upper band. The indicator uses periodic highs and lows to calculate upper and lower threshold bands.

TBScanner
FREE
NUANCHAN SANTHONG
Timeframe-correlation signal generating with Higher than 95% of accuracy
This scanner shows the trend values of the TrendBand indicator for up to 20 instruments and H4,H1,M15,M5 and M1 time frames. The scanner collects the trend signals of every timeframes (H4,H1,M15,M5,M1) from TrendBand indicator and also, generates daily signal under the considerations of like correlations of each timeframes,ATM rule and Fibonacci levels. Installation Note Before opening this indicator, the TrendBan

Free Timing
FREE
Francis Dube
This is the same indicator created by Mustapha BELKHAYATE now available for free. This indicator is best used to time the market and enter trades during periods of least risk. Apply this indicator along with the Center of Gravity indicator in order to identify price extremes. Then use free timing to trade potential turning points. This indicator is an oscillator similar in ilk to the Relative Strength Index. Indicator values range from 0 to 100, with values below 30 or 20 signaling overselling a

Tabajara V5
FREE
Flavio Jarabeck
Metatrader 5 version of the famous Andre Machado's Tabajara indicator. If you don't know Andre Machado's Technical Analysis work you don't need this indicator... For those who need it and for those several friend traders who asked this porting from other platforms, here it is...
FEATURES
8-period Moving Average 20-period Moving Average 50-period Moving Average 200-period Moving Average Colored candles according to the inflexion of the 20-period MA
SETTINGS You can change the Period of all M

Panic Meter limited
FREE
Dmitriy Gurenko
The indicator measures the frequency of incoming ticks to analyze the market activity. Bullish and bearish ticks are analyzed separately, informing about the currently predominant market sentiment. According to observations, an increase in the frequency of ticks (panic) indicates the beginning of strong price changes, and an increase in the frequency of ticks in a particular direction not only accompanies a price change in this direction, but also often anticipates it. The indicator is indispens

ROMAN5 HeikenAshi TS Indicator
FREE
Anton Nel
This indicator is based on the Heiken Ashi indicator. It helps the user identifying whether to buy or sell. It comes with an alert that will sound whenever a new signal appears. It also features an email facility. Your email address and SMTP Server settings should be specified in the settings window of the "Mailbox" tab in your MetaTrader 5. Blue arrow up = Buy. Red arrow down = Sell. Line = Trailing Stop. You can use one of my Trailing Stop products that automatically move the Stop Loss and inc

ZigZag and Fractals
FREE
Sergey Stachurlov
ZigZag_FT is a combination of two good indicators. The first one is ZigZag with adjustable wave height (found it in Code Base). The second on is Bill Williams' fractals. These indicators complement each other. ZigZag is used for detecting Elliott waves, and Fractals show the structure of each wave. The height of ZigZags can be (and it should be) adjusted depending on the timeframe the indicator is used with. Fitted values of "Minimum points in a ray" parameter for different timeframes are listed

Advanced Price Movement Predictor Basic Edition 5
FREE
Boris Armenteros
It predicts the most likely short-term price movement based on advanced mathematical calculations.
Features Estimation of immediate price movement; Calculation of the real market trend; Calculation of the most important support and resistance levels; Algorithms optimized for making complex mathematical calculations with a minimal drain of system resources; Self-adjusting for better performance, so it’s able to work properly at any symbol (no matter how exotic it is) and any timeframe; Compatib
Buyers of this product also purchase

Entry Points Pro for MT5
125 USD Yury Orlov
This is an indicator for MT5 providing accurate signals to enter a trade without repainting.
It can be applied to any financial assets: forex, cryptocurrencies, metals, stocks, indices . It will provide pretty accurate estimations and tell you when it's best to open a deal and close it. Watch the video (6:22) with an example of processing only one signal that paid off the indicator! Most traders improve their trading results during the first trading week with the help of the Entry Point

VR Sync Charts MT5
52 USD Vladimir Pastushak
VR Sync Charts is a program designed as an indicator for the MetaTrader trading terminal. The program solves the problem of synchronization of chart windows by drawing a trend line in one chart window. the program copies and synchronizes the line with another chart in the MetaTrader terminal. Syncing will occur regardless of which period is set in the other chart. In the picture below, you can see how the trader manages the trend line, and the program synchronizes the line in another chart. The

PipTick Bid Ask Volume MT5
67 USD Michal Jurnik
PipTick Bid-Ask Volume indicator is a tool that needs every scalper and intraday trader. It uses a special algorithm to determine the activity of buyers and sellers and displays it in the form of histogram. With this feature, the trader can easily compare the level of aggression on the part of buyers and sellers and read the context of the market. As we all know, the forex market is decentralized and therefore we do not have a reliable information about real volume. We also do not know actual an

ACPD Auto Candlestick Patterns Detected
50 USD Dmitriy Zabudskiy
ACPD – «Auto Candlestick Patterns Detected» - The indicator for automatic detection of candlestick patterns. The indicator is useful both for novice and professional traders. It can be used as an independent tool (good results can be achieved on stocks and currency pairs) and as an additional tool to a trading system. The Indicator of Candlestick Patterns ACPD is Capable of: Determining 40 reversal candlestick patterns by their main parameters; it displays over 40 signals based on these models.

TrendLine PRO MT5
99 USD Evgenii Aksenov
PROMO: Buy Trend Line PRO today and contact us to get for free: 1) User's Manual about the indicator and built in pop-up Scanner 2) Setting files for Bitcoin, GOLD, EURUSD, GBPUSD 3) HTF Histogram (basement indicator) which shows Higher TimeFrame trend in the bottom of chart Contact me after purchased to receive useful files: profitcamp@mail.ru The TrendLine PRO MT5 indicator is a version for MT5 of the popular INFINITY TrendLine PRO indicator (mt4). The calculation of indicato

PipFinite Trend PRO MT5
98 USD Karlo Wilson Vendiola
Breakthrough Solution For Trend Trading And Filtering With All Important Features Built Inside One Tool! Trend Pro's smart algorithm detects the trend, filters out market noise and gives entry signals with exit levels. The new features with enhanced rules for statistical calculation improved the overall performance of this indicator.
Important Information Revealed Maximize the potential of Trend Pro, please visit www.mql5.com/en/blogs/post/713938 Test the demo version and explore its feature

FX Power MT5
75 USD Daniel Stein
You want to become a constantly profitable 5-star forex trader? 1. Read the basic description of our simple trading system & and it's major strategy update in 2020 2. Send a screenshot of your purchase to get your personal invitation to our exclusive trading chat FX Power MT5 is the first currency strength meter with a complete history across all time frames.
It analyzes the momentum and strength of all major currencies to determine high probability trades. Key Features of FX Power M

TPA Sessions MT5
50 USD InvestSoft
"TPA Sessions" indicator is a very important tool to complement "TPA True Price Action" indicator . Did you ever wonder, why many times the price on your chart suddently turns on a position you can't explain? A position, where apparently no support or resistance level, or a pivot point, or a fibonacci level is to identify? Attention!!! The first run of the TPA Session indicator must be in the open market for the lines to be drawn correctly.
Please visit our blog to study actual

FX Volume MT5
75 USD Daniel Stein
You want to become a constantly profitable 5-star forex trader?
1. Read the basic description of our simple trading system & and it's major strategy update in 2020 2. Send a screenshot of your purchase to get your personal invitation to our exclusive trading chat Following the smart money is finally possible! FX Volume is the FIRST and ONLY volume indicator that provides a REAL insight into the market sentiment from a broker's point of view.
It provides awesome insights into how i

Support and Resistance with Trendlines
50 USD Ammar Yaseen
This indicator would help you I DENTIFY different HORIZONTAL SUPPORT / RESISTANCE LEVELS AND TRENDLINES.
ADVANTAGES: Use up till 5 different levels of Support and Resistance Use up till 5 different trend lines Use true/false options to display for Support/Resistance or Trend line Image
PARAMETERS: nPeriod: the time period to decide
Limits: the candles limit to look back
UseHorizontalLines: true/false option to display Horizontal Support and Resistance Lines UseTrendline: true/false opti

Aggression On Bars
60 USD Flavio Jarabeck
Imagine a Buy and Sell Pressure monitor on your chart that shows in REAL-TIME this data, bar by bar? Well, imagine no more. We present you an exclusive creation of Minions Labs : Aggression On Bars indicator. On every new bar on you chart this indicator will start counting in real-time the BUY/SELL pressure and present this data statistics directly inside your chart. As soon as a new bar is created in your chart, the counter restarts. Simple and effective. Just watch the video to see it running

Blahtech Market Profile MT5
124 USD Blahtech Limited
Market Profile defines a number of day types that can help the trader to determine market behaviour. A key feature is the Value Area, representing the range of price action where 70% of trading took place. Understanding the Value Area can give traders valuable insight into market direction and establish the higher odds trade. It is an excellent addition to any system you may be using. Blahtech Limited presents their Market Profile indicator for the MetaTrader community. Inspired by Jim Dalton’s

Lighthouse MT5
75 USD Daniel Stein
You want to become a constantly profitable 5-star forex trader? 1. Read the basic description of our simple trading system & and it's major strategy update in 2020 2. Send a screenshot of your purchase to get your personal invitation to our exclusive trading chat
Lighthouse is an amazing precise and reliable support and resistance indicator.
It displays the most important trading levels and draws them according to their relevance.
If a level is clearly broken, it changes its r

FX Trend MT5
75 USD Daniel Stein
You want to become a constantly profitable 5-star forex trader?
1. Read the basic description of our simple trading system & and it's major strategy update in 2020 2. Send a screenshot of your purchase to get your personal invitation to our exclusive trading chat
FX Trend displays the trend direction, duration, intensity and the resulting trend rating for all time frames in real time.
You'll see at a glance at which direction the trends are running, how long they last and how powe

Gann Square of 144 for MT5
52 USD Taras Slobodyanik
The Gann Box (or Gann Square) is a market analysis method based on the "Mathematical formula for market predictions" article by W.D. Gann. This indicator can plot three models of Squares: 90, 52(104), 144. There are six variants of grids and two variants of arcs. You can plot multiple squares on one chart simultaneously.
Parameters Square — selection of a square model: 90 — square of 90 (or square of nine); 52 (104) — square of 52 (or 104); 144 — universal square of 144; 144 (full) — "full" ve

Bitcoin Manager MT5
50 USD Denys Babiak
Description
Bitcoin Manager is the best indicator for trading Bitcoin cryptocurrency. It is calculated based on the price deviation from the moving average line channel. Ascending and descending arrows indicate potential points and levels for opening buy and sell positions.
How to use?
We strongly recommend using this indicator on the H1 timeframe. An up arrow indicates a buy level. Down Arrow - Sell Level.
Parameters
Maximum History Bars - maximum count of history bars to calculate

PZ Wolfe Waves MT5
149 USD Arturo Lopez Perez
Wolfe Waves are naturally occurring trading patterns present in all financial markets and represent a fight towards an equilibrium price. These patterns can develop over short and long-term time frames and are one of the most reliable predictive reversal patterns in existence, normally preceding strong and long price movements. [ Installation Guide | Update Guide | Troubleshooting | FAQ | All Products ] Clear trading signals Amazingly easy to trade Customizable colors and sizes Implements perfo

Shepherd Gann Squares MT5
100 USD Abdullah Alrai
This indicator is a market analysis method based on the "Mathematical formula for market predictions" article written by W.D. Gann depending on square of nine and square of 144 methods.
Indicator has a panel, which allows you to: Move between SQ144 and SQ9 methods. Choose perfect style to trade on (Levels, Channel, Star, GannFan, Circles, and Grid for SQ9). Choose Angle/Time/Space (Square Of 9 Basics). View higher timeframes analysis on the current chart by using the frame method. Show/hide sq

AguiaTraders F12 PRO
70 USD Renato Fiche Junior
This tool was developed to help traders on candle by candle and replay training. In the indicator settings, the user can set the training start datetime. The indicator will autommatically hide all candles after this datetime. So the user can make studies before starting the training. Starting the training, the user can simulate your trades quickly and easily!
Note: Demo version for testing can be found here: https://www.mql5.com/en/market/product/38314
This is a product developed by Renato F

PipFinite Exit EDGE MT5
88 USD Karlo Wilson Vendiola
Did You Have A Profitable Trade But Suddenly Reversed? In a solid strategy, exiting a trade is equally important as entering.
Exit EDGE helps maximize your current trade profit and avoid turning winning trades to losers.
Never Miss An Exit Signal Again
Monitor all pairs and timeframes in just 1 chart www.mql5.com/en/blogs/post/726558
How To Trade You can close your open trades as soon as you receive a signal
Close your Buy orders if you receive an Exit Buy Signal. Close your Sell orde

FiboPlus MT5
70 USD Sergey Malysh
The indicator automatically plots and tracks buy and sell Fibo levels at any symbol and timeframe. FiboPlus displays: Fibo levels of the probable upward or downward price movements. entry points are shown using "up arrow", "down arrow" icons. The data is doubled on SELL and BUY buttons. rectangle area limited by levels 0-100. Trading is performed from one level to another (no trend).
Features price movement forecast, market entry points, stop loss and take profit for orders. ready-made trading

Pivot Prof
69 USD Paul Anscombe
Advanced Support & Resistance Trading Made Easy... Get simple, effective trade opportunities with Pivot Prof and use the Support and Resistance levels professionals use. Pivot Prof brings premium levels to the trader where the market is most likely to react, which is the very thing a trader needs to enter or exit the market, there is little point in trading in no-mans land, that gives the trader no edge whatsoever and leads to larger SL, larger drawdown, smaller TP and more risk. Pivot Prof is

Royale Scalping Indicator
149 USD Mostafa Tarakameh
Royal Scalping Indicator is an advanced price adaptive indicator designed to generate high-quality trading signals. Built-in multi-timeframe and multi-currency capabilities make it even more powerful to have configurations based on different symbols and timeframes. This indicator is perfect for scalp trades as well as swing trades. Royal Scalping is not just an indicator, but a trading strategy itself.
Features
Price Adaptive Trend Detector Algorithm Multi-Timeframe and Multi-Currency Trend

PipFinite Breakout EDGE MT5
98 USD Karlo Wilson Vendiola
The Missing Edge You Need To Catch Breakouts Like A Pro. Follow a step-by-step system that detects the most powerful breakouts!
Discover market patterns that generate massive rewards based on a proven and tested strategy.
Unlock Your Serious Edge
Get it here www.mql5.com/en/blogs/post/723208
Have access to the game changing indicator that will take your trading to the next level!
How To Trade
Execute your trades in 3 Easy Steps!
Step 1: Trade Setup Enter a signal if Success Rate is

Dark Absolute Trend MT5
50 USD Marco Solito
Dark Absolute Trend is an Indicator for intraday trading. This Indicator is based on Trend Following strategy but use also candlestick patterns and Volatility. We can enter in good price with this Indicator, in order to follow the main trend on the current instrument. It is advised to use low spread ECN brokers. This Indicator does Not repaint and N ot lag . Recommended timeframes are M5, M15 and H1. Recommended working pairs: All. Follow us on Telegram: https://t.me/darktradingchan

A2SR MT5 Automated Actual Support and Resistance
150 USD Yohana Parmi
A. What is A2SR ? A2SR is a leading indicator , has special technique in determining the levels of Support (demand) and Resistance (supply) . Leading indicator is prepare all actual SR levels before price reach there . Unlike the ordinary way that we seen on the net, A2SR has a original concept for determining SR levels. The original technique was not taken from the internet , and it has never been published on the internet either. A2SR will auto select the SR level according to your trading sty

OBOS Indicator for MT5
149 USD Renaud Candel
OBOS Indicator is an exclusive indicator to spot entries based on price action. The OBOS Indicator is both effective and user friendly. Indicator uses simple color codes and levels to indicate Overbought and Oversold conditions. No more headache. The OBOS Indicator will only gives you indication when there are possible entries. Means you only get useful information. To use the indicator, please follow the rules: wait for the indicator to give you an overbought or oversold signal (usually blue an

Pin Bar Indicator for MT5
97 USD Renaud Candel
Pin Bar Indicator is a pattern recognition indicator for Forex and Binary Options. The Pin Bar Indicator is a pattern recognition indicator of the popular Pin Bar. The strategy that comes with the Pin Bar is purely based on price action.
Inputs
Distance: distance in pixels relative to top or bottom of candle to display the arrow symbol UseAlerts (true/false): enable alerts PopAlerts (true/false): enable alerts in the popup window EmailAlerts (true/false): enable email alerts PushAlers (true/f

BlueDigitsFx Easy 1 2 3 System MT5
50 USD Ziggy Janssen
MT4 Version Available Here: https://www.mql5.com/en/market/product/43555
Telegram Channel & Group : https://t.me/bluedigitsforex
V.I.P Group Access: Send Payment Proof to our Inbox *All In One System Indicator, Breakthrough solution for any Newbie or Expert Trader! The BlueDigitsFx Easy 123 System makes it easy to identify important areas of market structure. It alerts you to changes in market structure which typically occur when a reversal or major pullback are about to happen. The in

Elder Force Index With ATR Channels
50 USD Financial Trading Seminars Inc.
Adding Average True Range (ATR) channels to Force Index had been suggested by Kerry Lovvorn. Adding these channels turns Force Index into an excellent tool for identifying intermediate tops and bottoms. Force Index with ATR channels does not catch all turns, but the ones it identifies deserve very serious attention. Note: the word “true” in Average True Range refers to dealing with price gaps. Since there are no gaps in Force Index, here ATR is the same as the Average Range. Whenever the Force I
More from author

Volume Levels
10 USD Alexander Nikolaev
Volume Levels is a very important indicator for exchange trading. Most of the trades were performed on those levels. This indicator displays the price level that had the most trade volumes over a certain period of time. Often, the price bounces from those levels in the future, and it can be successfully used in trading. It works on any currency pair.
Parameters HistoryBars - the number of bars to determine the near volume levels; Range - the maximum distance above and below the current price t

Hit Market Maker
35 USD Alexander Nikolaev
Market makers can often deceive traders by reversing the market when it is most unprofitable for others. For example, many traders start buying only to see that the price goes down dramatically afterwards. Some still hold their buy positions thinking that this is only a correction but the price continues its downward movement. The EA is capable of detecting such periods. It analyzes the last two candles and determines whether there are actions that look similar to the market-maker's ones - the p

Easy Channels EA MT5
30 USD Alexander Nikolaev
This EA works on the basis of channels formed by price. It trades from the boundaries of these channels (for example, when the price breaks through the border of the channel, or when it touches and comes back). It can also display the lines and channels through which it trades. They are built on the highs and lows of prices. The EA has customizable parameters for trading on multiple channels and uses some indicators to improve trading (for example, Stochastic or ADX). It also has parameters for

Breakout Trend Lines EA
30 USD Alexander Nikolaev
This EA trades when the trend line, or high (low) price is broken. Trend lines and extremes are found by the specified parameters. In addition to trading, it also displays these lines on the chart. A trade occurs when the price goes outside the line and the candlestick closes. Also, the advisor may not trade if the market has low volatility, or other filters do not allow it to do so in order to cut off non-profit trades. It can set a stop loss in a parabolic pattern, or use a simple trailing st

ADX Channel Indicator
FREE
Alexander Nikolaev
This indicator forms a channel based on the readings of the ADX (Average Directional Movement Index) indicator, displays and informs the trader of a price reversal at the boundaries of this channel, and can also report when the price touches the channel boundaries. It also draws additional dotted lines, which depend on the readings of the + DI and -DI of the ADX indicator. It also has an option for filtering signals depending on the readings of the stochastic. The channel drawn by this indicato

Doji Finder Indicator MT5
FREE
Alexander Nikolaev
The indicator analyzes the chart and identifies Doji candlesticks. Shows their appearance and signals the appearance of such a candle (if allowed in the parameters). Also, this indicator shows the strength of the reversal in the form of bars of different colors (the more green, the more likely the rise, the more red - the fall in price). The direction of the signal depends on the direction of the previous candles, as the Doji signals a reversal or correction. In the indicator settings, you can

Easy Parabolic Sar
FREE
Alexander Nikolaev
The Expert Advisor places orders based on the points of the Parabolic Sar indicator. If your trading strategy utilizes this indicator, the EA will save you from the necessity to move your pending orders after every candlestick (e.g. 5 minutes or 1 hour) and will do it automatically. You can set the EA to open only BuyStop or only SellStop or both. Buy default both Buy and Sell are enabled. The EA does not use any indicators other than Parapolic Sar. Therefore you are to decide the time to run th

ADX Channel
FREE
Alexander Nikolaev
ADX Channel is an indicator that plots the channel depending on the values of the ADX (Average Directional Movement Index) indicator. The resulting channel is a little similar to the Envelopes, but its lines depend on the market volatility. The sell trade is usually executed fast when the price touches and bounces from the upper line of the channel, buy - from the lower. It is recommended to trade when there is no significant news. The recommended timeframes: M5 - H1. The indicator is not design

Break Lines
FREE
Alexander Nikolaev
The indicator draws lines the the price highs and lows. Break through the high or low usually indicates trend change (or continuation). Once the price moves through a line, and the candlestick closes, the indicator draws an appropriate arrow (also, you can enable alerts). A deal should be conducted in the breakthrough direction immediately or after a slight rollback. It is best to trade following the trend on a larger timeframe. This indicator is easy to use, but nevertheless, there are many tra

Easy Candles
FREE
Alexander Nikolaev
This is a simple and free Expert Advisor that trades candlesticks. It compares several nearest bars and their volumes, and opens a trade based on that data. Unlike the professional version , it analyzes only 1 timeframe. The recommended timeframes for this EA are H1, H4, D1, it works with any currency pairs. The parameters always need to be optimized before trading, as well as after some period of trading.
Input Parameters Lots - lot size (if Lots=0, then the lot will be calculated based on th

Colored Candles Demo
FREE
Alexander Nikolaev
The demo version of the Colored Candles indicator - calculates the parameters of each candle, as well as its volume. After that, it paints the candles depending on their strength and direction. Bullish candles are colored green and bearish candles - red. The greater the power of the bulls or the bears, the brighter the color. You can change the colors if you want. The indicator helps to analyze the price movement, as well as market entry points. The more accurate signals are formed on the higher

Volume Levels USDJPY
FREE
Alexander Nikolaev
Volume Levels is a very important indicator for exchange trading. Most of the trades were performed on those levels. This indicator displays the price level that had the most trade volumes over a certain period of time. Often, the price bounces from those levels in the future, and it can be successfully used in trading. This is a demo version that works only on the USD/JPY currency pair. To work on all currency pairs, install the full version: https://www.mql5.com/en/market/product/15888
Param

Parabolic and divergence
10 USD Alexander Nikolaev
The Expert Advisor places pending orders by the points of the Parabolic Sar. The placement of orders depends on whether there is a divergence or a convergence on the Awesome Oscillator and RSI indicators, and also on the values of other indicators: MA, Stochastic, ATR. It can be configured to open only the BuyStop or only the SellStop orders, if necessary. By default, both buy and sell pending orders are placed. It is possible to set the time, when order placement is allowed. The Stop Loss and T

Candlelight
17 USD Alexander Nikolaev
The Expert Advisor opens deals analyzing the last candle on several timeframes, as well as its volume and readings of many other indicators to ensure an accurate market entry. All indicators are customizable.
Inputs Lots - lot size; Slippage - maximum allowable price deviation in points; Magic - unique identifier, use different magic numbers if multiple Expert Advisors run in your terminal; Max take profit - order closing price at a certain profit target; Mininum take profit - minimum profitab

Easy Martingale
15 USD Alexander Nikolaev
The EA uses the martingale principle - it increases the lot after an unsuccessful trade. But unlike other experts based on this principle, the Easy Martingale increases the lot 4 times at most, so that the drawdown does not become critical for your deposit. With that, after 1 unsuccessful trade the entry conditions are tightened, just as after the 2nd failure. Also, each trade has a fixed stop loss, and it is recommended to set it close. Sometimes, it is better to lose a little 3 times, but then

Week pullback
15 USD Alexander Nikolaev
The Expert Advisor opens trades only after the weekly candlestick closes. It determines how much the price moved in a week and opens a trade on Monday if the market opens in the opposite direction. It uses the "Va-bank" (All-in) strategy, which supposes that there will be a rollback on Monday after a strong weekly movement. At the weekends you can set the EA on the currency pair that moved the most points during the week, and optimize the EA specifically for this currency pair. The EA opens a tr

Five timeframes Ichimoku
25 USD Alexander Nikolaev
The EA uses the signals of the Ichimoku indicator from multiple timeframes simultaneously. For a trade entry, from 1 to 5 different timeframes can be adjusted. It is not always necessary for all the indicators to show buy (or sell) to enter the trade. The number of the required signal for the entry can be configured. Also, to improve trading, other indicators are used, as well as the search for divergences. It is recommended to use the EA on the currency pairs with high volatility (for example E

Micro Powers
30 USD Alexander Nikolaev
The EA is designed for trading on short-term timeframes during slack price fluctuations. At the same time, it can determine when the price fluctuations are suitable for trading. It detects the divergences using a variety of indicators, it can determine the direction of the price movements on the minute timeframes. Use accounts with low spread when trading on the М1 timeframe. Designed for EUR/USD, but can be optimized for other currency pairs. It can accept indicator signals from multiple timefr

Breakout Line
10 USD Alexander Nikolaev
The Expert Advisor enters the market at the breakout of a trading range high or low. In technical analysis, high or low breakout usually means the beginning of a new trend (or continuation of a previous one) and the good moment to enter the market in appropriate direction. The EA buys if the high of a trading range was broken and a candle closed above it. Selling is performed in the opposite case. The number of candles in a trading range can be configured. It also depends on the market volatilit

Breakout and pullback
18 USD Alexander Nikolaev
After breaking through the high or low of the trading range, the price often comes back about half the distance. This EA determines a good place to enter the market by trend, it opens a trade after a small rollback towards the trend. The number of candles in a trading range can be adjusted, like many other parameters. The trading range for determining the high and low depends on the current volatility of the market. The EA takes that into account, it can also automatically determine the appropri

Volume Candles
30 USD Alexander Nikolaev
Volumes are one of the most important factors of trading, as it is the high volumes that move the market in either direction. But there are very few standard indicators for volumes in MetaTrader 4. The Volume Candles analyses the volumes of the trades and displays candles depending on these volumes. The candle appears once the required number of volumes has passed during trading (the VolumeCandle parameter). If the candles close frequently and are thin, then the volumes on the market are current

Micro Powers Pro
35 USD Alexander Nikolaev
Automatic Trading System designed for trading on smaller timeframes (М1-М15). It makes a large number of trades, determines when the price fluctuations are perfect for trading, detects divergences using different indicators. Designed for EUR/USD, but can be optimized for other currency pairs. Unlike the simple version of MicroPowers, this EA also implements the Martingale principle (increases the lot if the previous trade was in loss), which can be adjusted so that it is not critical for the dep

Honeybee
17 USD Alexander Nikolaev
The Expert Advisor analyzes volumes before entering a trade. Major market players buy and sell large volumes and thus influence further price movement. Honeybee hunts for volumes just like for honey. When the market rises or falls, and suddenly there are volumes in the opposite direction, the EA opens a trade. You can configure the EA to open trades following the trend of a higher timeframe. If necessary, Stop Loss is moved to breakeven after the price moves a certain number of points. The EA ca

Volume Levels Trading
10 USD Alexander Nikolaev
The EA trades based on the levels that have the greatest volume of performed trades. These levels are often the support and resistance for the price. The EA does not simply buy based on the level, but determines how the price bounces off it and with what volume. The sufficient number of parameters allow to configure this EA for virtually any currency pair. The timeframes can also be different, fromM1 (if the account spread is small enough) to H4, but the optimal settings will be very different f

Trend Stream
14 USD Alexander Nikolaev
The levels, where a large volume of trades has been formed, are very important in the technical analysis. It is also important to know the direction of the trend and its change. When a High is broken the trend is considered an uptrend, when a Low is broken - a downtrend. This provides a foundation for a good trading system. But now you don't have to do anything, such system has already been developed - the Trend Stream. The EA automatically detects the trend direction and makes trades based on t

Signals 3 MACD
10 USD Alexander Nikolaev
The trading system is based on crossing 3 signal lines (with different parameters) of the MACD indicator. When all the lines are increasing, a buy order is opened (the opposite - sell order). The CCI indicator is required to avoid buying at the highest price but to but when the price decreases a bit, but there is still an uptrend. Also, the Stochastic and ATR serve as additional filters. The EA s easy to set up, but at the same time it shows good results on the short-term 5-minute timeframe. It

EMA 8 and 18 Trading System
10 USD Alexander Nikolaev
This EA implements the EMA 8/18 strategy, which is used by many traders. Brief description of the strategy: The Buy is determined when the EMA 8 indicator crosses the EMA 18 from below, with the price moving more than 50 points from the crossing. The buy position is opened when the price touches the EMA for the first time, after that, as the price rises, the trade is maintained by a trailing stop with a step of 30-35 points. The opposite is for opening a sell position. The parameters of the fast

ProCandles
12.50 USD Alexander Nikolaev
Some experienced trades can tell where the price will go even without indicators, as the direction of the price can be found using the ordinary candlesticks. The EA compares several nearest bars and their volumes, and opens a trade based on that data. Also, it is able to analyze the candles on two timeframes at the same time to make the entry more accurate and less risky. In addition, the EA can automatically determine the take profit and stop loss size depending on the size of the previous cand

Colored candles
10 USD Alexander Nikolaev
Some candles have a strong tendency to continue the movement or to revert it. With the help of the Colored candles indicator such movements are clearly visible. This indicator calculates the parameters of each candle, as well as its volume, and after that it paints the candles depending on its strength and direction. Bullish candles are colored green and bearish candles - red. The greater the power of the bulls or the bears, the brighter the color. You can change the colors if you want. The indi

Multi Alligator Signals
10 USD Alexander Nikolaev
It is good to know the presence of a trend on multiple timeframes at once. And even better - on multiple currency pairs at once. This indicator allows to quickly determine the presence of a trend or a flat on 8 timeframes and from 1 to 15 currency pairs at once. Multi Alligator Signals analyzes the signals of the Alligator indicator by Bill Williams on every timeframe (from M1 to W1) and multiple currency pairs (up to 15) simultaneously. If there is a buy signal, a green upward arrow is drawn, i
Filter:
No reviews