Big Bands
- Indicators
- Version: 1.10
- Activations: 20

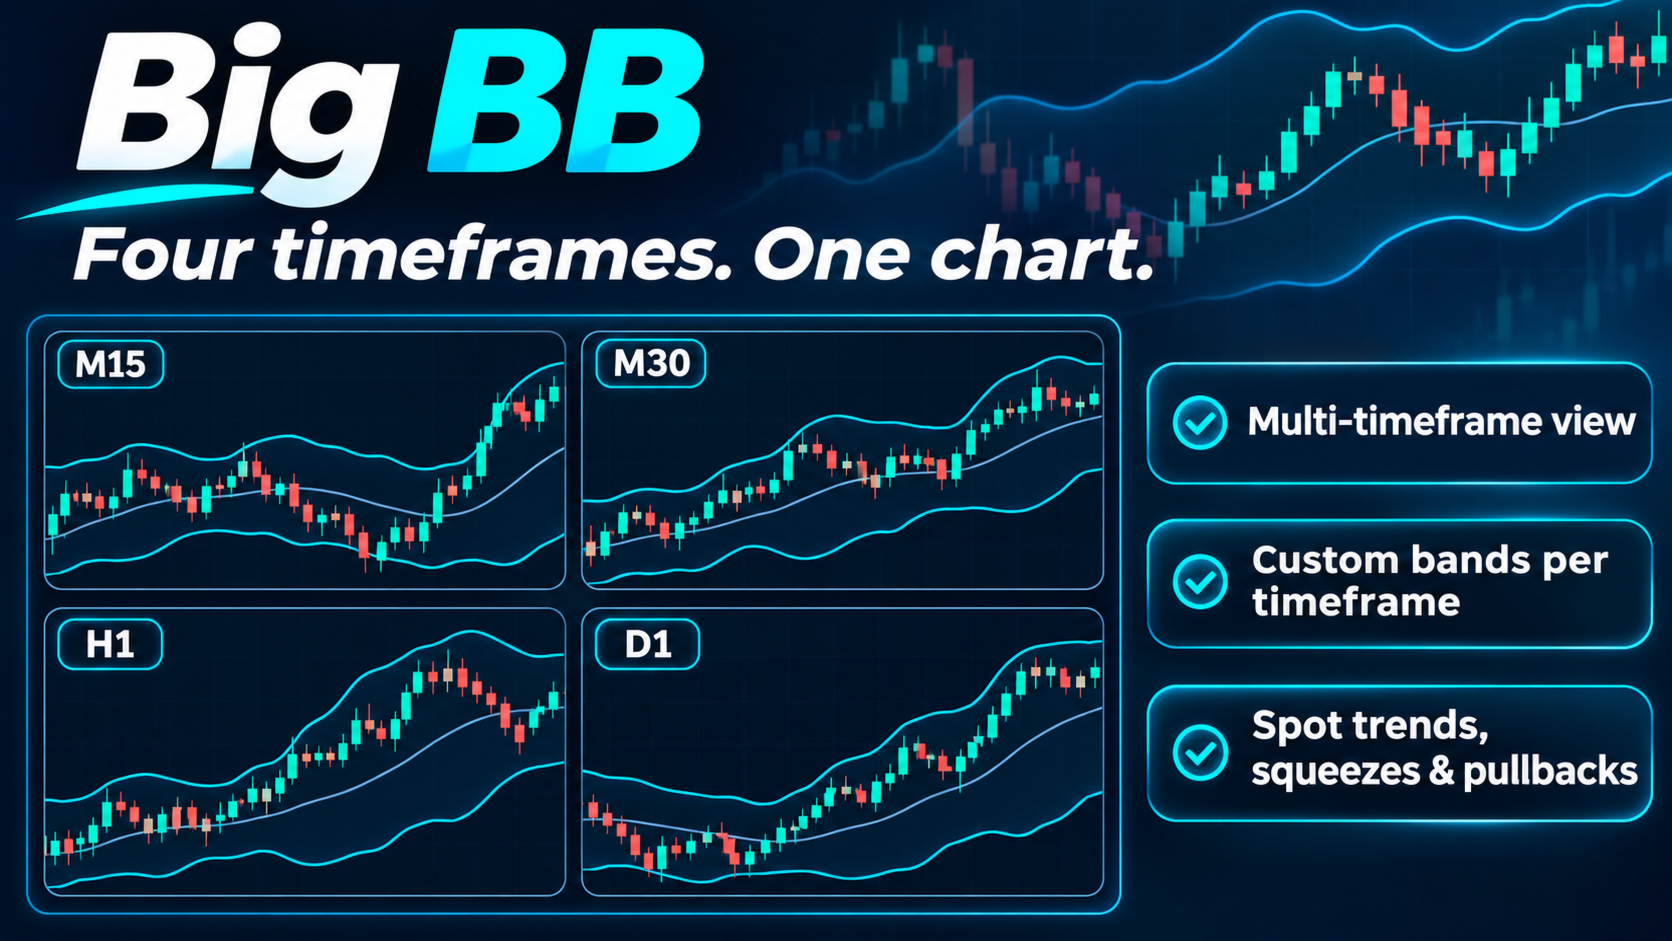
Big BB — Bollinger Bands mini-panels for four timeframes on one chart
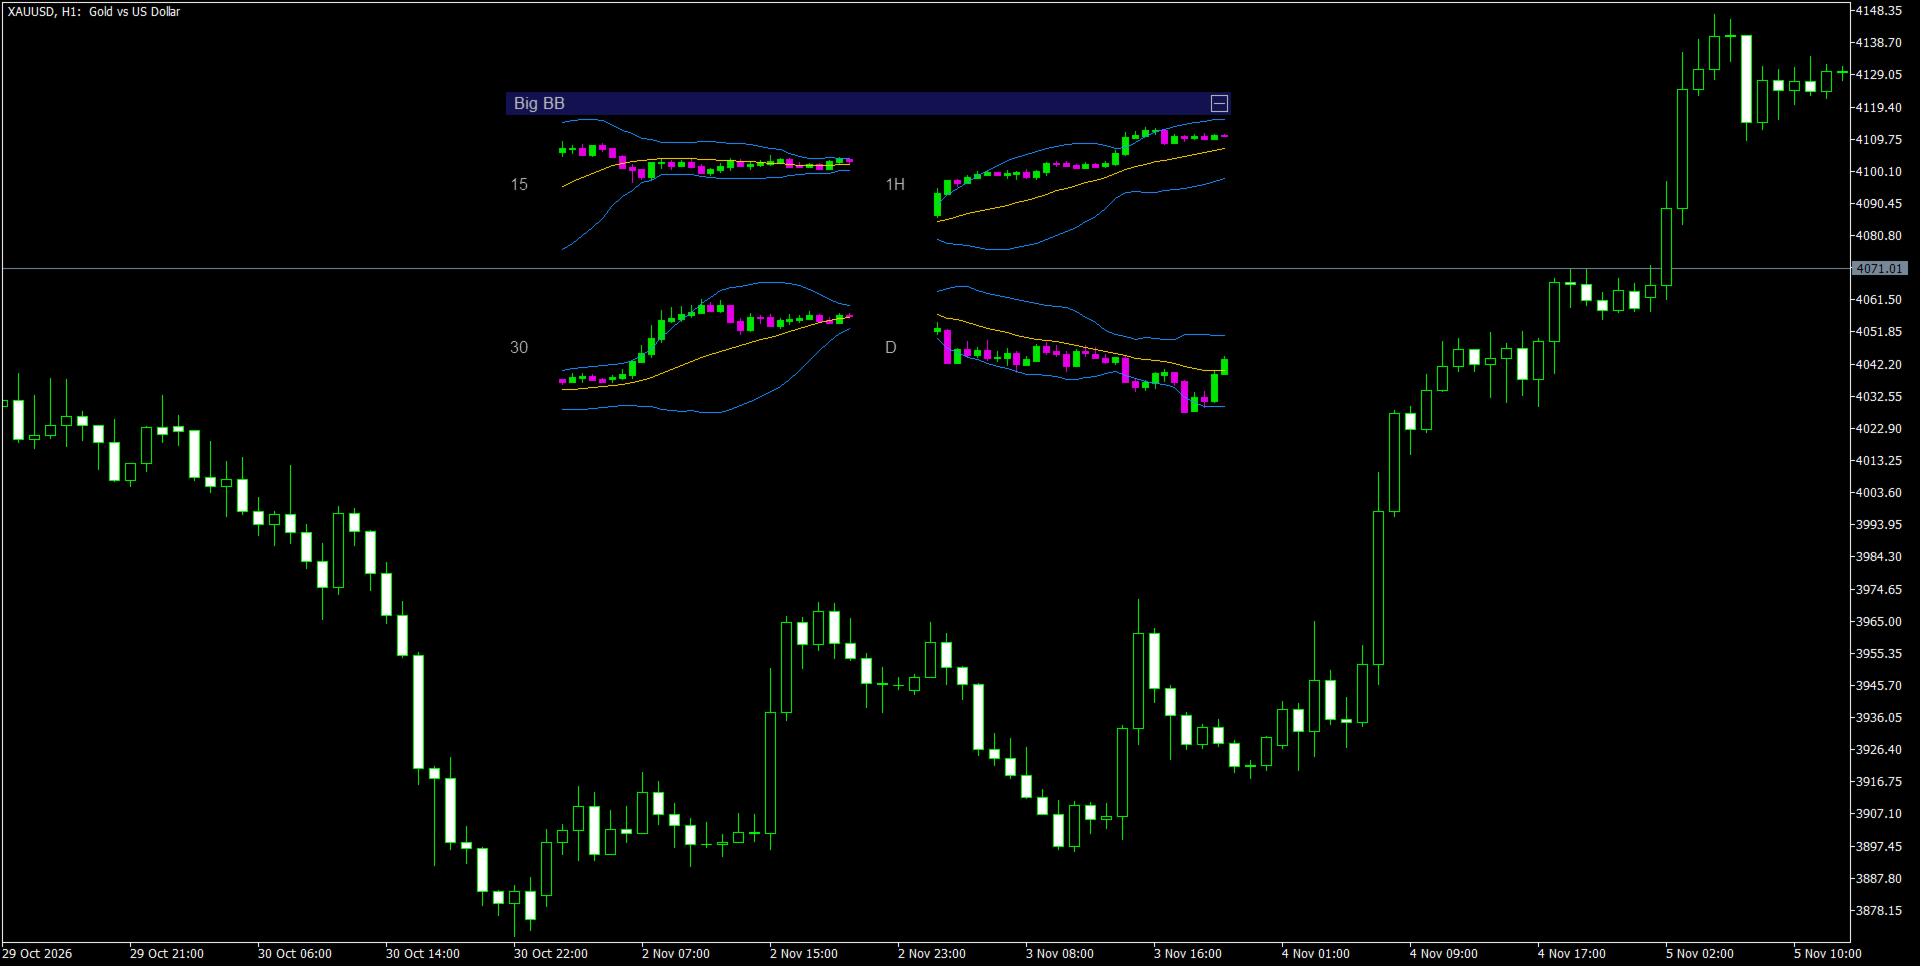
Big BB places compact panels directly on the price chart. Each panel shows the recent candles of a chosen timeframe together with the Bollinger Bands of that timeframe. There is no need to switch between M15, M30, H1 and D1: all of them are visible at the same time. Each timeframe has its own Bollinger Bands period and deviation.
MetaTrader 4 version: https://www.mql5.com/en/market/product/206941
What you see on the chart
- A header bar with the indicator name and a collapse button [-] / [+].
- Up to four panels. With one to three panels enabled they are stacked vertically. With all four enabled they form a 2 by 2 grid.
- Each panel has a timeframe label on the left (15, 30, 1H, D, W, M), the candles of the latest bars and three lines: upper, middle and lower.
- The panels always show the symbol of the chart the indicator is attached to and update automatically.
What the panel data means
- Timeframe label tells you which period the panel belongs to.
- Candles show the latest price action on that timeframe. The color shows the direction of the candle (bullish or bearish). The rightmost candle is the current one.
- Middle line marks the balance level of price on that timeframe. Price above it suggests buyers are in control, price below it suggests sellers are.
- Upper and lower lines frame the usual trading range. Price near or beyond the upper line points to an overbought condition, near or beyond the lower line to an oversold one.
- Distance between the upper and lower lines reflects volatility. Narrowing bands (a squeeze) often come before a strong move, and widening bands show rising volatility.
- The vertical scale of each panel adapts to its own bars, so every panel makes it easy to judge where price sits inside its range.
How a trader can use the indicator
- Higher timeframe confirmation. Check an entry on a lower timeframe against the position of price relative to the middle line and the bands on higher timeframes.
- Direction filter. If price is above the middle line on all panels, the background is bullish. If it is below, the background is bearish. When the timeframes disagree, extra caution is justified.
- Pullbacks and mean reversion. A touch of the lower or upper band on a lower timeframe while the higher timeframes are calm may point to a pullback.
- Breakouts. A squeeze on one or several timeframes followed by price leaving the band helps you spot the start of an impulse.
- Volatility monitoring. The width of the bands across timeframes shows where the market is quiet and where it is active.
- Settings tuned per timeframe. Each panel has its own parameters, for example more sensitive ones for M15 and classic ones for D1.
- The indicator works on any symbol and any chart timeframe. The panels do not depend on the chart timeframe.
Controls
- Drag the header with the mouse to move the panels anywhere on the chart.
- The [-] / [+] button collapses and expands the panels.
- Position and state are remembered separately for each chart.
- Panel size adapts automatically when the chart window is resized.
Settings
Position & size
- Panel size (% of chart width, 0 = auto) — size of the panel block as a percentage of the chart width (5 to 100). 0 turns on automatic sizing based on the chart and screen.
- Initial offset from the right edge — initial distance of the block from the right edge of the chart in pixels. It applies on first placement; afterwards you can drag the block with the mouse.
- Initial offset from the top — initial distance of the block from the top edge of the chart in pixels.
- Bars per panel — how many candles each panel shows (minimum 5). A larger value shows a longer stretch of history, but the candles become smaller.
Appearance
- Show panel titles — show timeframe labels in the panels.
- Show candles in panels — show candles. When off, only the band lines remain.
- Candle transparency (%) — candle transparency: 0 is fully opaque, 100 is invisible.
- Bull candle — color of bullish candles.
- Bear candle — color of bearish candles.
- Upper band color — color of the upper line.
- Middle band color — color of the middle line.
- Lower band color — color of the lower line.
- Text color — color of the header and timeframe labels.
Timeframe 1 — Timeframe 4 (the same set of settings for each of the four panels)
- Show timeframe 1 / 2 / 3 / 4 — enable or disable the panel.
- Timeframe — timeframe of the panel. Defaults: M15, M30, H1 and D1.
- BB period — Bollinger Bands period for this panel (default 20).
- BB deviation — band deviation for this panel (default 2.0). The larger the value, the wider the bands.
Author’s channel
Subscribe to my channel on MQL5.com to stay up to date with updates of indicators and Expert Advisors, new products and trading materials: