Execution Caliper Broker Cost Meter
- Utilities
-
Yuki Nakayama
 MT5 tools that survived the testing — not the marketing.
I'm an independent developer based in Japan, building indicators and Expert Advisors for MetaTrader 5. I approach the market as a systematic researcher, not a marketer. - Version: 1.3
- Updated: 23 September 2026
What this is
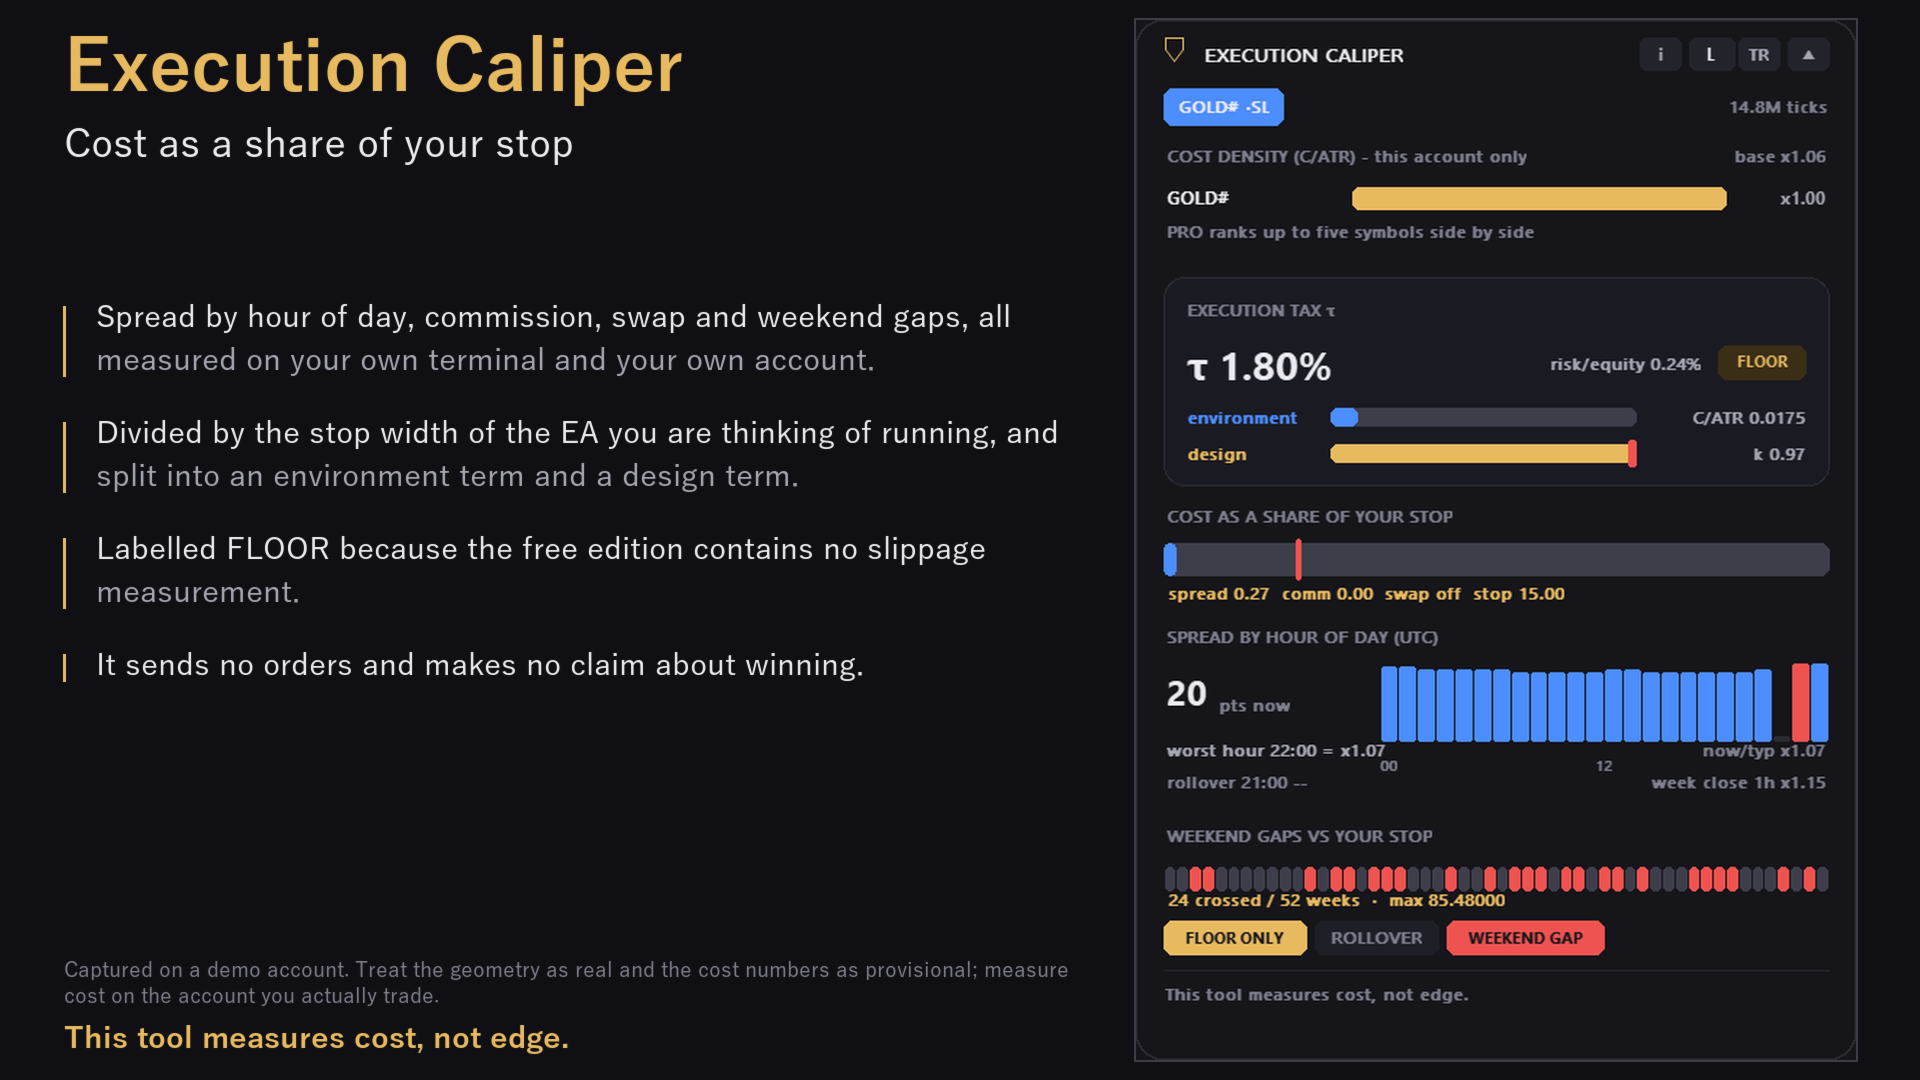
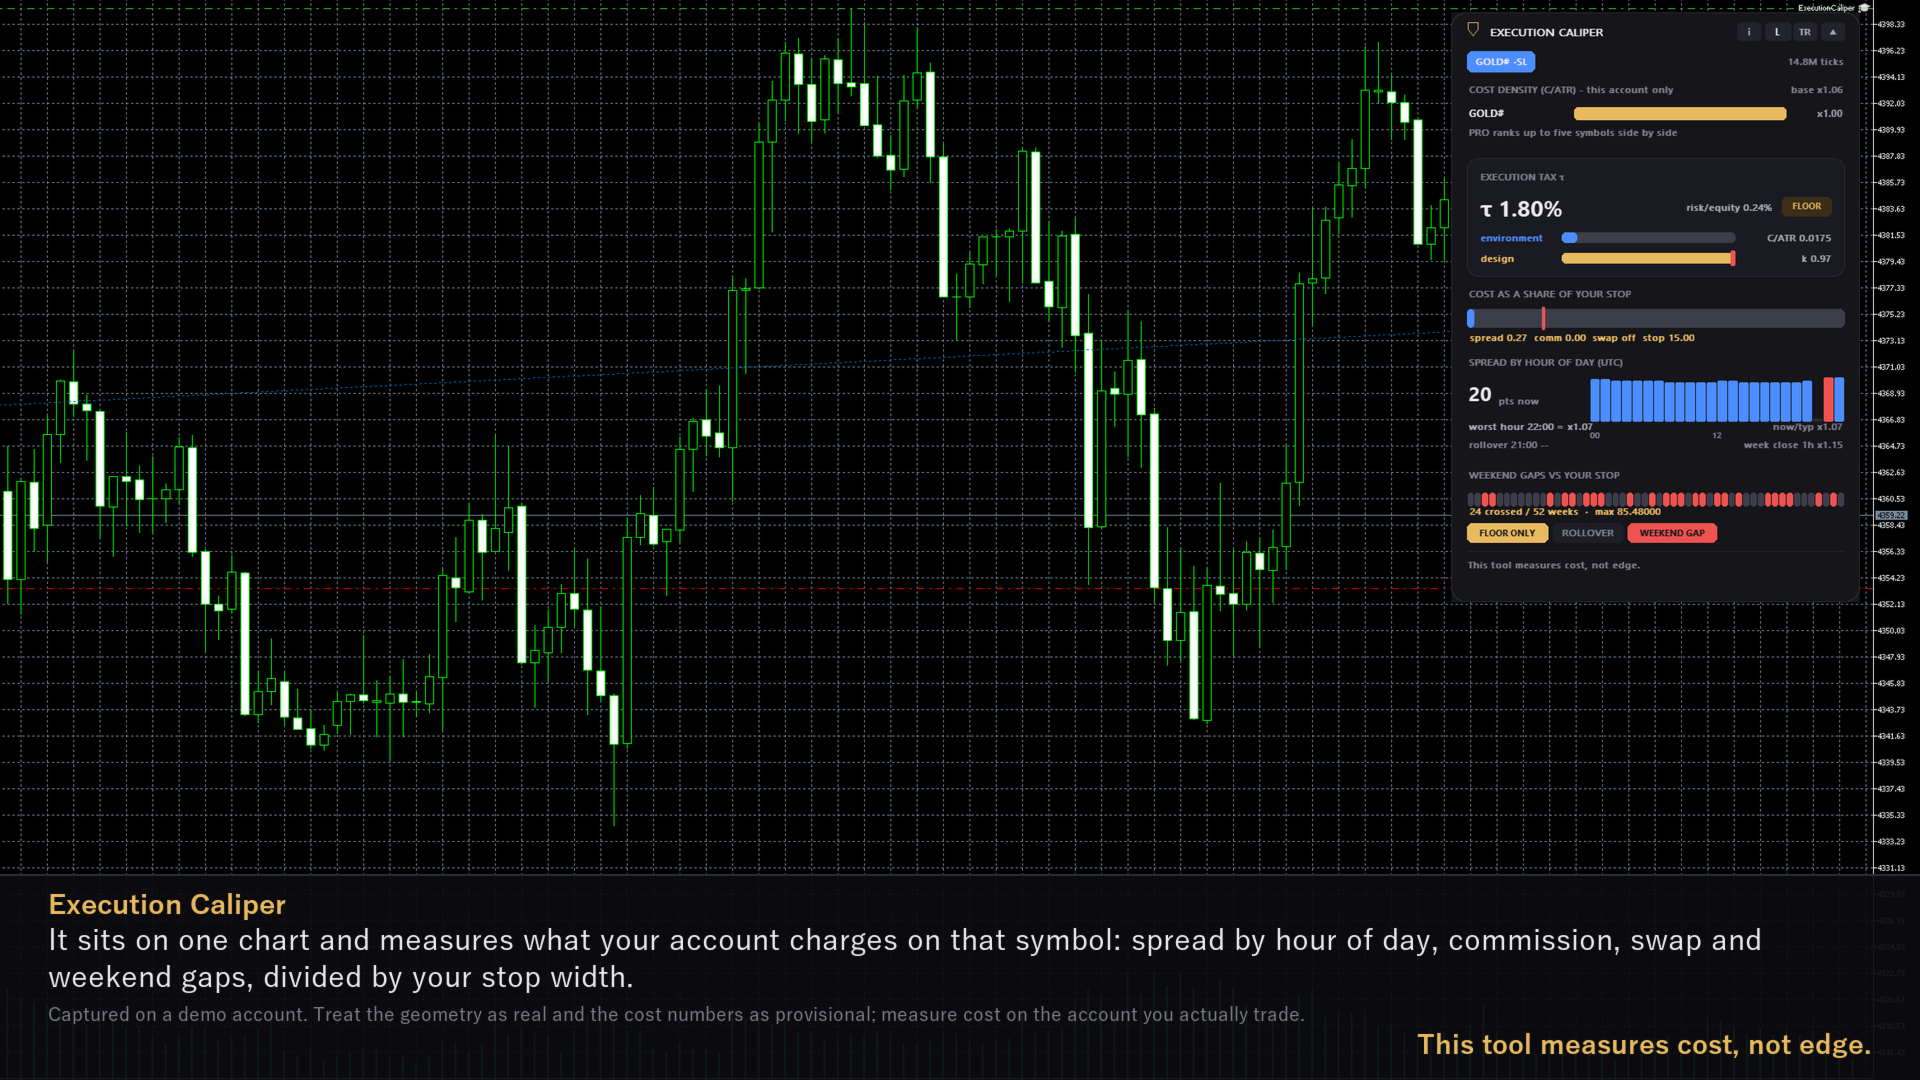
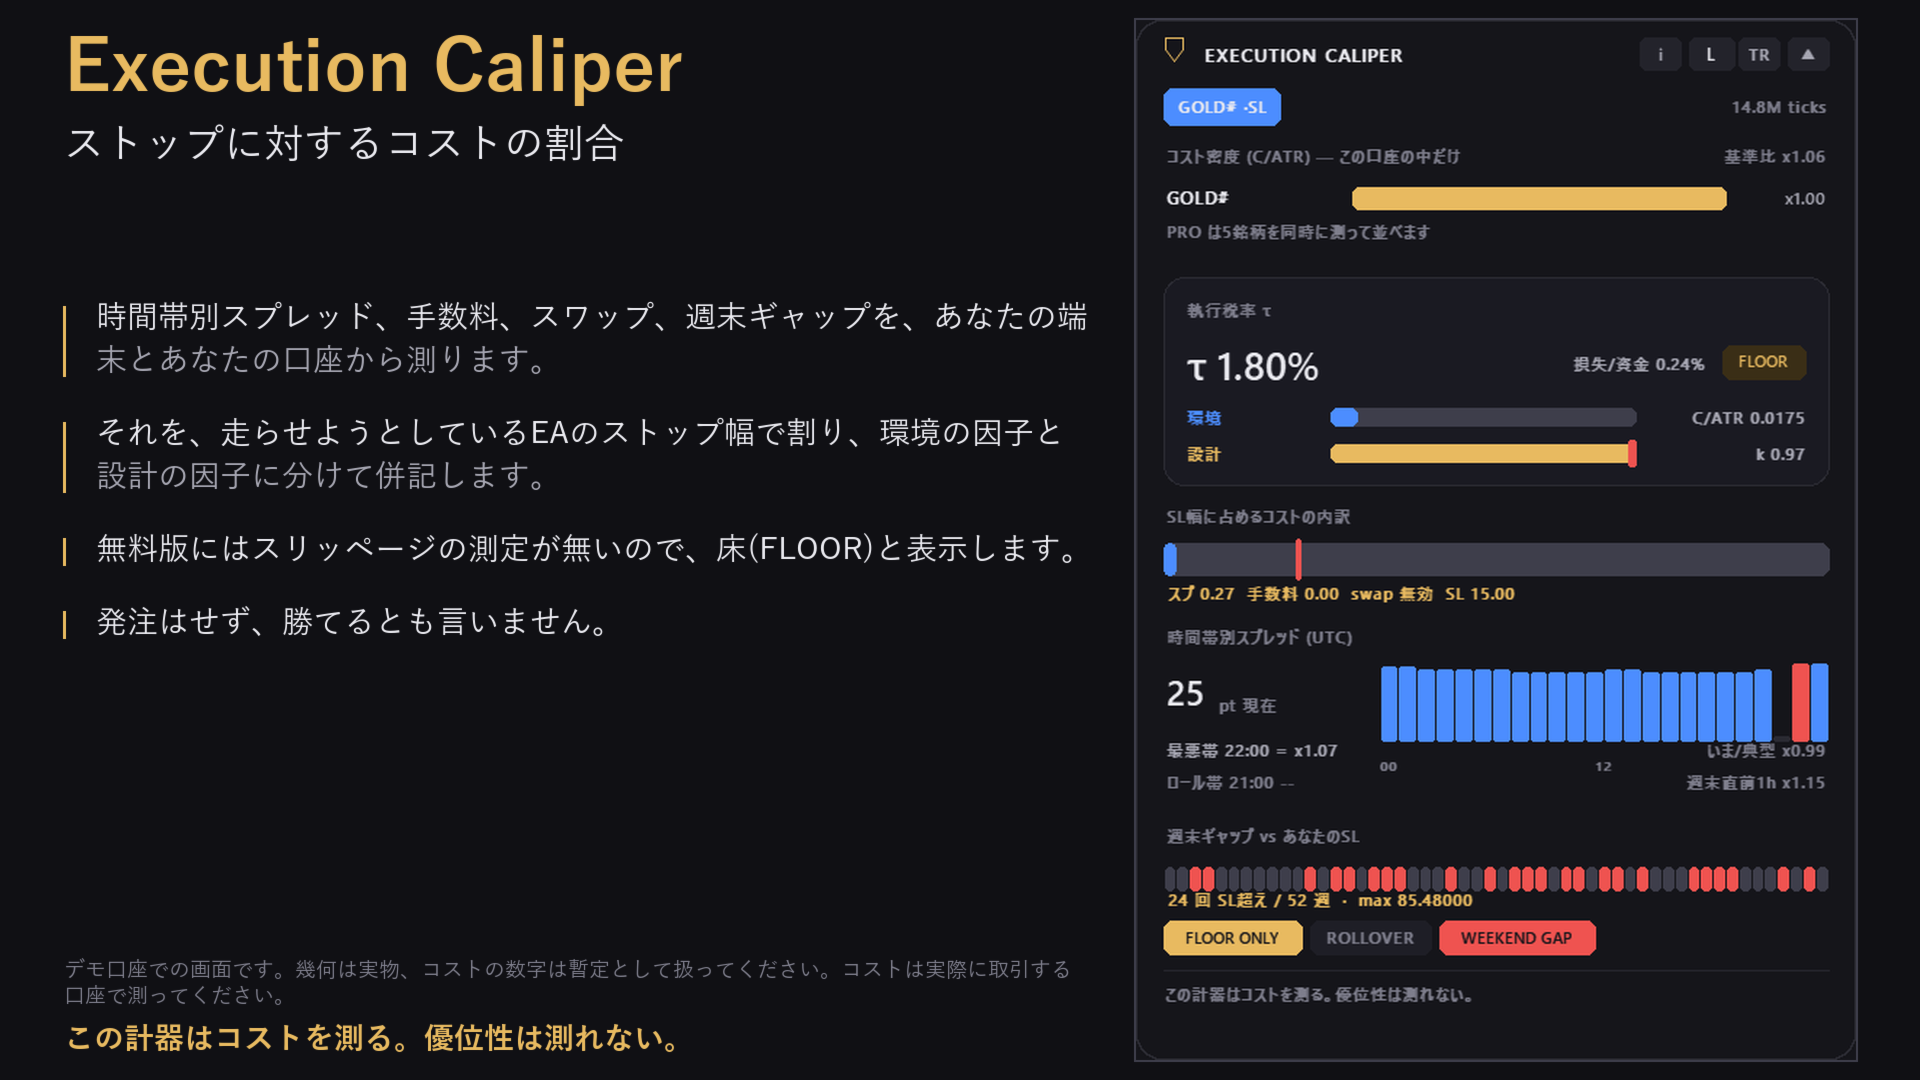
Execution Caliper is a measuring instrument, not a trading robot. It sits on one chart and measures how much execution cost your account charges on that symbol, then divides that cost by the stop width of the EA you are thinking of running. The result is one ratio: cost as a share of your stop. It sends no orders, opens no positions, and touches nothing that belongs to other EAs on the terminal. It also makes no claim about winning. We do not say it makes you profitable, safer, or better. It tells you what your account costs, before you find out the expensive way.
Why it exists
The figures in this paragraph are not ours. They come from public MQL5 signals for other people's EAs, which we re-measured ourselves from their exported trade lists; the signal identifiers, the recomputation and the corrections to our own earlier tables are set out on the author's blog on this site. Two of those signals run the same EA on two different brokers. Matched trade for trade, 760 pairs, the two brokers filled its entries a median of four cents an ounce apart; where both accounts also closed within minutes of each other, the round trip differed by a median of zero; and the whole gap was under one percent of that EA's typical losing trade. Four cents are small against a stop counted in dollars. The same cost against a stop of a dozen pips is not small, because the cost of a round trip does not shrink to match a narrow stop. Across nineteen of those signals, scored one symbol at a time, the cost ratio inside a single EA ran from 1.74 percent of the stop width on XAUUSD to 19.99 percent on NZDCHF, and inside another from 0.11 to 5.16. So whether your account is cheap or expensive for an EA is not a fact about the account alone or the EA alone. It is a ratio, cost divided by stop width, and that ratio is rarely measured before money is at risk. This tool measures it on your account, without sending an order.
What it measures
The free edition measures four things on the chart symbol, all from your own terminal and your own account.
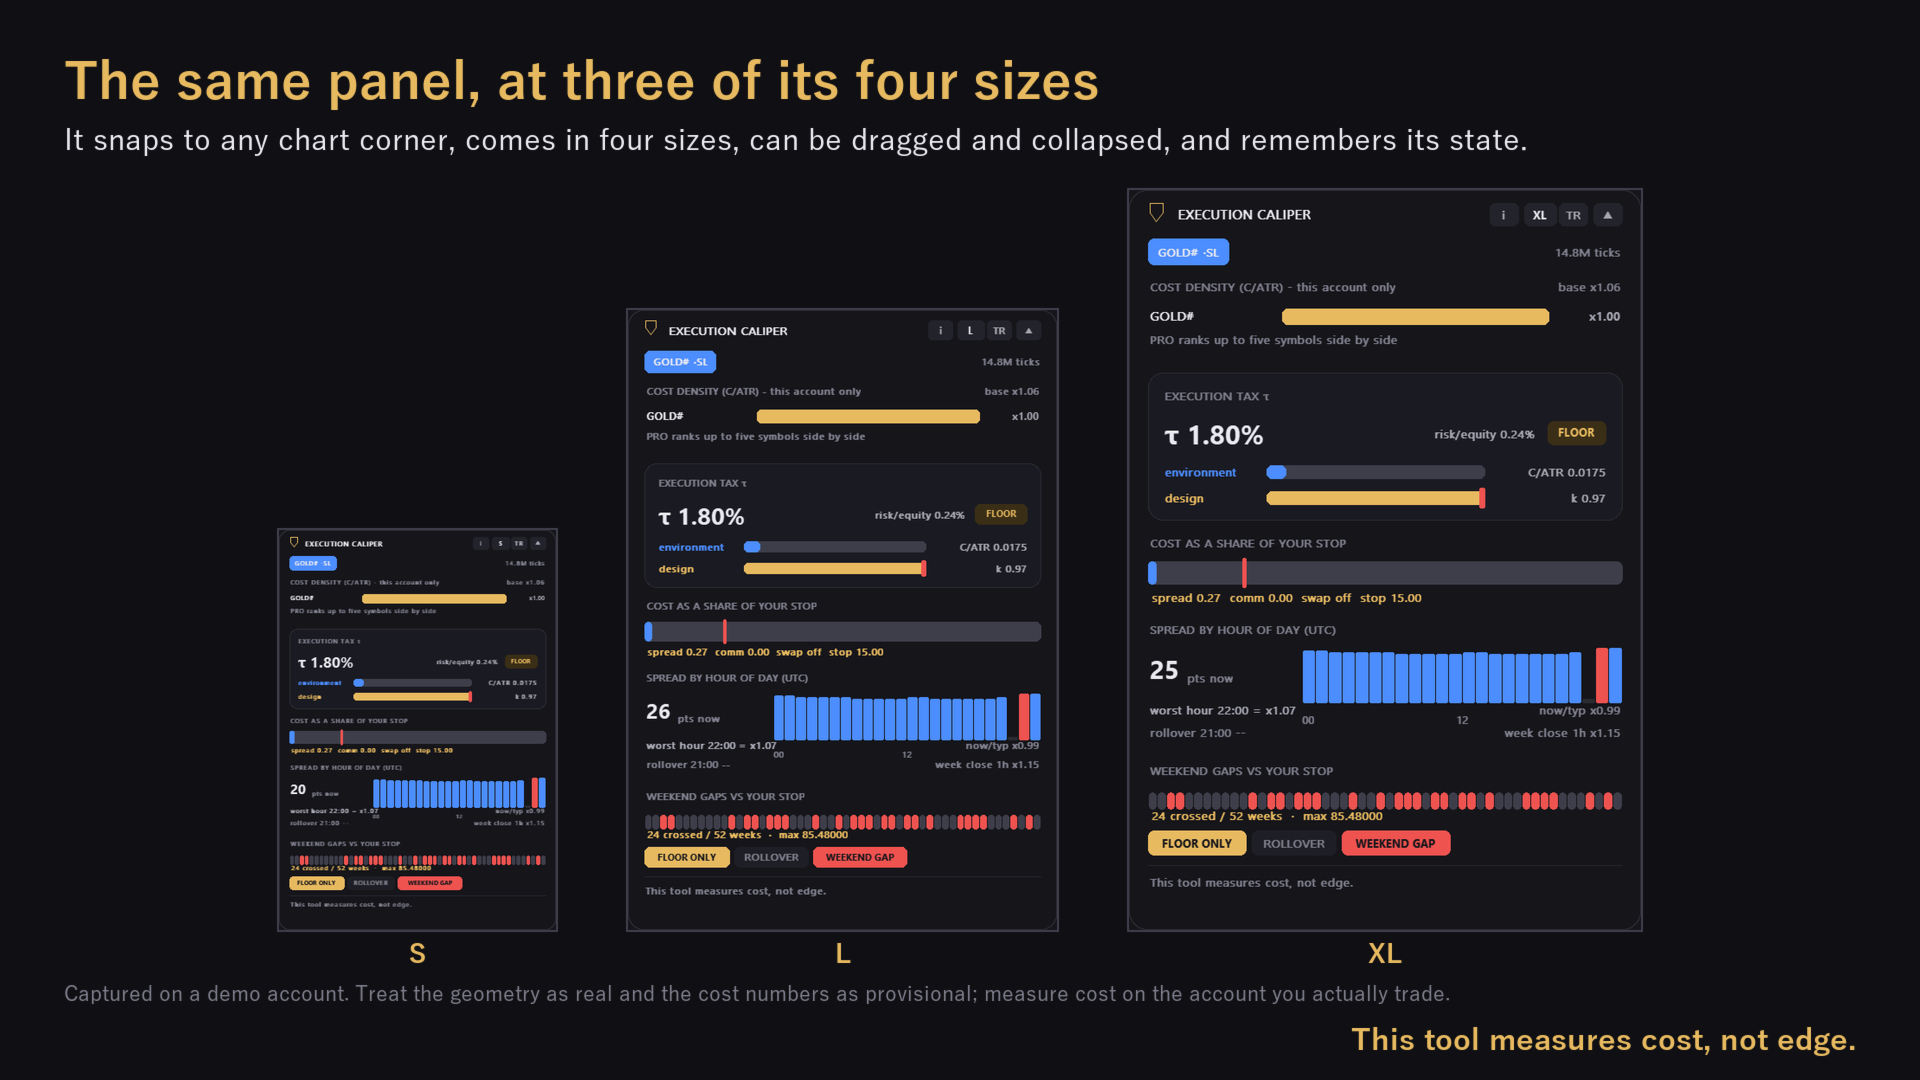
Spread by hour of day. Every tick, ask minus bid is recorded into a UTC hourly bin. On brokers that keep tick history the tool backfills up to 60 days from history in the background; on brokers that do not, it collects live and shows how far collection has progressed. You get the current spread, the median for each hour of the day as a 24-bar profile, and the median and tail values of the worst hour and of the rollover band, with the exact figures on hover. The first 30 days are frozen as a baseline so you can see later whether your broker's spread environment has drifted.
Account and symbol facts. Stops level, freeze level, minimum volume and step, contract size, swap mode and swap values, margin and profit currencies, all read directly from the terminal. Commission is measured from your own account history when enough deals exist; if not, you enter it and the panel shows a badge that it is being treated as unknown.
Floor cost ratio. You enter the stop width of the EA, in points or in price, for this symbol only. The tool adds spread, commission and swap, divides by that stop width, and labels the result FLOOR. It is called a floor because the free edition contains no slippage measurement, and slippage is a real cost that this number does not include. In our own measurements on our own EAs, total execution cost ran roughly 2 to 4 times the raw spread alone. The panel shows this caveat next to the number rather than hiding it. The ratio is also split into two factors, the environment factor (cost relative to the typical hourly range of the symbol) and the design factor (how many typical hourly ranges the stop spans), so you can see whether a high ratio comes from the account or from the EA's stop design. A regime indicator shows how the range of the last 14 hours compares with the typical range, so you can tell when the number is being inflated by an unusually quiet market. If there is not enough price history to measure the denominator, the tool says not measured instead of showing a small number.
Weekend gap counter. From your broker's own daily bars, the tool counts how many of the last 52 weekends gapped by more than your stop width, and shows which weeks did.
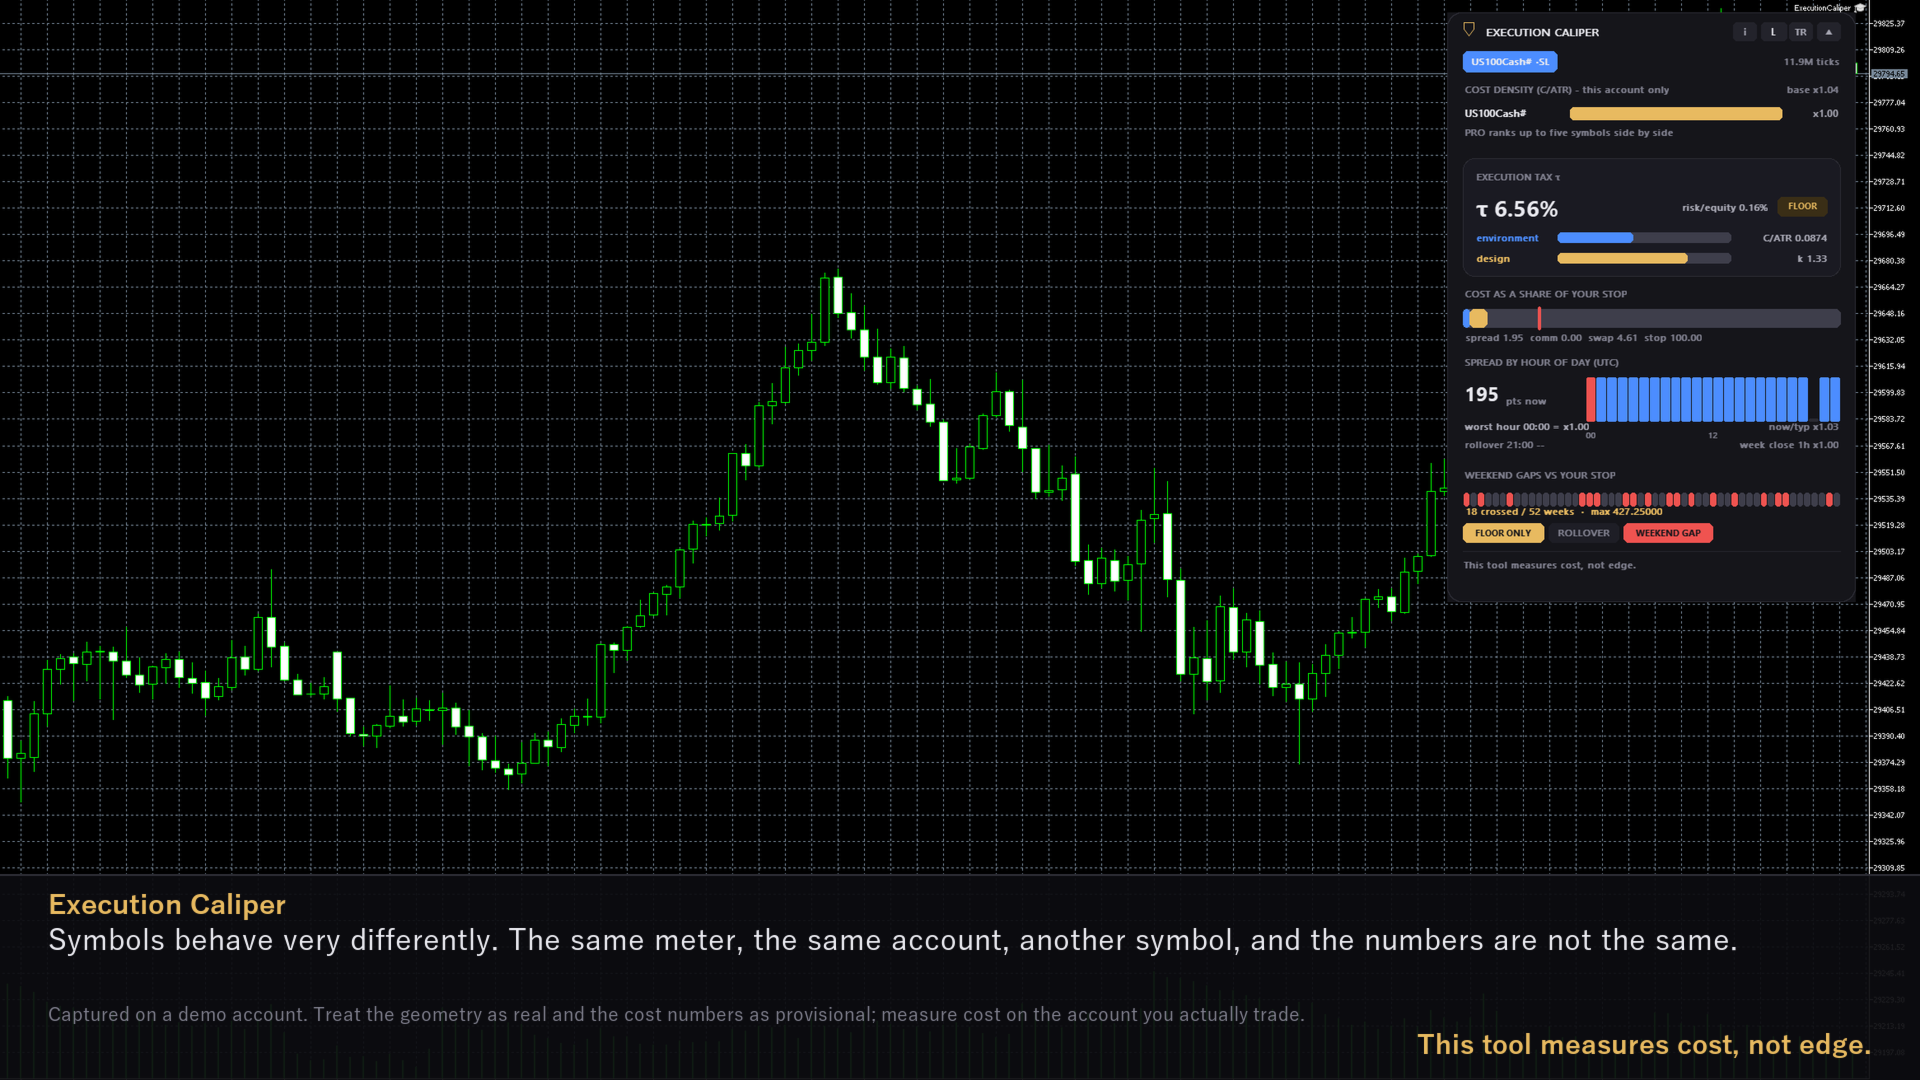
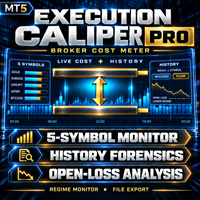
Symbols behave very differently here. In signals we measured, the same EA's cost ratio varied more than tenfold depending on which symbol the trades were on. The free edition measures the chart symbol, and nothing on this page depends on the paid edition. Execution Caliper Pro is a sister product, published separately, that adds five symbols side by side, history forensics, open-loss reconstruction, regime alert and export, and an optional slippage probe that sends real minimum-lot orders and stays off until you arm it. The user guide linked below compares the two.
How it shows results, and what it refuses to do
This instrument does not grade your account. There is no green, amber, red verdict, no score, no percentile against other brokers, and no list of good or bad brokers. We tried building such a scale and withdrew it, because the reference data could not support that precision. What you get instead is your own numbers, side by side, with the exact figures on hover.
There is one line on the panel that carries a judgment of its own: it is drawn where cost exceeds about twenty percent of the stop width. That is the band where our own EAs died of execution cost in live measurement. It is a fact about our EAs, not a law about yours. We do not claim that nothing survives above that line. We only mark where we did not. Two chips, ROLLOVER and WEEKEND GAP, and a few red readouts light at conventional thresholds (a 2.0x spread multiple, one weekend gap across the stop); those thresholds are conventions, not measurements, and the panel says so when you hover that row.
If you run the tool on a demo account, treat the geometry (stops level, contract size, gap history) as real and the cost numbers as provisional. Demo pricing has not been verified to match live pricing; measure cost on the account you actually trade.
How we keep it honest
This tool measures cost, not edge. It cannot tell you whether an EA has an advantage, and you should be suspicious of any product that says it can. While building it, we found and corrected three errors in our own earlier working tables, all from our own re-calculation: mixing symbols in one distribution, choosing thresholds after seeing the data, and pooling different periods and brokers into one number. The first version of this page then made the third of those mistakes in its own example, and the paragraph above was rewritten when our own recomputation showed it. The full record is on that same blog, and this tool is designed so that those specific mistakes cannot recur: one stop width per symbol, measurements taken on your account only, numbers refused rather than estimated when the data is insufficient. The panel footer carries the same sentence at all times, whether expanded or collapsed.
Practical notes
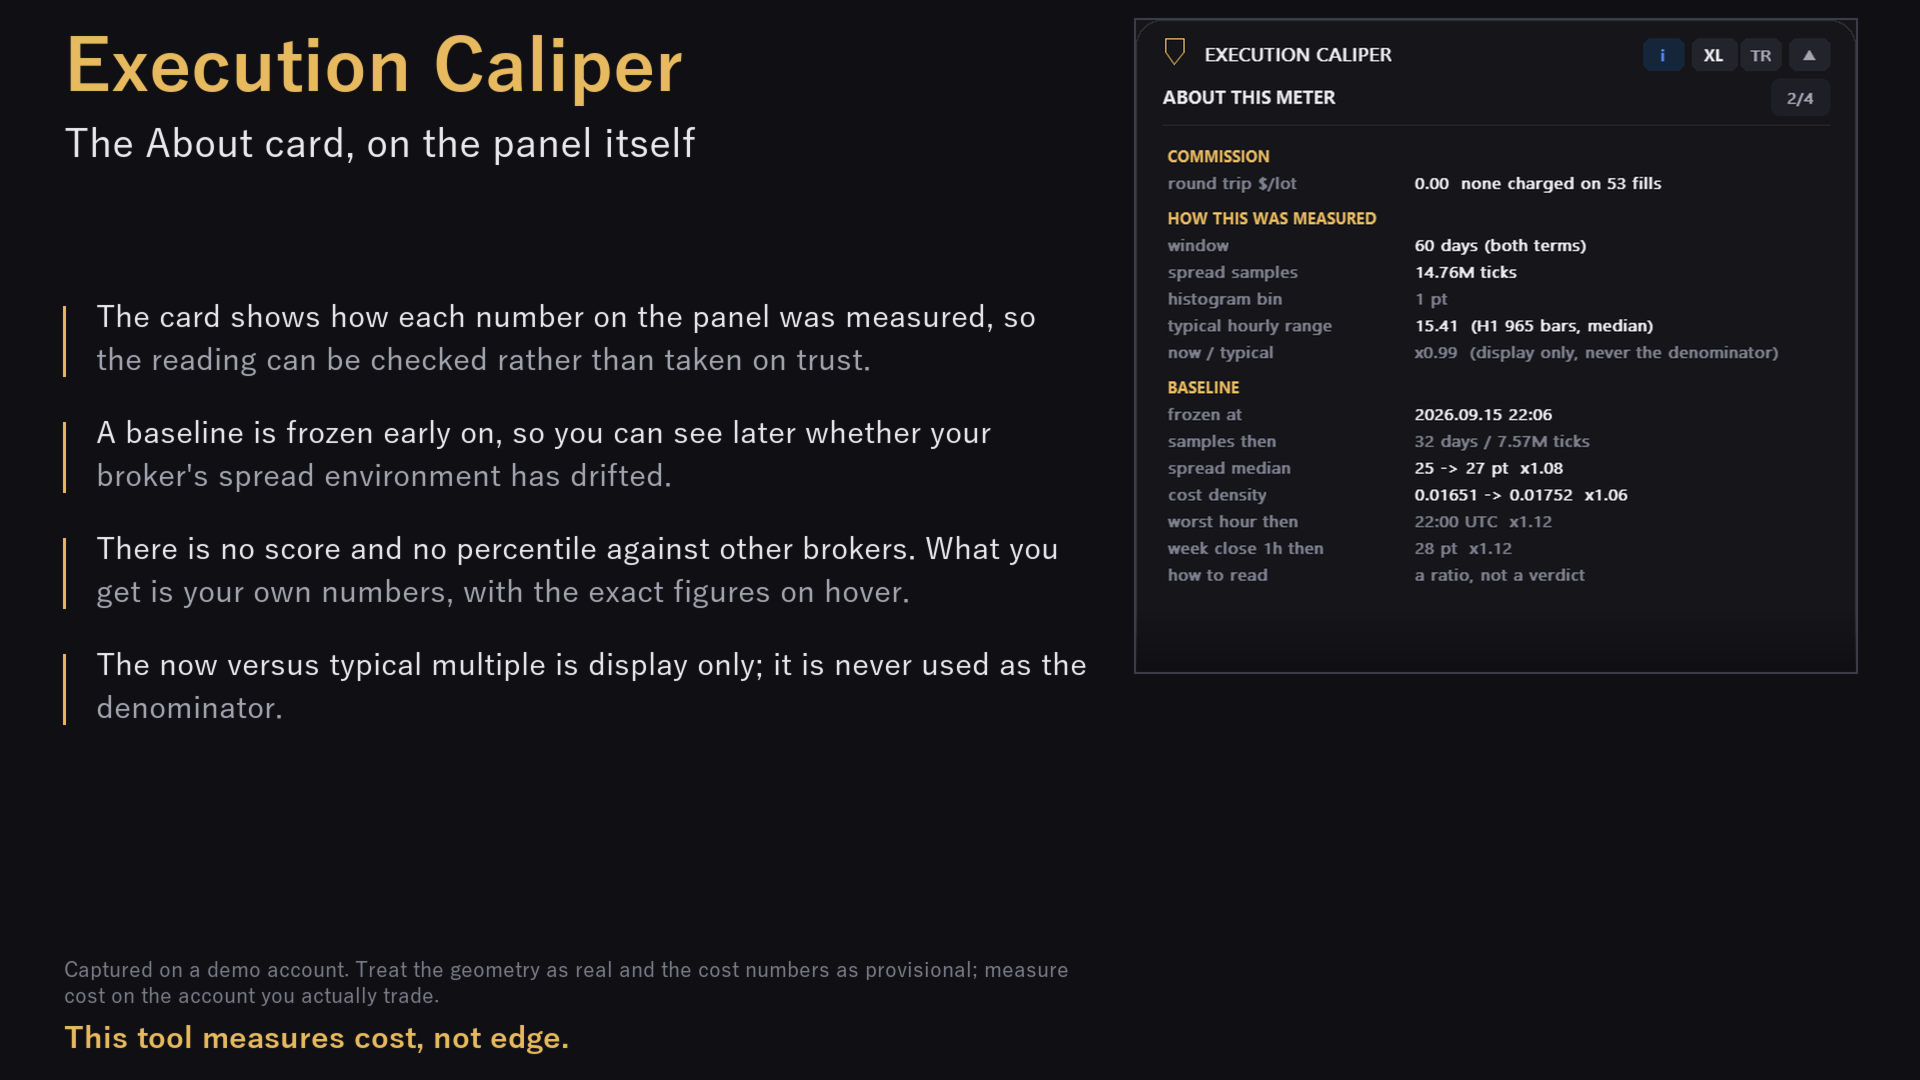
The panel snaps to any chart corner, comes in four sizes, can be dragged and collapsed, and remembers its state. In the strategy tester it draws clearly labelled synthetic data so the panel is never blank; real measurement requires a live chart. Because the free edition never sends orders, running it on a prop firm account adds no trading activity of its own, but check your firm's rules on third-party tools as you would for any utility. The About card explains how the measurements were taken, what the red line means and the three ways to obtain an EA's stop width when it is not obvious from the EA's settings; the inputs themselves are described in the Inputs tab. Every input and every row of the panel is explained in the user guide on the author's blog: Execution Caliper user guide
Execution Caliper is a measuring instrument, not a trading robot. It sits on one chart and measures how much execution cost your account charges on that symbol, then divides that cost by the stop width of the EA you are thinking of running. The result is one ratio: cost as a share of your stop. It sends no orders, opens no positions, and touches nothing that belongs to other EAs on the terminal. It also makes no claim about winning. We do not say it makes you profitable, safer, or better. It tells you what your account costs, before you find out the expensive way.
Why it exists
The figures in this paragraph are not ours. They come from public MQL5 signals for other people's EAs, which we re-measured ourselves from their exported trade lists; the signal identifiers, the recomputation and the corrections to our own earlier tables are set out on the author's blog on this site. Two of those signals run the same EA on two different brokers. Matched trade for trade, 760 pairs, the two brokers filled its entries a median of four cents an ounce apart; where both accounts also closed within minutes of each other, the round trip differed by a median of zero; and the whole gap was under one percent of that EA's typical losing trade. Four cents are small against a stop counted in dollars. The same cost against a stop of a dozen pips is not small, because the cost of a round trip does not shrink to match a narrow stop. Across nineteen of those signals, scored one symbol at a time, the cost ratio inside a single EA ran from 1.74 percent of the stop width on XAUUSD to 19.99 percent on NZDCHF, and inside another from 0.11 to 5.16. So whether your account is cheap or expensive for an EA is not a fact about the account alone or the EA alone. It is a ratio, cost divided by stop width, and that ratio is rarely measured before money is at risk. This tool measures it on your account, without sending an order.
What it measures
The free edition measures four things on the chart symbol, all from your own terminal and your own account.
Spread by hour of day. Every tick, ask minus bid is recorded into a UTC hourly bin. On brokers that keep tick history the tool backfills up to 60 days from history in the background; on brokers that do not, it collects live and shows how far collection has progressed. You get the current spread, the median for each hour of the day as a 24-bar profile, and the median and tail values of the worst hour and of the rollover band, with the exact figures on hover. The first 30 days are frozen as a baseline so you can see later whether your broker's spread environment has drifted.
Account and symbol facts. Stops level, freeze level, minimum volume and step, contract size, swap mode and swap values, margin and profit currencies, all read directly from the terminal. Commission is measured from your own account history when enough deals exist; if not, you enter it and the panel shows a badge that it is being treated as unknown.
Floor cost ratio. You enter the stop width of the EA, in points or in price, for this symbol only. The tool adds spread, commission and swap, divides by that stop width, and labels the result FLOOR. It is called a floor because the free edition contains no slippage measurement, and slippage is a real cost that this number does not include. In our own measurements on our own EAs, total execution cost ran roughly 2 to 4 times the raw spread alone. The panel shows this caveat next to the number rather than hiding it. The ratio is also split into two factors, the environment factor (cost relative to the typical hourly range of the symbol) and the design factor (how many typical hourly ranges the stop spans), so you can see whether a high ratio comes from the account or from the EA's stop design. A regime indicator shows how the range of the last 14 hours compares with the typical range, so you can tell when the number is being inflated by an unusually quiet market. If there is not enough price history to measure the denominator, the tool says not measured instead of showing a small number.
Weekend gap counter. From your broker's own daily bars, the tool counts how many of the last 52 weekends gapped by more than your stop width, and shows which weeks did.
Symbols behave very differently here. In signals we measured, the same EA's cost ratio varied more than tenfold depending on which symbol the trades were on. The free edition measures the chart symbol, and nothing on this page depends on the paid edition. Execution Caliper Pro is a sister product, published separately, that adds five symbols side by side, history forensics, open-loss reconstruction, regime alert and export, and an optional slippage probe that sends real minimum-lot orders and stays off until you arm it. The user guide linked below compares the two.
How it shows results, and what it refuses to do
This instrument does not grade your account. There is no green, amber, red verdict, no score, no percentile against other brokers, and no list of good or bad brokers. We tried building such a scale and withdrew it, because the reference data could not support that precision. What you get instead is your own numbers, side by side, with the exact figures on hover.
There is one line on the panel that carries a judgment of its own: it is drawn where cost exceeds about twenty percent of the stop width. That is the band where our own EAs died of execution cost in live measurement. It is a fact about our EAs, not a law about yours. We do not claim that nothing survives above that line. We only mark where we did not. Two chips, ROLLOVER and WEEKEND GAP, and a few red readouts light at conventional thresholds (a 2.0x spread multiple, one weekend gap across the stop); those thresholds are conventions, not measurements, and the panel says so when you hover that row.
If you run the tool on a demo account, treat the geometry (stops level, contract size, gap history) as real and the cost numbers as provisional. Demo pricing has not been verified to match live pricing; measure cost on the account you actually trade.
How we keep it honest
This tool measures cost, not edge. It cannot tell you whether an EA has an advantage, and you should be suspicious of any product that says it can. While building it, we found and corrected three errors in our own earlier working tables, all from our own re-calculation: mixing symbols in one distribution, choosing thresholds after seeing the data, and pooling different periods and brokers into one number. The first version of this page then made the third of those mistakes in its own example, and the paragraph above was rewritten when our own recomputation showed it. The full record is on that same blog, and this tool is designed so that those specific mistakes cannot recur: one stop width per symbol, measurements taken on your account only, numbers refused rather than estimated when the data is insufficient. The panel footer carries the same sentence at all times, whether expanded or collapsed.
Practical notes
The panel snaps to any chart corner, comes in four sizes, can be dragged and collapsed, and remembers its state. In the strategy tester it draws clearly labelled synthetic data so the panel is never blank; real measurement requires a live chart. Because the free edition never sends orders, running it on a prop firm account adds no trading activity of its own, but check your firm's rules on third-party tools as you would for any utility. The About card explains how the measurements were taken, what the red line means and the three ways to obtain an EA's stop width when it is not obvious from the EA's settings; the inputs themselves are described in the Inputs tab. Every input and every row of the panel is explained in the user guide on the author's blog: Execution Caliper user guide