Execution Caliper User Guide: Setup, Reading the Panel, and Every Setting (Free and Pro)

What Execution Caliper is
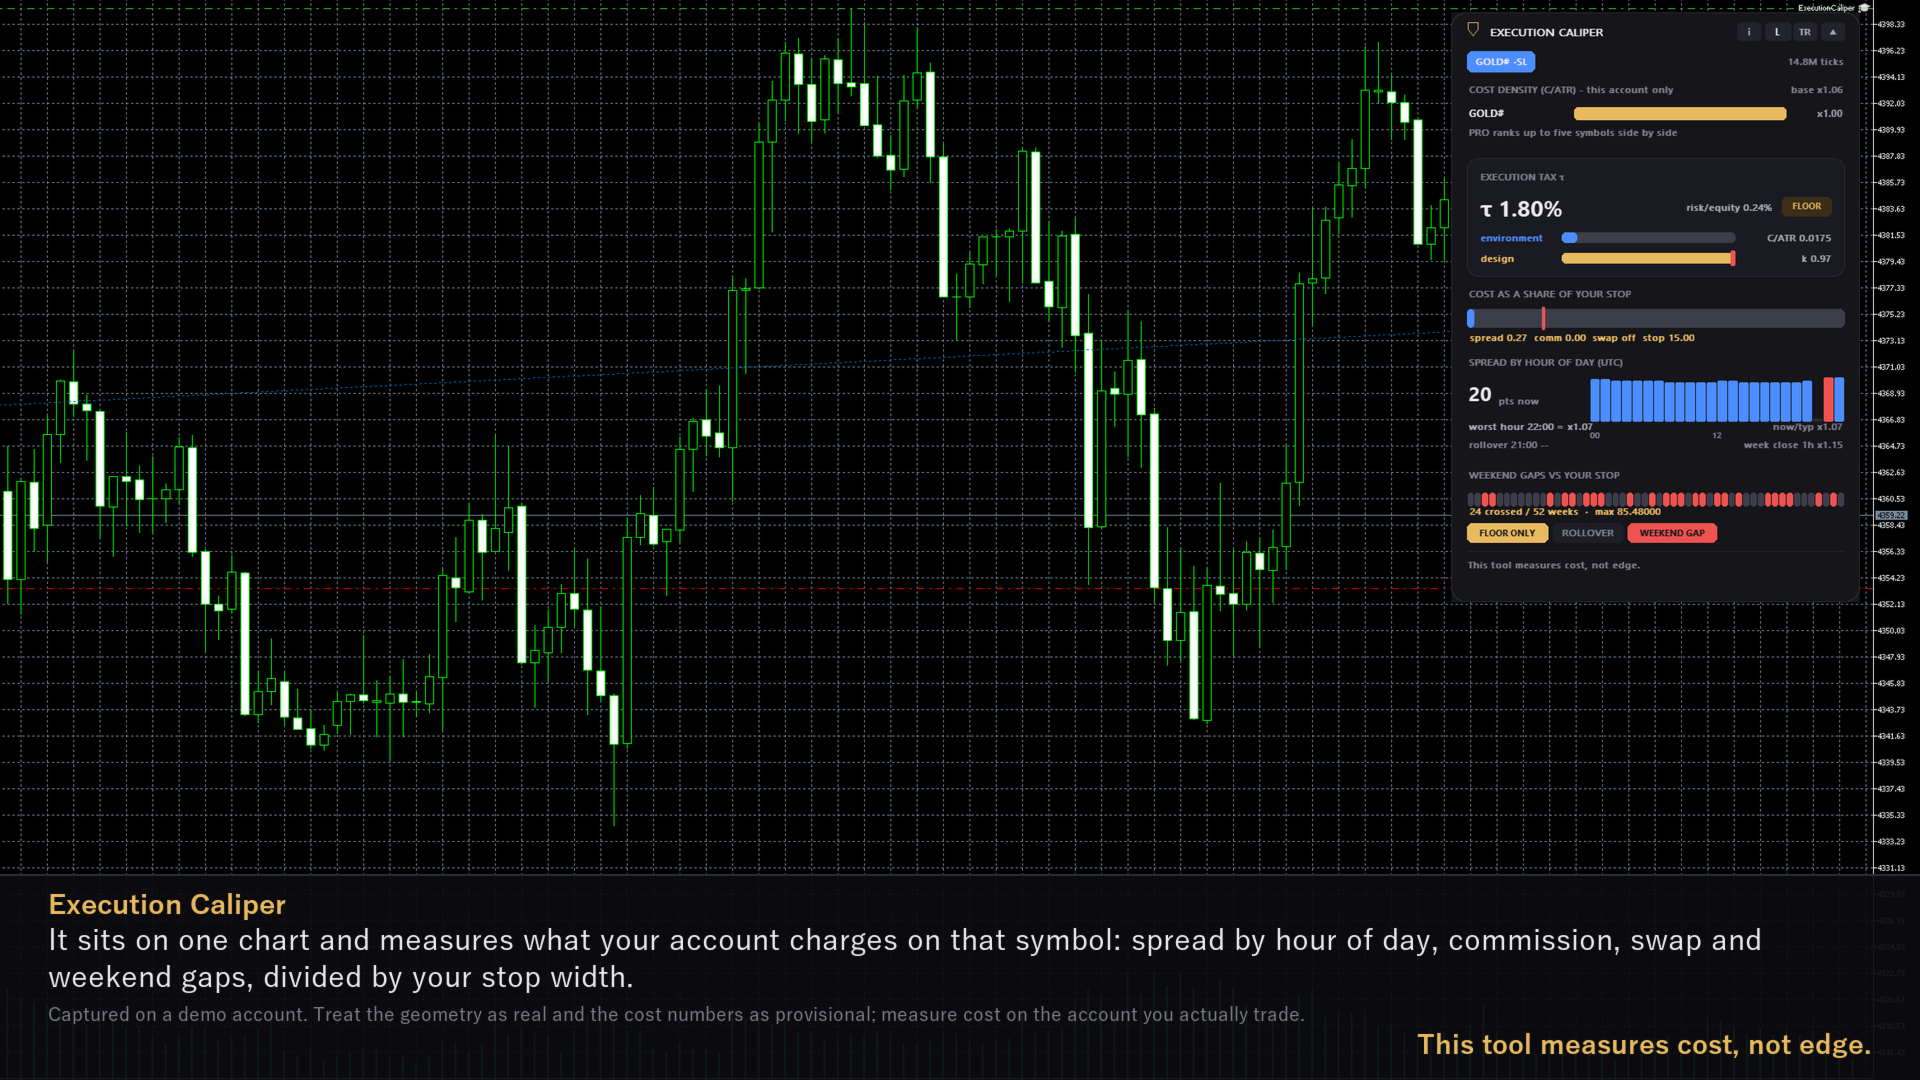
Execution Caliper is not a trading robot. It is a meter. It sits on one chart and measures the execution cost your account charges on that symbol, then divides that cost by the stop distance of the EA you are thinking of running. What comes out is one ratio: cost as a share of your stop. It places no orders, holds no positions, never touches the other EAs on the same terminal, and does not claim that anything wins. Its own footer says so: This tool measures cost, not edge.
The free edition, Execution Caliper, measures the symbol of the chart it sits on. Execution Caliper Pro measures up to five symbols in one panel, each with its own stop, and adds history forensics on your own closed deals, a reconstruction of the floating drawdown, a regime alert against a frozen baseline and a CSV export. Everything below applies to both editions unless marked Pro only. The screenshots were taken on a demo account; their numbers are examples.
Quick start
- Open a chart of the symbol you want to measure and drag Execution Caliper onto it from the Navigator, like any Expert Advisor. It needs no DLL and no web access.
- In the inputs, pick Language / 言語. In the group Your EA profile (EA x SYMBOL), type the stop distance of the EA you are checking into Stop distance (Pro: Symbol 1 stop distance), with Stop unit set to Points or Price distance. If you do not know it yet, leave 0: the panel still collects; it just cannot show the ratio.
- Leave Tick-history backfill (days; 25+ for tau and baseline) at 60. Below 25 days the baseline never freezes, and below 20 days the ratio and the cost density cannot appear at all.
- Click OK. The panel opens in the top-right corner, and the symbol tab shows collecting with a percentage while it reads the tick history.
- When the tab shows the sample count in M ticks and the τ card shows a number, hover over any row: the footer tells you what that row was measured from.
What happens in the first hour
Backfill. The panel reads the symbol's tick history backwards from now, one 24-hour slice per second, for the days set in the backfill input (60 by default). The tab shows collecting with the share of days done (it never reaches 100%), then shows the total in M ticks. When the terminal returns tick history without delay, the default 60 days take about a minute. If the terminal cannot return tick history, the symbol switches to live only after 21 failed attempts in a row and the picture is built from live quotes over days.
What appears when. The current spread (pts now) is there at once; the hour-of-day bars grow as samples arrive. The cost density and τ need the typical hourly range: the median true range of the completed H1 bars inside the backfill window, at least 200 bars spanning 20 days or more, which is why the window should be 25 days or more once weekends and holidays are taken out. If the H1 history is not there yet it is tried again every five minutes, so τ can take up to about five minutes. τ also needs your stop; the weekend-gap row needs your stop and 30 daily bars. Nothing waits for the backfill to reach 100%, and the panel recomputes every two seconds.
Baseline. Each symbol freezes one baseline, once, and does not rewrite it as long as the backfill window stays the same (changing the window is the one exception; see the settings table). With the default window it freezes as soon as the samples span 30 days and the cost density exists. On a broker with tick history that happens during the first backfill, so the baseline is normally the thirty days before the day you attached the panel, not your first month of use. Until then the About card's BASELINE section reads not frozen yet with the days in hand; afterwards frozen at and the date, and the cost density heading shows base, today's cost density divided by the frozen one.
Restarts. The collection is saved when you remove the panel, change its inputs or close the terminal normally, not when the terminal is killed. The next start adds only the time the panel was off, and no tick is counted twice, so collecting shows for a few seconds only. Pro reads the last 31 days again to rebuild the recent window of its regime alert, which takes about half a minute, without adding those ticks to the distribution a second time. The spread distribution accumulates from the first run, while the typical hourly range in the denominator is always the last N days of H1 bars.
Reading the panel
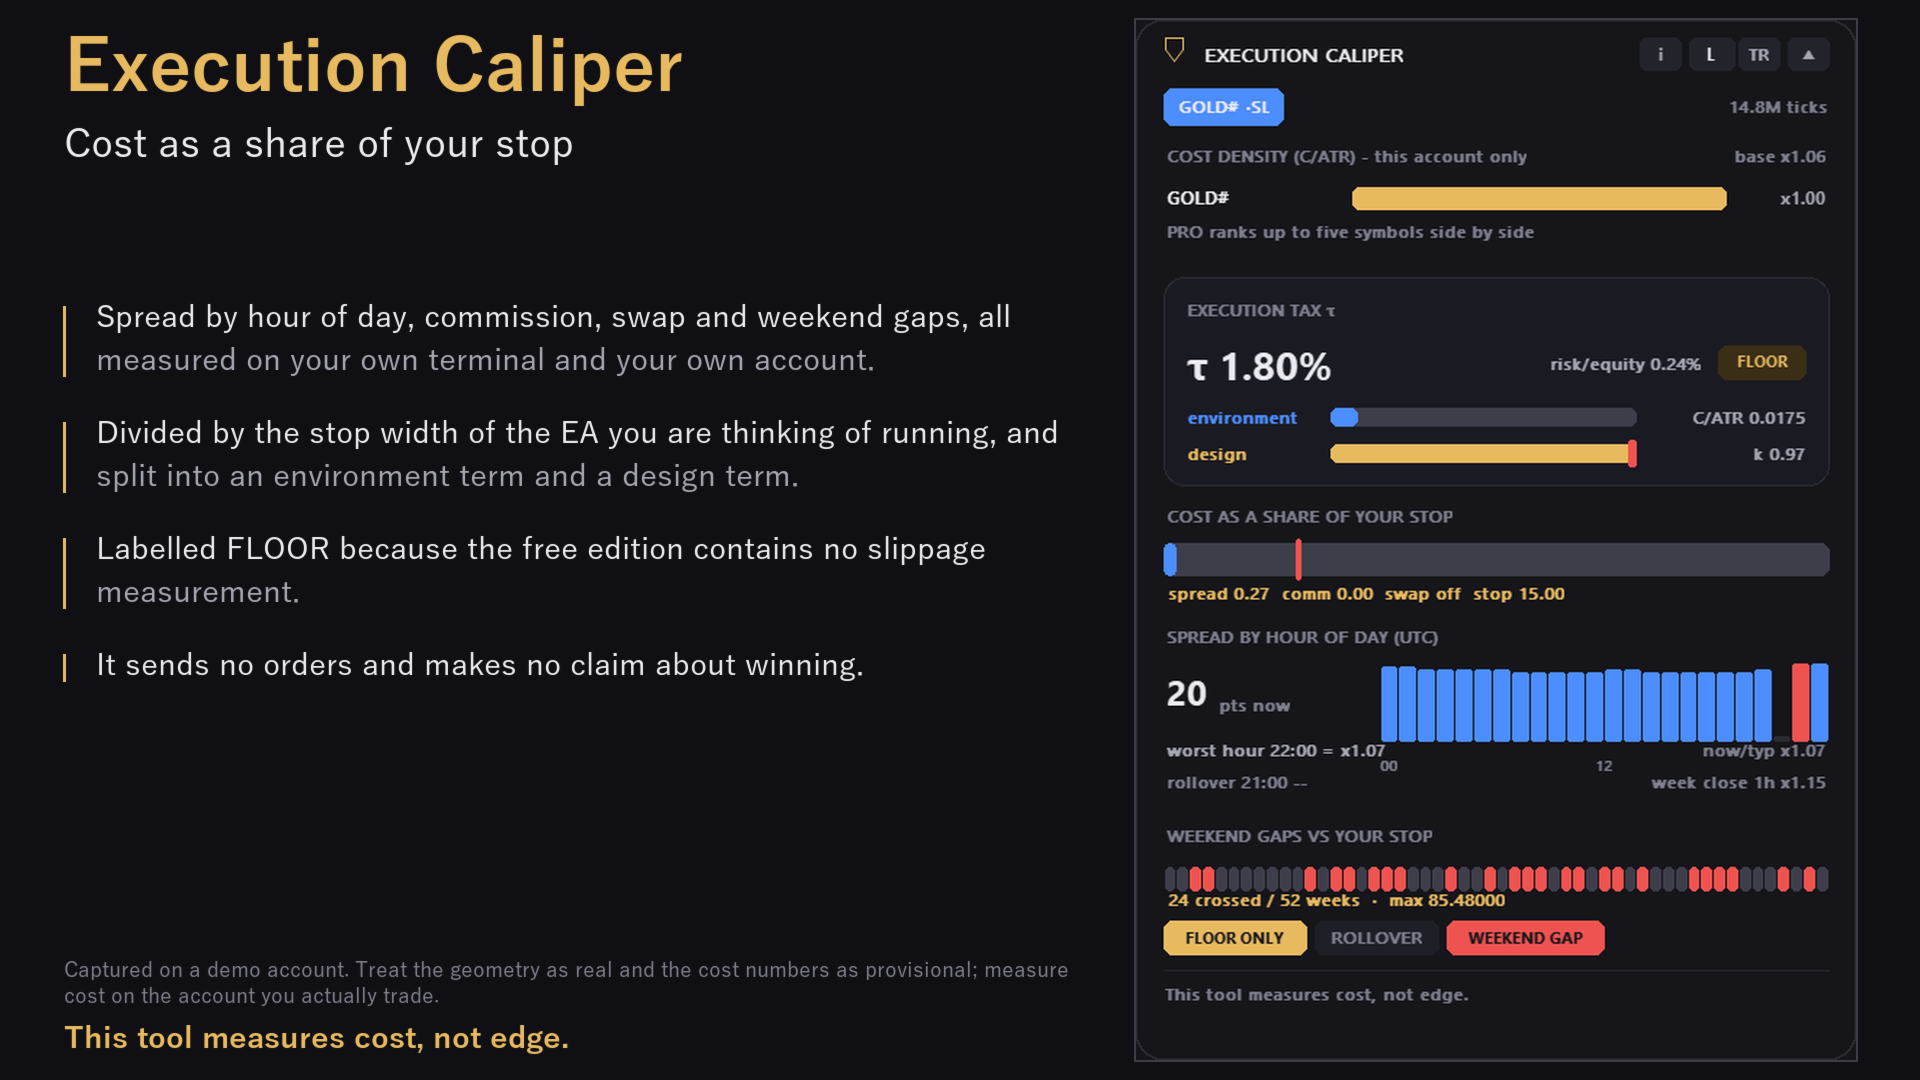
Top to bottom, in the order of the main face. Hovering over any row shows in the footer, in up to two lines, what it was measured from. Headings, chips and reason texts stay in English in both languages.
Header row
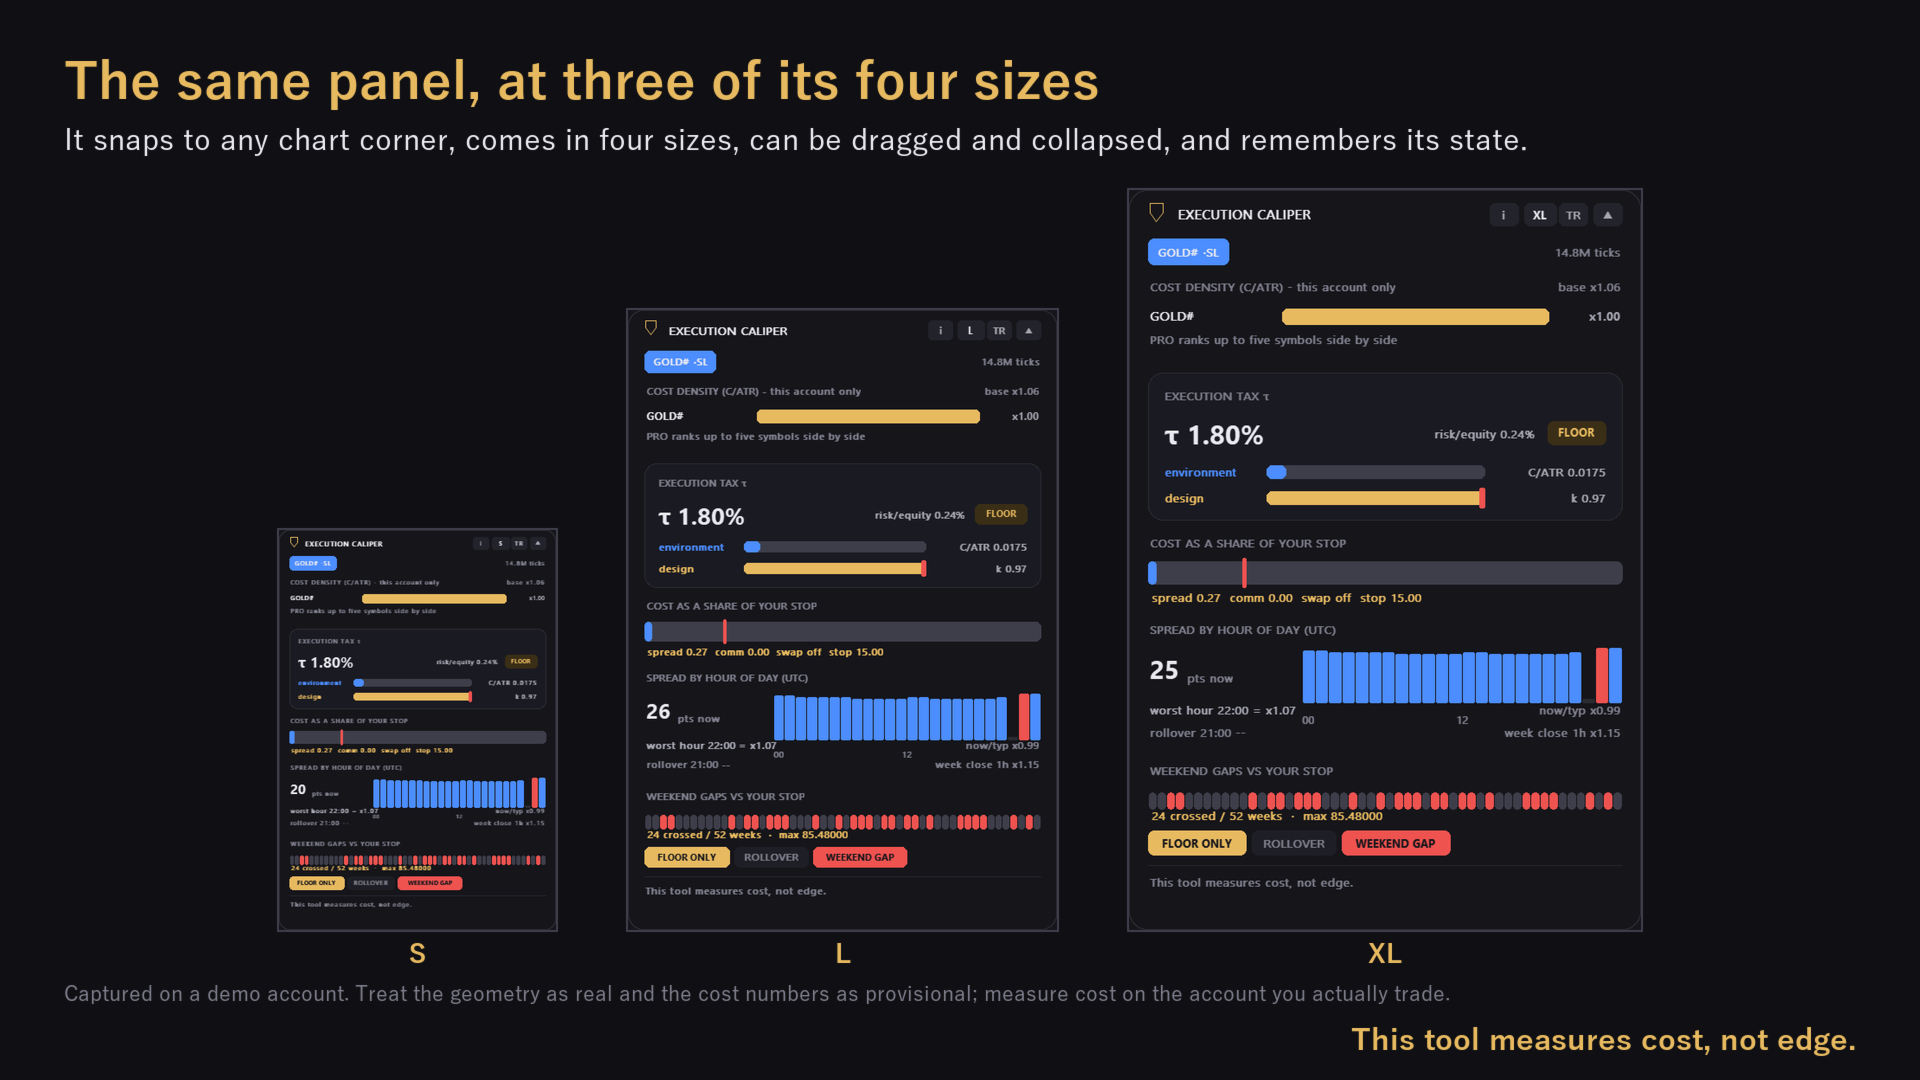
A shield and the name EXECUTION CALIPER (Pro: EXECUTION CALIPER PRO); when τ is 20% or more the shield turns red and a red dot appears after the name. Buttons, from the right edge inward: collapse (a small triangle), corner (TL, TR, BR, BL), size (S, M, L, XL), i for the About card and, Pro only, F for the forensics page. Drag the empty part of the header to move the panel. Position, size, corner and collapsed state are remembered per chart; collapsed, the strip shows the symbol and FLOOR τ with the ratio.
Symbol tab
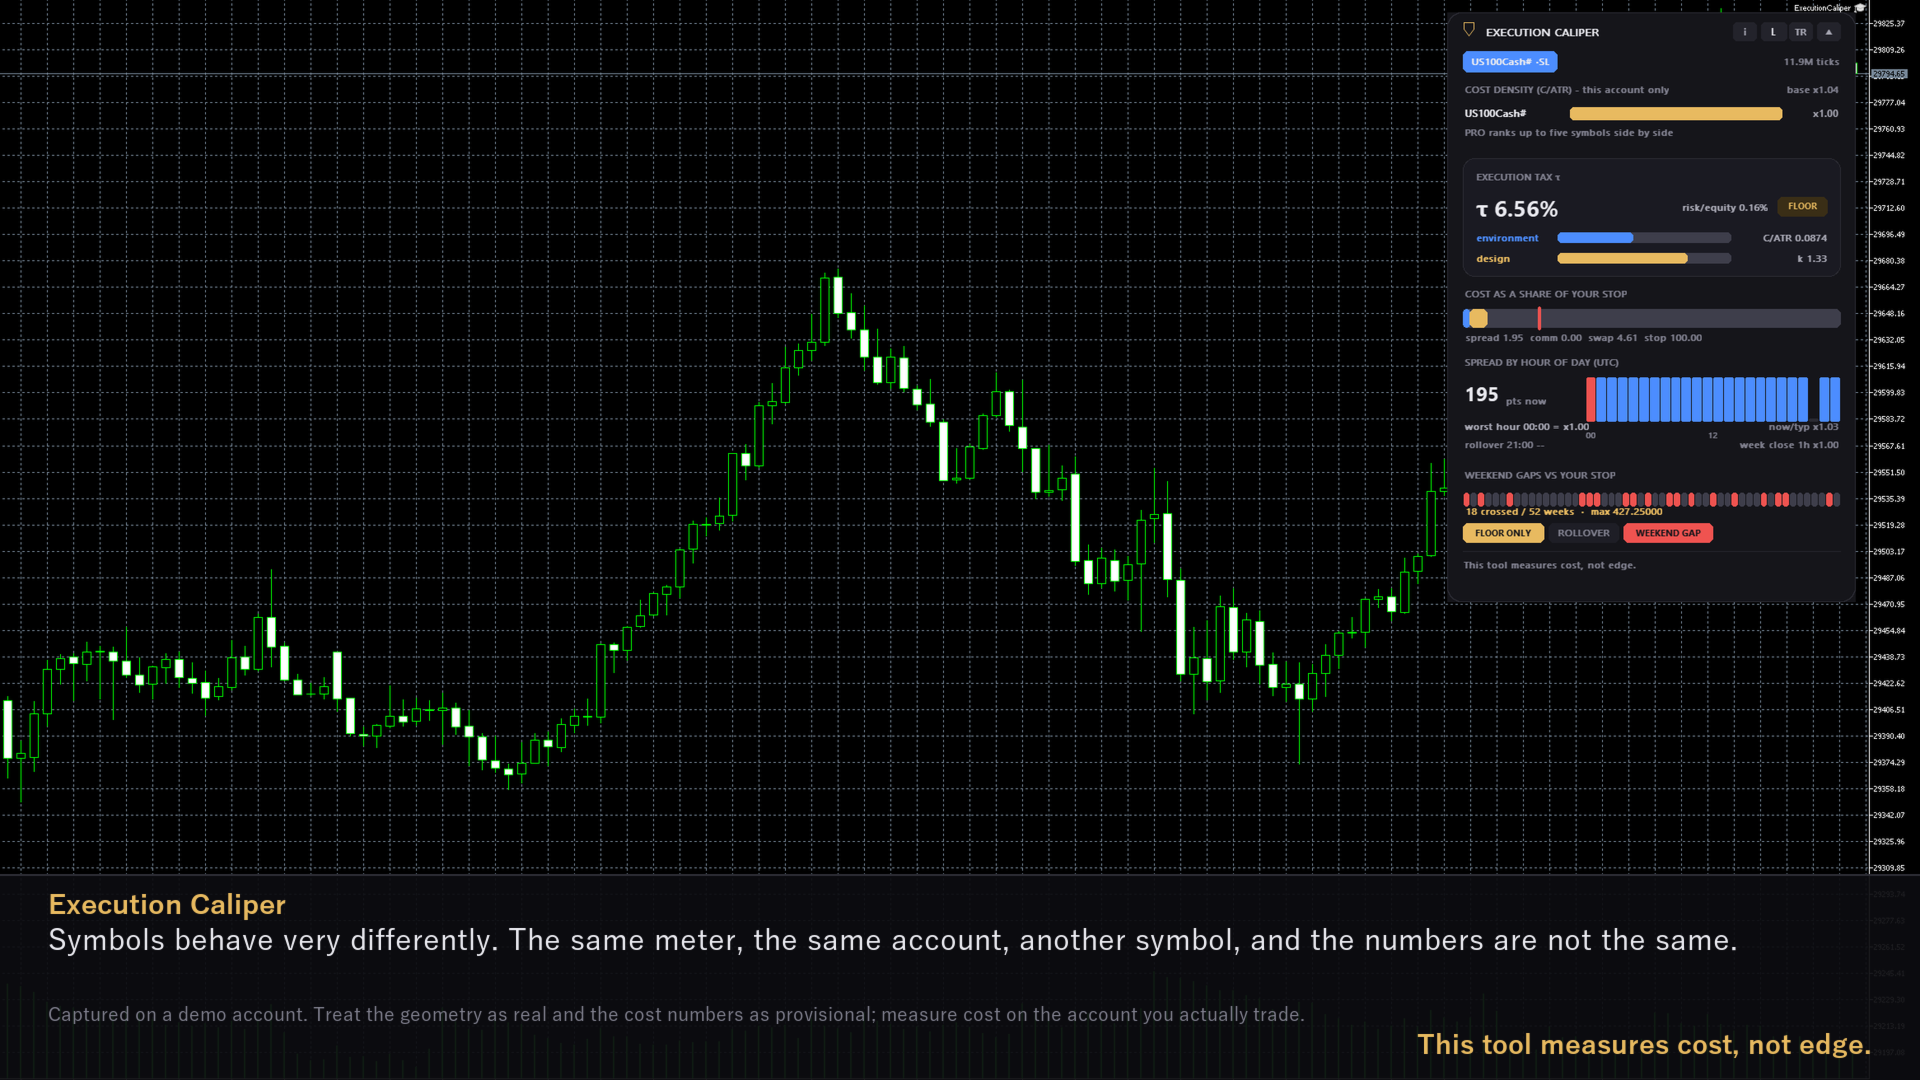
The symbol name, ·SL when a stop is set for it, and at the right end the collection status: collecting with a percentage, M ticks, live only, or synthetic (tester) in the Strategy Tester. Pro shows one tab per symbol; clicking one switches every row except the ranking to that symbol.
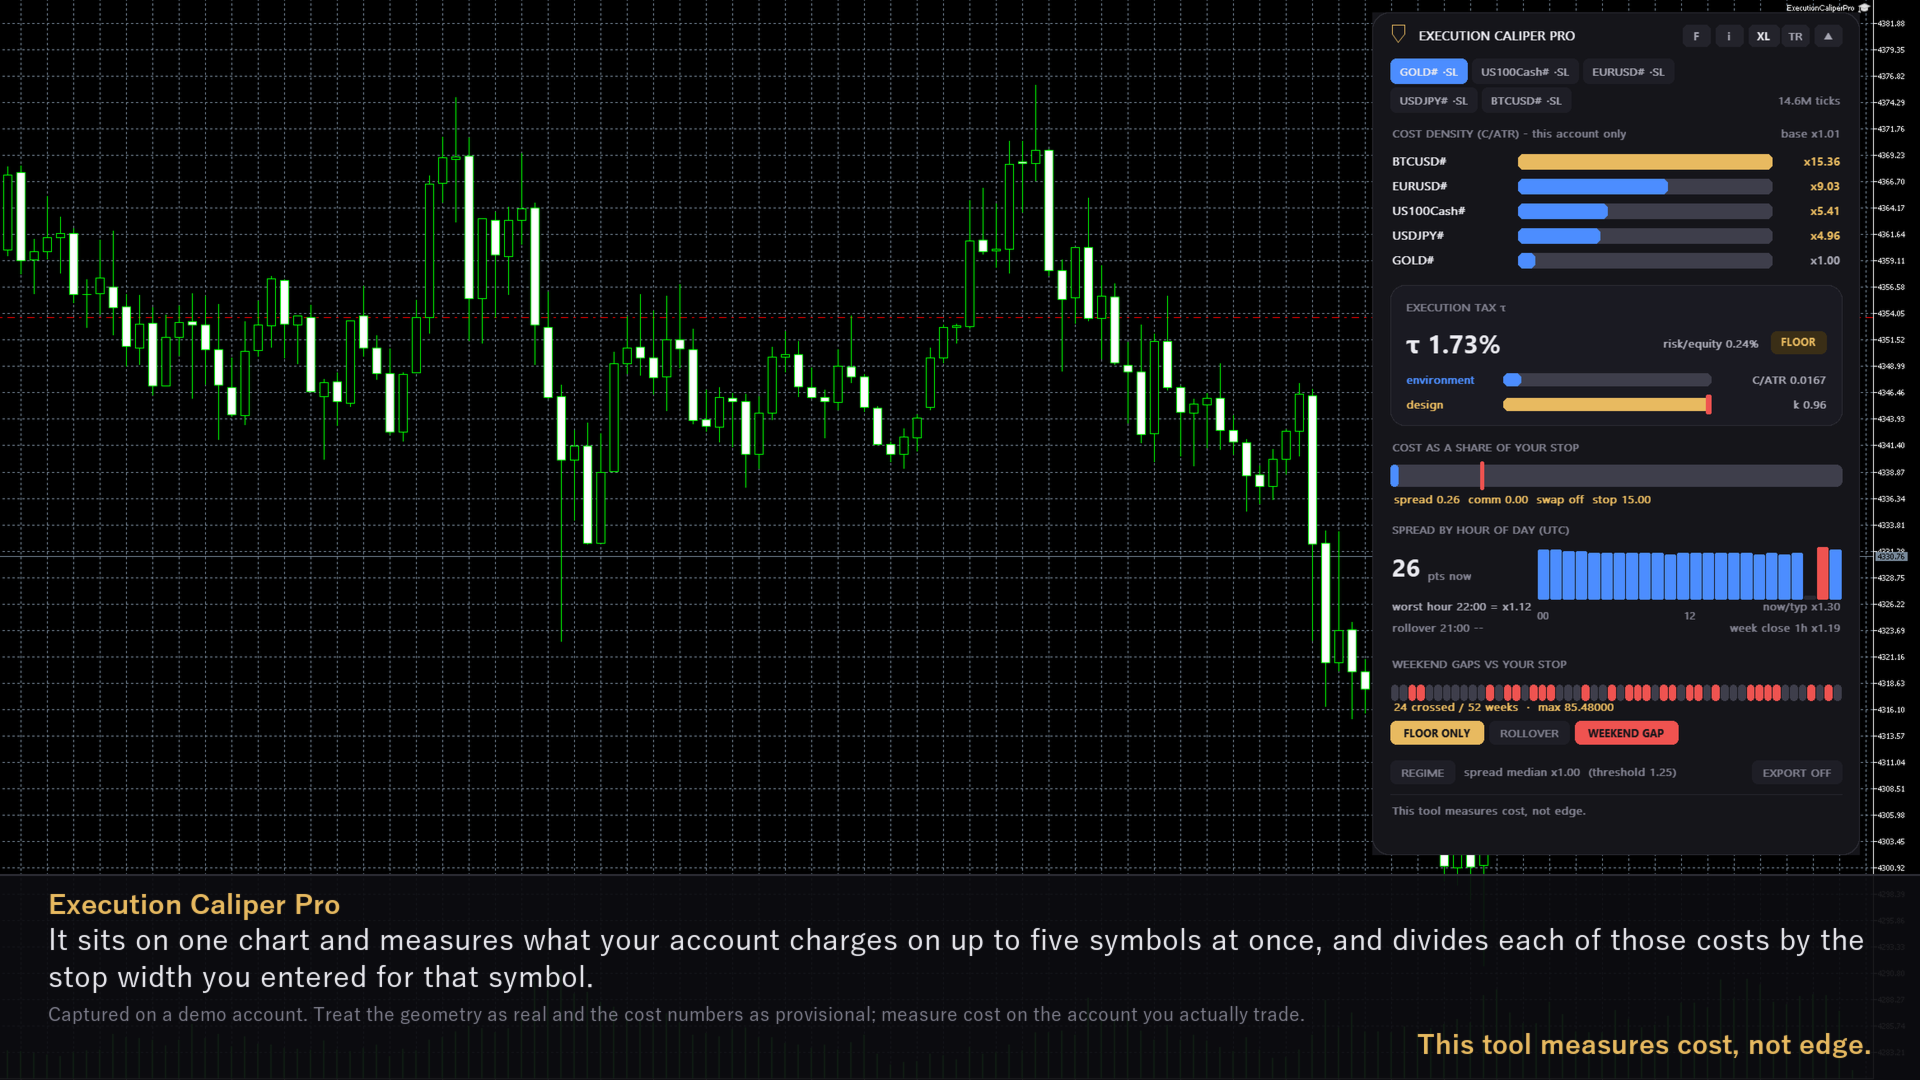
COST DENSITY (C/ATR) - this account only
Needs no stop. C is the spread median plus commission plus swap in price units; ATR is the typical hourly range. One line per symbol, most expensive first, with a bar relative to the most expensive and the multiple x against the cheapest (gold from 2.0). The free edition has one symbol, so it always reads x1.00, followed by PRO ranks up to five symbols side by side. In the heading, base is today's cost density over the frozen baseline's (base -- before it exists, gold from 1.25). The comparison never leaves your account.
EXECUTION TAX τ
τ is the round-trip cost over your stop: spread plus commission plus swap plus slippage, in price units. On the main face slippage is always 0, so the badge reads FLOOR: the figure is a lower bound. It turns red at 20%, which the About card explains as the band where the authors measured their own EA dying of execution cost, not a claim that nobody survives there.
Two bars split the ratio, τ = (C/ATR) x (1/k). The blue environment bar is C/ATR on a 0 to 0.20 scale; it depends on the symbol, the account and the hours, not on the EA. The gold design bar is 1/k, k being your stop over the typical hourly range, on a 0 to 1 scale; it depends on how wide the stop is relative to that symbol's typical hourly range, which is the EA's design choice, not the account's. Beyond its scale a bar stays full and gets a red mark at its end. With a lot size entered, risk/equity shows what that lot size loses over the stop as a share of current equity. Until τ exists the card reads Set your stop distance to get τ when no stop is entered, or τ not available yet when the stop is there and something else is still missing, with the reason on the second line.
COST AS A SHARE OF YOUR STOP
The bar is your stop at 100%, filled from the left with spread (blue), commission and swap (gold) and slippage (red, empty on the main face), with a red mark at 20%. Below it, spread, comm, swap and stop in price units. A component that cannot be converted into price shows n/a and is left out, so τ is then on the low side; off means a swap is quoted while the swap mode is disabled, and 0 is used. Before τ: waiting for your stop distance.
SPREAD BY HOUR OF DAY (UTC)
Left, the current spread in points (pts now). Right, 24 bars, one per UTC hour, scaled to the highest hourly median; the worst hour is red. worst hour names it and its multiple against the median of all other hours (red from 2.0). now/typ is the average true range of the last 14 completed H1 bars over the typical hourly range, display only, gold when 0.5 or more from 1. rollover 21:00 is the 21:00 to 21:59 UTC median over the other hours, -- where that hour has no quotes. week close 1h is the median of the final trading hour of the week, taken from the symbol's session times, over the all-sample median, n/a for symbols that trade through the weekend.
WEEKEND GAPS VS YOUR STOP
Read from your broker's own daily bars: any pause of 48 hours or more between two bars counts as a weekend (long holidays included), and the gap is the distance from the previous close to the next open. Fifty-two boxes show the last 52 gaps, oldest left, red where the gap exceeded your stop. The text counts the crossings out of the weeks shown; max is the largest gap over 104 weeks. Symbols that never pause read trades through the weekend - no gap to cross; without a stop or 30 daily bars, needs your stop and D1 history.
Chips
FLOOR ONLY is lit whenever τ is a floor, on the main face always. ROLLOVER lights when the measured worst hour reaches 2.0x, whatever hour that is. WEEKEND GAP lights when a gap in the 104-week window exceeded your stop and Nights held (swap) is above 0. The hover states that 2.0 and one crossing are conventions; only the multiple and the count are measured.
Footer and About card
The footer carries the line This tool measures cost, not edge. and, while you hover over a row, that row's hover text. The i button, or a click on the shield or the name, opens ABOUT THIS METER: a fact card read from the terminal (account, symbol specification, swap, the commission in use and its source, how the typical hourly range was measured, the baseline state), followed by caveats; click the page counter to turn pages. The ★ Rate button at the bottom right opens the rating card, which shows the product link to copy and never opens a browser. A card asking for a rating can also appear on its own, at most three times (Pro: twice); rating, or pressing Don't ask again, ends it for good, and the rating reminder input in the General group switches it off.
Entering your EA's conditions
All in the group Your EA profile (EA x SYMBOL). Only the stop is per symbol; the rest applies to every symbol on the panel.
Stop distance, three ways. Set Stop unit to points and type the distance into Stop distance: a point is the symbol's smallest price step, so on a five-digit pair one pip is 10 points, and where the point is 0.01 a stop of 1500 points is 15.00 in price. Or set the unit to price and type a price difference. Or leave Stop distance at 0 and set ... or stop = this x typical hourly range: the stop is then that multiple of the typical hourly range, re-derived every two seconds, and k equals the multiple; this way exists for the first slot only. Take the number from the EA's own inputs, from a demo run measured on the Pro forensics page, or from the backtest on the EA's product page; never carry a stop from one symbol to another. What you type is the nominal stop.
Nights held (swap). Nights a typical position stays open. Swap is that number of nights multiplied by the costlier of the long and short swap rates, and only when that side is a cost; 0 means no swap. The triple-swap day is shown on the About card but not added. This input also gates the WEEKEND GAP chip.
Commission. Round-trip commission/lot, account currency (0 = from history) takes the round trip of one lot in your account currency. At 0 the panel measures it from your own history of the last 365 days on that symbol; this needs at least four entry deals, otherwise the commission is unknown, counted as 0, and the About card says so. It is converted into price through what one lot of that symbol gains or loses per unit of price; where that is impossible the breakdown shows n/a and the commission is left out of τ.
Lot size. Typical lot size (for the equity-ratio row) enables the risk/equity line; 0 hides it.
Trading window. Trading window start hour UTC (-1 = all hours) and Trading window end hour UTC (exclusive) limit the spread median used in τ and the cost density to the hours your EA trades. The end hour is excluded, and the window may cross midnight (22 to 2 means 22, 23, 0 and 1). A negative value, or both equal, means all hours; if no sample falls inside the window, all hours are used without notice. The worst hour, rollover, week close and chips ignore the window.
Pro only
Five symbols and their stop slots
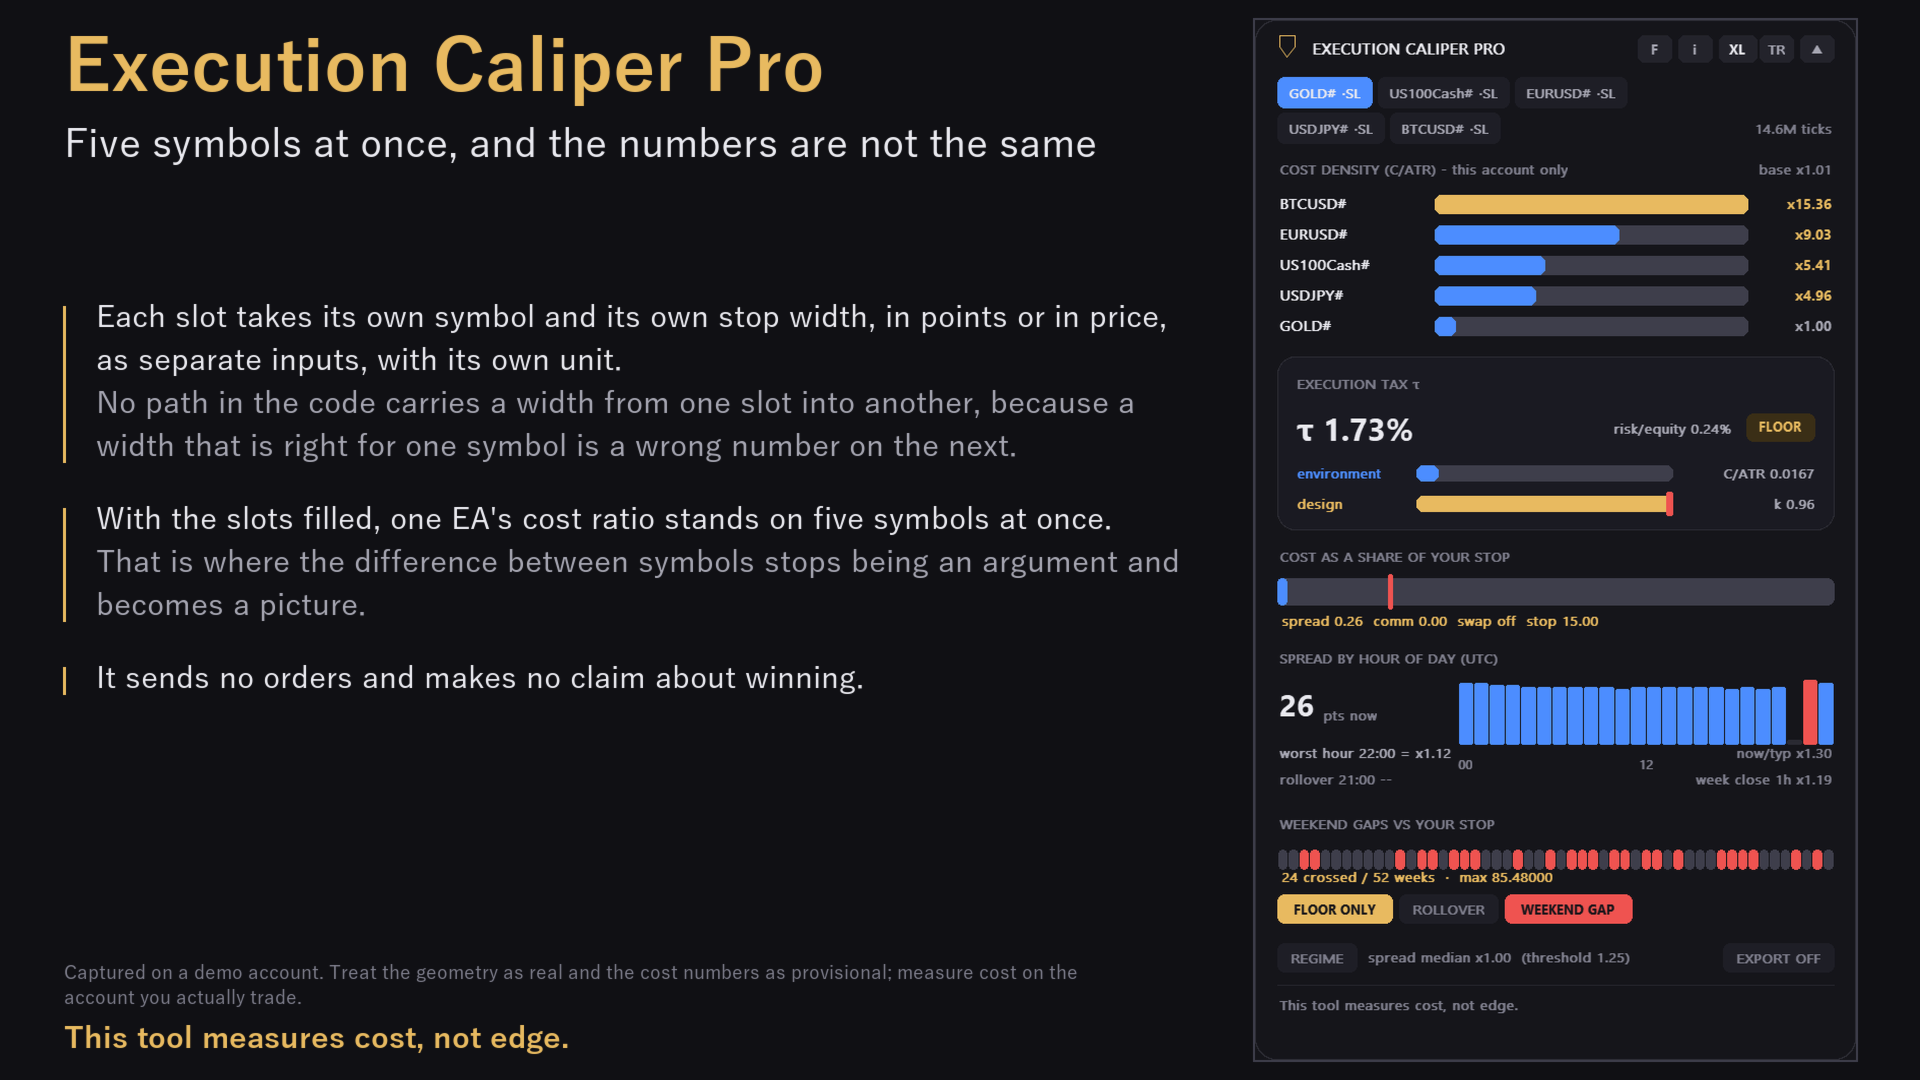
Type up to five symbols into Up to 5 symbols, comma separated ("" = chart), exactly as your broker names them, suffix included; only the first five entries of the list are read. Empty means the chart symbol alone; otherwise the chart symbol is measured only if listed. A symbol that does not exist on the account gets no tab and is named in the Experts log. Each symbol collects, saves and freezes its own baseline.
The first entry uses Symbol 1 stop unit and Symbol 1 stop distance (plus the multiple input), the second the Symbol 2 pair, and so on: the n-th entry always uses the n-th stop inputs. An entry that could not be used leaves its stop unused, the entries after it do not move up, and no symbol ever borrows another symbol's stop. Only tabs marked ·SL carry one. A symbol without a stop still ranks by cost density; its τ card reads No stop set for this symbol, the cost density above still compares without one, never borrow a stop from another symbol (for the first entry of the list it reads Set your stop distance to get τ, as in the free edition).
History forensics (the F page)
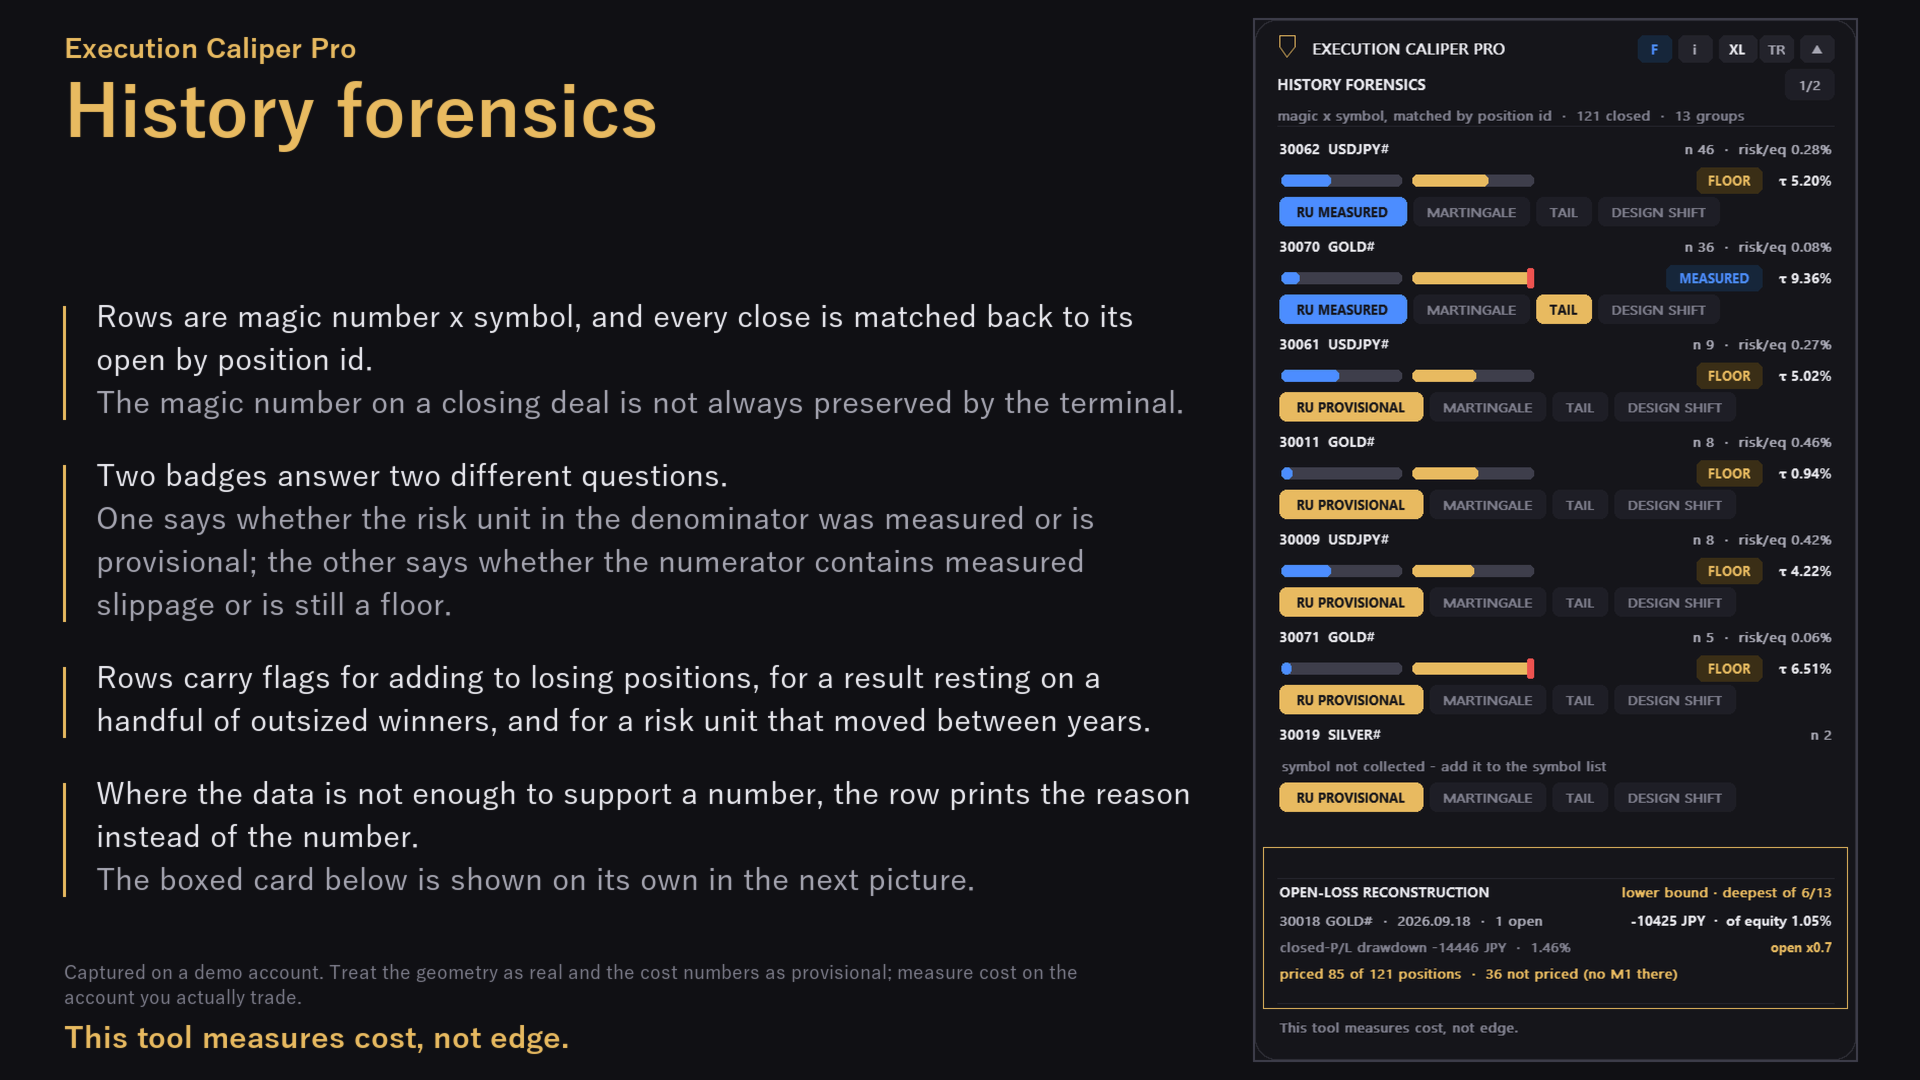
F opens HISTORY FORENSICS, which scans the account history when opened and every 60 seconds while open, over the period set by History window (days; 0 = the whole account history). Entries and exits are matched by position id, and a position belongs to the magic number of its opening deal; the closing deal's magic is never used. Each row is one magic x symbol pair, sorted by closed positions, with the count n and, when a risk unit exists, risk/eq. Reversals are skipped; partial closes and add-ons are folded into one weighted line. The scan keeps at most 20,000 positions, 32 groups and 32 symbols. Past 20,000 positions the newest are kept; past 32 groups no further row is created. Either way the line under the page heading adds how many closed positions are not shown.
The denominator of a row's τ is a risk unit read from the row itself: the median stop distance on entries (20 or more) or the p90 of losses (100 or more) gives RU MEASURED; thinner samples, or the stop typed for that symbol's slot, give RU PROVISIONAL; otherwise RU MISSING and no τ. The spread term comes from the panel's own collection of that symbol at the hours the positions were opened, so an unlisted symbol gets no τ (symbol not collected - add it to the symbol list). Commission and swap are the deals' actual amounts, converted at today's rates. Slippage is the distance between each entry's fill and its order price, in either direction; with 20 or more entries it counts as measured, and the badge reads MEASURED instead of FLOOR only when that measured slippage is above zero. The chips MARTINGALE, TAIL and DESIGN SHIFT use thresholds the About card lists as conventions. An empty page reads no closed position in this account's history.
Open-loss reconstruction
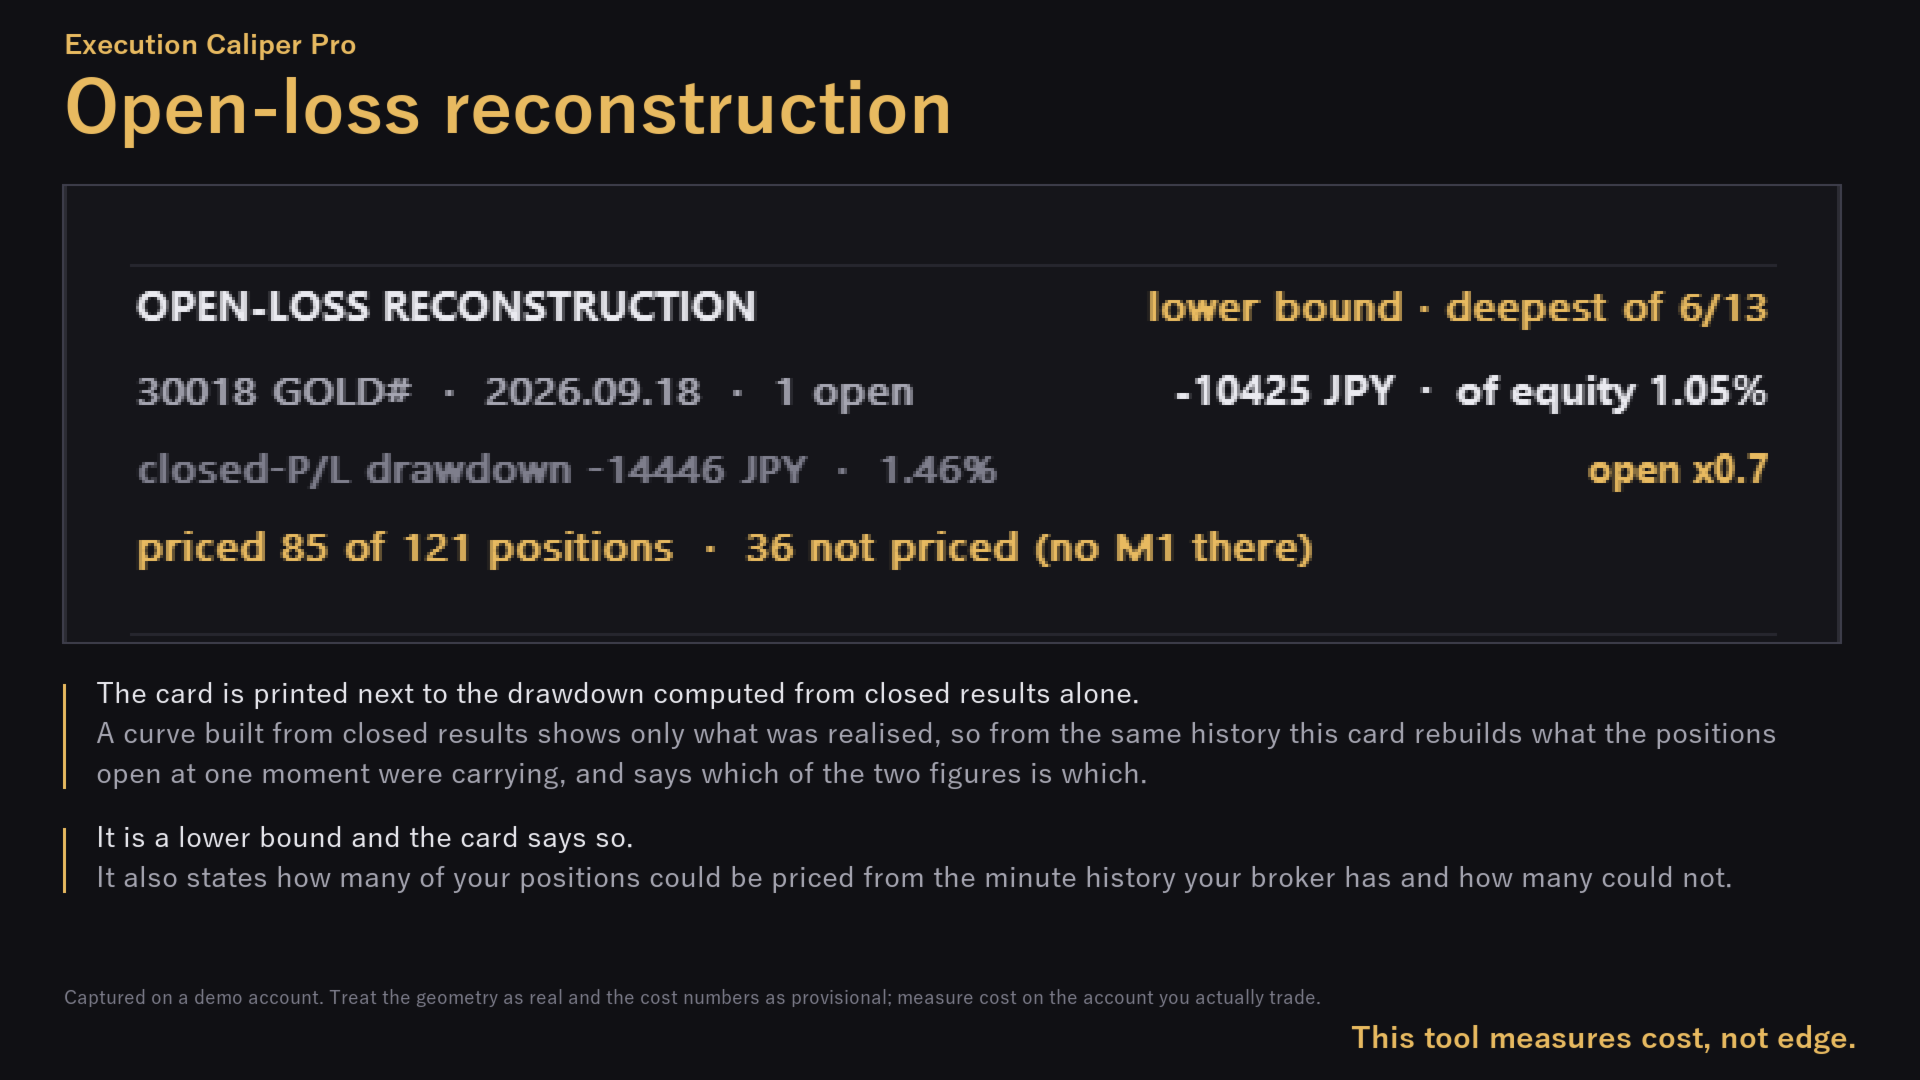
The card at the bottom of the F page, OPEN-LOSS RECONSTRUCTION, rebuilds how deep the combined floating loss of the positions open at the same time went, for one magic x symbol book, from M1 highs and lows. Only positions open for the whole M1 bar are counted, and the low and the high are totalled separately with the worse taken, so the figure is a lower bound: the true worst was at least this bad. It shows the deepest book by equity share (lower bound · deepest of the books under water), the worst amount and its share of today's equity, the same book's closed-P/L drawdown with the multiple open x between them, and how many of the account's positions could be priced. When it cannot be built it reads not measured with the reason, for example while the M1 history is still loading, when the broker's M1 history does not reach those trades, or inside the Strategy Tester.
Regime alert
The row above the footer compares now with the frozen baseline on three legs: spread median (last 30 days against the frozen median), worst hour (its multiple now against then) and weekend gap (the largest gap in 104 weeks of daily bars against then). A leg at 1.25 or more is a warning (gold), at 1.50 or more severe (red); the REGIME chip takes the highest level, and only a rise counts. Before a baseline exists the row reads no baseline yet. The alert is shown on the panel only: no pop-up, push notification, e-mail or sound.
CSV export
Off by default: nothing is written until you switch on Write the measured numbers to MQL5\Files\ExecutionCaliper. Then one file is written automatically on each start, the first time τ appears for the active symbol (with a saved collection that is right at start-up), and one more each time you click the EXPORT chip (EXPORT OFF while the input is off). Files go to the terminal's data folder under MQL5\Files\ExecutionCaliper, named after your account number, ecal_report and the server date and time, a new file each time, with the sections [SPREAD], [TAU], [DENSITY], [BASELINE], [REGIME], [FORENSICS] and [OPEN_LOSS_RECONSTRUCTION]. Nothing is written inside the Strategy Tester.
All settings
The table is generated from the shipped source of both editions, so it lists every input as the terminal shows it. The last column says which edition has it, and drop-down choices are listed as the input dialog shows them.
General
Display and behaviour of the panel itself. None of these change a measured number.
| Setting (as shown in MT5) | Default | What it does | Edition |
|---|---|---|---|
| Language / 言語 | LANG_EN | Language of the panel, the About card and the rating card. Headings, chips and the short reason texts stay in English in both settings. Choices: LANG_EN, LANG_JP | Free and Pro |
| Start corner | C_TR | Chart corner the panel snaps to on its first start: C_TL top-left, C_TR top-right, C_BR bottom-right, C_BL bottom-left. Once the chart has a saved panel state this input is ignored; use the corner button on the panel. Choices: C_TL, C_TR, C_BR, C_BL | Free and Pro |
| Panel size | SZ_M | Panel size on the first start, from SZ_S to SZ_XL. Ignored once the chart has a saved panel state; use the size button on the panel. Choices: SZ_S, SZ_M, SZ_L, SZ_XL | Free and Pro |
| Corner margin (px) | 16 | Gap in pixels between the panel and the chart corner it snaps to. | Free and Pro |
| Extra right gap for the price scale (px) | 64 | Extra pixels kept free on the right while the price scale is visible, so the panel does not cover it. Has no effect when the scale is hidden; negative values count as 0. | Free and Pro |
| Free: Rating reminder (up to 3 asks; stops when you rate or opt out) / Pro: Rating reminder (up to 2 asks; stops when you rate or opt out) | true | Shows a card asking for a rating at most three times (Pro: twice), the first after at least an hour of use (Pro: three hours). Rating, or pressing Don't ask again, ends it for good. false switches the card off; the ★ Rate button on the About card works either way. | Free and Pro |
Measurement
How much tick history is read and, in Pro, which symbols. These shape the spread distribution and the window of the typical hourly range.
| Setting (as shown in MT5) | Default | What it does | Edition |
|---|---|---|---|
| Up to 5 symbols, comma separated ("" = chart) | (empty) | Pro. Up to five symbols, comma separated, exactly as the broker names them (suffix included); only the first five entries are read. Empty = the chart symbol only; otherwise the chart symbol is measured only if listed. An entry that cannot be used is skipped and named in the Experts log, and its stop is left unused. Entry n always uses stop n. | Pro only |
| Tick-history backfill (days; 25+ for tau and baseline) | 60 | Days of tick history read backwards on the first start, and the window of H1 bars the typical hourly range is taken from. The baseline freezes only with 25 days or more, and below 20 days tau and the cost density cannot appear at all; keep the default 60. 0 or less is treated as 60. Changing it invalidates an existing baseline, which is then frozen again with the new window. | Free and Pro |
| Ticks per backfill slice | 500000 | Upper limit of ticks counted per 24-hour backfill slice. Ticks beyond it in that slice are not counted, and lowering it does not reduce the work of reading them. Leave the default. | Free and Pro |
Your EA profile (EA x SYMBOL)
The conditions of the EA you are checking. Only the stop is per symbol; the rest applies to every symbol on the panel.
| Setting (as shown in MT5) | Default | What it does | Edition |
|---|---|---|---|
| Free: Stop unit / Pro: Symbol 1 stop unit | Points | Unit of the stop distance for the chart symbol (Pro: for the first entry of the symbol list). Points = the symbol's smallest price step (10 points = 1 pip on a five-digit pair); Price distance = a price difference. Choices: Points, Price distance | Free and Pro |
| Free: Stop distance (0 = use the multiple below) / Pro: Symbol 1 stop distance (0 = use the multiple below) | 0 | Stop distance of the EA you are checking, in the unit above. 0 = use the multiple below; if that is 0 too, no stop is set and tau, the breakdown and the weekend-gap row wait for it. | Free and Pro |
| Free: ... or stop = this x typical hourly range / Pro: ... or symbol 1 stop = this x typical hourly range | 0 | Alternative to a fixed distance: stop = this multiple x the typical hourly range, re-derived every two seconds. Used only while the stop distance above is 0, and only for the first symbol. | Free and Pro |
| Nights held (swap) | 0 | Nights a typical position is held. Swap = nights x the more expensive side, counted only when that side is a cost. 0 = no swap. Also required (above 0) for the WEEKEND GAP chip to light. | Free and Pro |
| Round-trip commission/lot, account currency (0 = from history) | 0 | Round-trip commission for one lot, in your account currency. 0 = measured from your own history of the last 365 days on that symbol (needs 4 or more entry deals; otherwise unknown, counted as 0, and disclosed on the About card). Converted to price units per symbol; when that is not possible the breakdown shows n/a and the commission is left out of tau. | Free and Pro |
| Typical lot size (for the equity-ratio row) | 0 | Lot size for the risk/equity line: the loss of this many lots over the stop distance, as a share of current equity. 0 hides the line. | Free and Pro |
| Trading window start hour UTC (-1 = all hours) | -1 | First UTC hour of the trading window applied to the spread median used in tau and the cost density. -1 (any negative value) = all hours. | Free and Pro |
| Trading window end hour UTC (exclusive) | -1 | End hour of the window, not included (22 to 2 = 22, 23, 0, 1). Negative, or equal to the start, = all hours. When no sample falls inside the window, all hours are used. | Free and Pro |
PRO: stops for symbols 2-5 (never reuse another symbol's)
Pro only. The stop for the second to fifth entry of the symbol list. Entry n always uses slot n; no symbol ever borrows another symbol's stop.
| Setting (as shown in MT5) | Default | What it does | Edition |
|---|---|---|---|
| Symbol 2 stop unit | Points | Unit of the stop for entry 2 of the symbol list: Points or Price distance (a price difference). Choices: Points, Price distance | Pro only |
| Symbol 2 stop distance (0 = not set) | 0 | Stop distance for entry 2 of the list, in the unit above. 0 = no stop for that symbol (it still ranks by cost density, but shows no tau). The multiple option exists for slot 1 only. | Pro only |
| Symbol 3 stop unit | Points | Unit of the stop for entry 3 of the symbol list: Points or Price distance (a price difference). Choices: Points, Price distance | Pro only |
| Symbol 3 stop distance (0 = not set) | 0 | Stop distance for entry 3 of the list, in the unit above. 0 = no stop for that symbol (it still ranks by cost density, but shows no tau). The multiple option exists for slot 1 only. | Pro only |
| Symbol 4 stop unit | Points | Unit of the stop for entry 4 of the symbol list: Points or Price distance (a price difference). Choices: Points, Price distance | Pro only |
| Symbol 4 stop distance (0 = not set) | 0 | Stop distance for entry 4 of the list, in the unit above. 0 = no stop for that symbol (it still ranks by cost density, but shows no tau). The multiple option exists for slot 1 only. | Pro only |
| Symbol 5 stop unit | Points | Unit of the stop for entry 5 of the symbol list: Points or Price distance (a price difference). Choices: Points, Price distance | Pro only |
| Symbol 5 stop distance (0 = not set) | 0 | Stop distance for entry 5 of the list, in the unit above. 0 = no stop for that symbol (it still ranks by cost density, but shows no tau). The multiple option exists for slot 1 only. | Pro only |
PRO: history forensics
Pro only. The forensics page and the CSV export.
| Setting (as shown in MT5) | Default | What it does | Edition |
|---|---|---|---|
| History window (days; 0 = the whole account history) | 0 | Pro. How far back the forensics page reads the account history: N days from now, or 0 for the whole history. Does not affect the commission measurement, which always uses 365 days. | Pro only |
| Open the forensics page when the panel starts | false | Pro. true opens the forensics page as soon as the panel starts, instead of the main face. | Pro only |
| Write the measured numbers to MQL5\Files\ExecutionCaliper | false | Pro. false (default) writes nothing at all. true writes one CSV automatically on each start, when tau first appears for the active symbol, and one more on every click of the EXPORT chip, into MQL5\Files\ExecutionCaliper. Never inside the Strategy Tester. | Pro only |
Frequently asked questions
The τ card says τ not available yet.
Your stop is in, but another ingredient is still missing; the second line says which. collecting spread: no spread sample yet. volatility not measured: the typical hourly range could not be taken from the H1 bars. If the reason reads used bars span only N days, widen the backfill window to 25 days or more; while the H1 history is still arriving, the next attempt is five minutes away. Set your stop distance to get τ means that no stop is entered at all.
The baseline never freezes.
It needs a backfill window of 25 days or more, samples spanning the required days (30 with the default window) and an existing cost density. With a shorter window the About card's BASELINE section says it will not freeze; otherwise it shows the days in hand. Nothing freezes inside the Strategy Tester.
The commission line says unknown - counted as 0, or the breakdown shows n/a.
unknown: the input is 0 and your last 365 days hold fewer than four entry deals on this symbol, so type the round trip of one lot in your account currency. n/a: the amount could not be converted into price for this symbol and was left out, so τ is understated by that much.
ROLLOVER is lit but rollover 21:00 shows --.
The chip fires on the measured worst hour, whatever hour that is. rollover 21:00 is the fixed 21:00 UTC hour, and -- means this symbol has no quotes then.
The weekend gaps crossed my stop, but WEEKEND GAP is not lit.
The chip also needs Nights held (swap) above 0. The row shows the crossings either way.
I bought Pro and τ still says FLOOR.
The main face never includes slippage, in either edition. MEASURED appears only on forensics rows where 20 or more of your own entries carried an order price and the measured slippage is not zero. Paying does not lift the floor; measuring does.
What survives a restart?
The collection, saved when the panel is removed or the terminal closed normally (not killed); the next start fills only the gap, so the sample count does not jump (Pro shows collecting for about half a minute while it rebuilds its regime window). The baseline, written the moment it freezes. Panel position and size, per chart. Not kept: the forensics results and the selected tab.
How do I reset the measurement?
There is no reset button. A collection saved by an earlier version (free before 1.03, Pro before 1.01) can contain ticks that were counted twice on restarts; resetting once gives a clean count. Remove the panel from the chart, then delete the files named after your account and symbol under MQL5\Files\ExecutionCaliper in the terminal's data folder: the spread file holds the collection, the baseline file the frozen baseline. Do it with the panel off the chart, because the collection is rewritten on removal. If you ran the free edition 1.00 or 1.01, the same files may also sit in the older folder MQL5\Files\BFG; delete them there too, or the next start reads them again. Changing the backfill days also invalidates the baseline; it is frozen again with the new window and overwrites the old file.
Start corner and Panel size are ignored, or the panel no longer snaps.
Those inputs apply only while the chart has no saved panel state; afterwards use the corner and size buttons. A panel dragged by hand stops snapping until you press the corner button.
Pro: a listed symbol has no tab, or its stop went to another symbol.
The name must match the account's symbol list exactly, suffix included; a skipped symbol is named in the Experts log. Only the first five entries are read. Stops follow list position, nothing moves up when an entry is skipped, and a tab with a stop shows ·SL.
What this meter does not do, and where it stops
- It does not trade, predict or advise. It has no order function, no DLL, no web request and no notification. On the terminal it only adds listed symbols to Market Watch, turns on mouse-move events for its chart, writes under MQL5\Files\ExecutionCaliper, keeps its panel position in global variables, and keeps the rating reminder's state in a small file in the terminals' shared Common\Files folder.
- τ on the main face is a floor: slippage enters only on Pro forensics rows where it was measured from your own fills.
- The 20% line, the 2.0x and one-crossing chips, the 1.25 and 1.50 regime levels and the forensics chips are conventions; only the ratios and counts are measured. τ is neither necessary nor sufficient for an EA to survive.
- Comparisons stay inside your account; the panel never ranks you against other traders or brokers. Costs measured on a demo account are provisional.
- Swap: the triple-swap day is not added, and swap modes that cannot be converted into price are shown as n/a and counted as 0, so τ is then understated. The same holds for an unconvertible commission.
- Historical ticks are placed into UTC hours with the server offset measured now (rounded to the hour, re-measured every six hours); if the offset changed inside the window, older ticks land one hour off. The worst hour has no minimum sample count; check n in the hover. Live collection samples the latest quote on each tick of the chart symbol and once per second, not every tick of every symbol.
- The typed stop is nominal. The open-loss reconstruction is a lower bound on one magic x symbol book, and its equity share is against today's equity.
- Run one panel per account and symbol; two charts measuring the same symbol on the same account write the same files.
- In the Strategy Tester the spread rows are filled with synthetic data (synthetic (tester)); nothing is saved, no baseline freezes, no CSV is written and no open-loss reconstruction is built.
Support
Post on the Comments tab of the product page (free edition, Pro). Symbol, timeframe and what you saw on the panel is enough to start; if the τ card or a forensics row shows a reason line, quote it.
This guide describes Execution Caliper 1.03 (free) and Execution Caliper Pro 1.01.