Vortex Confluence Radar
- Indicators
-
Syarief Azman Bin Rosli
 Hello and welcome to my official MQL5 profile!
I am Syarief Azman Bin Rosli, an algorithmic trading systems developer and quantitative software engineer with over a decade of specialized experience creating robust automated trading solutions for MetaTrader 5 and MetaTrader 4. - Version: 1.0
- Activations: 5
Vortex Confluence Radar is a multi-oscillator confluence scoring engine developed natively for MetaTrader 4. It fuses three distinct technical oscillators—Relative Vigor Index (RVI), Commodity Channel Index (CCI), and Williams % Percent Range (WPR)—into a unified momentum histogram with a smoothed signal line and automated crossover alert signals.
Understanding the Indicator Architecture
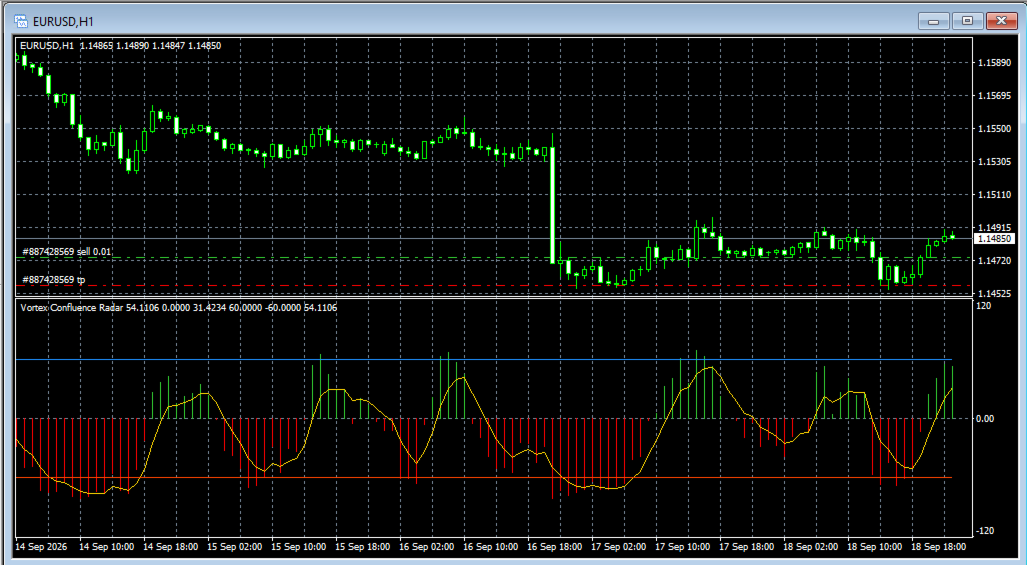
The indicator operates in a separate sub-window and renders several distinct visual components:
- Unified Confluence Histogram
- Normalized Scoring: RVI, CCI, and Williams %R values are individually normalized to a standard [-100, +100] scale and aggregated via a user-defined weighted average.
- Bullish Momentum (Lime Green Bars): Indicates positive aggregate momentum where the confluence score is greater than zero.
- Bearish Momentum (Red Bars): Indicates negative aggregate momentum where the confluence score is less than zero.
- Smoothed Signal Line (Gold Line)
- An Exponential Moving Average (EMA) applied directly to the confluence score series.
- Provides precise crossover timing and filters out high-frequency noise from raw oscillator movements.
- Threshold Boundary Levels (Dodger Blue and Orange Red Lines)
- Overbought Level (Default +60.0): Marks elevated bullish saturation territory.
- Oversold Level (Default -60.0): Marks depressed bearish exhaustion territory.
- On-Chart Signal Arrows
- Bullish Reversal Arrow: Rendered below the price bar when the confluence score crosses above the signal line from the oversold zone (below -60.0).
- Bearish Reversal Arrow: Rendered above the price bar when the confluence score crosses below the signal line from the overbought zone (above +60.0).
Operational & Performance Architecture
- Differential OnCalculate Loop: Implements efficient incremental bar calculation ( rates_total - prev_calculated ). The indicator only processes newly completed or active bars, avoiding redundant chart recalculations on incoming ticks.
- Pure Native MQL4 Code: Zero external DLL dependencies ( #property strict ), fully compatible with the MQL5 Market automated validation system and Strategy Tester.
- Resource Cleanliness: Dedicated object cleanup routines in OnDeinit() remove all chart arrow objects using a clean prefix ( VCR_ ).
- Flexible Alert System: Real-time native terminal popups, audible sound alerts, and notifications triggered immediately upon confirmed bar close signal events.
Recommended Chart Setup
- Instruments: Major currency pairs (EURUSD, GBPUSD, USDJPY), cross pairs, equity indices, and commodities (XAUUSD, US30).
- Timeframes: M5, M15, M30, H1, and H4.
- Strategy Application: Ideal for trend confirmation, momentum divergence detection, exhaustion reversals, and multi-indicator confluence filtering.
Input Parameters
Oscillator Settings
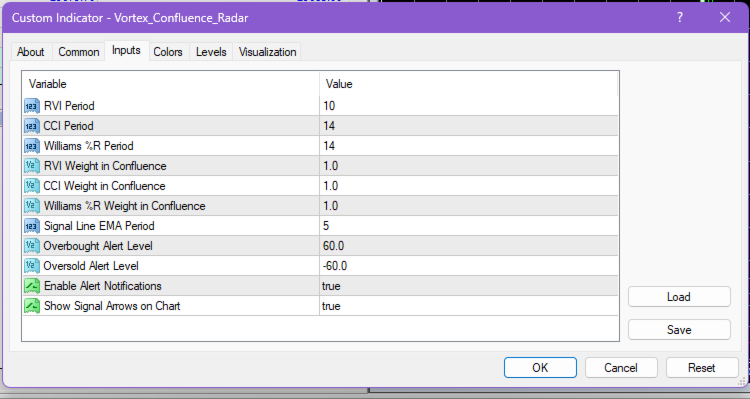
- RVI Period: Lookback period for Relative Vigor Index calculation (Default: 10).
- CCI Period: Lookback period for Commodity Channel Index calculation (Default: 14).
- Williams %R Period: Lookback period for Williams Percent Range calculation (Default: 14).
Confluence Weightings
- RVI Weight in Confluence: Relative weighting multiplier for RVI (Default: 1.0).
- CCI Weight in Confluence: Relative weighting multiplier for CCI (Default: 1.0).
- Williams %R Weight in Confluence: Relative weighting multiplier for Williams %R (Default: 1.0).
Signal Line & Threshold Levels
- Signal Line EMA Period: Averaging period for the exponential signal line (Default: 5).
- Overbought Alert Level: Upper saturation threshold level (Default: 60.0).
- Oversold Alert Level: Lower saturation threshold level (Default: -60.0).
Notifications & Chart Graphics
- Enable Alert Notifications: Enables native terminal popups and sound alerts (Default: true).
- Show Signal Arrows on Chart: Enables rendering of directional buy/sell arrows on the price chart (Default: true).
Risk Disclaimer
Technical indicators are analytical instruments intended for market analysis and trade timing. They do not generate guaranteed trading results or constitute financial advice. Past performance of oscillator patterns does not guarantee future market behavior. Always combine confluence signals with rigorous risk management and capital preservation practices.