Counterpoint Divergence Matrix
- Indicators
-
Syarief Azman Bin Rosli
 Hello and welcome to my official MQL5 profile!
I am Syarief Azman Bin Rosli, an algorithmic trading systems developer and quantitative software engineer with over a decade of specialized experience creating robust automated trading solutions for MetaTrader 5 and MetaTrader 4. - Version: 1.0
- Activations: 5
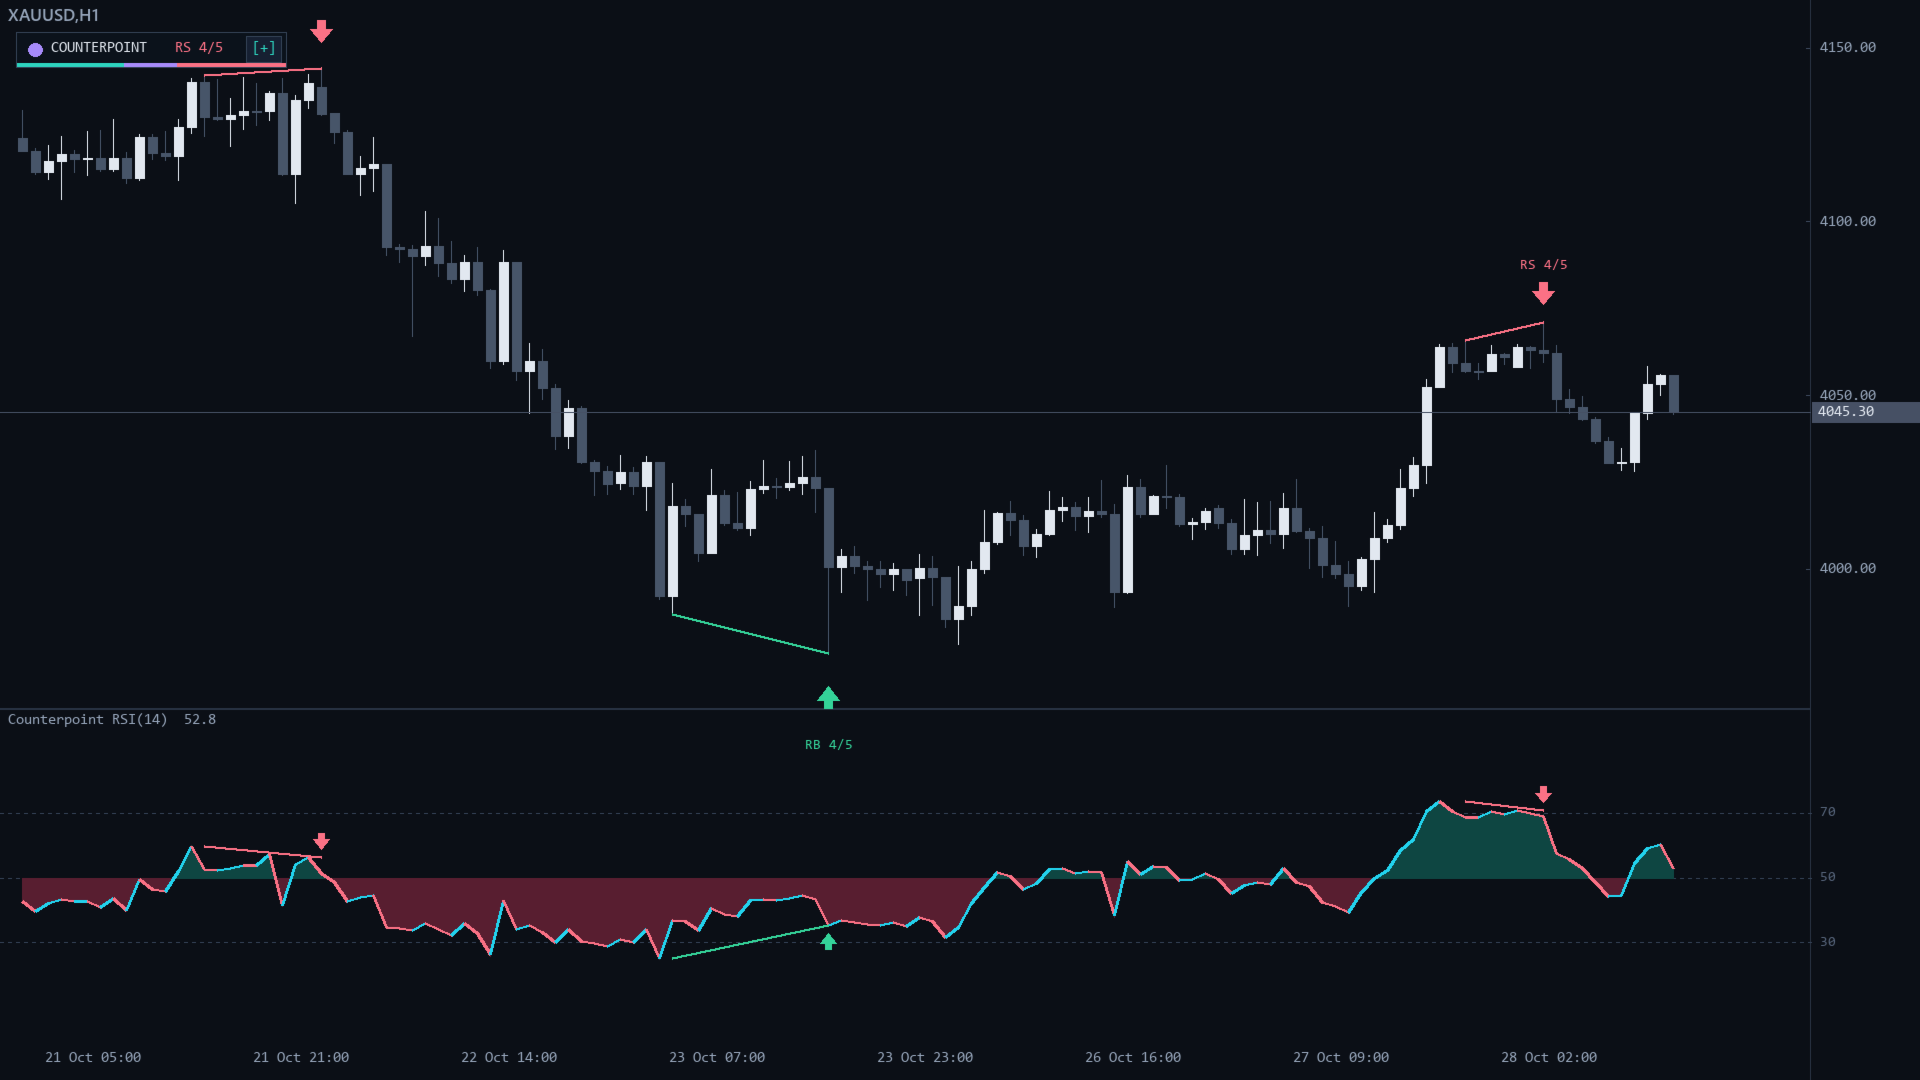
Counterpoint Divergence Matrix is a MetaTrader 5 indicator that finds divergence between price swings and momentum. It marks regular divergence (price makes a new extreme, the oscillator does not) and hidden divergence (the reverse), keeps only clean ones with a line-of-sight check, and scores each signal by how many of five oscillators agree: RSI, MACD, Stochastic, CCI and Momentum. Signals appear once the newest swing is confirmed and never repaint. It does not trade.
Quick Start
- Attach it to any chart. It opens in its own subwindow and draws on the price chart too.
- Keep the defaults first: Primary Oscillator = RSI, Divergence Types = Regular and hidden, Min Confluence = 3.
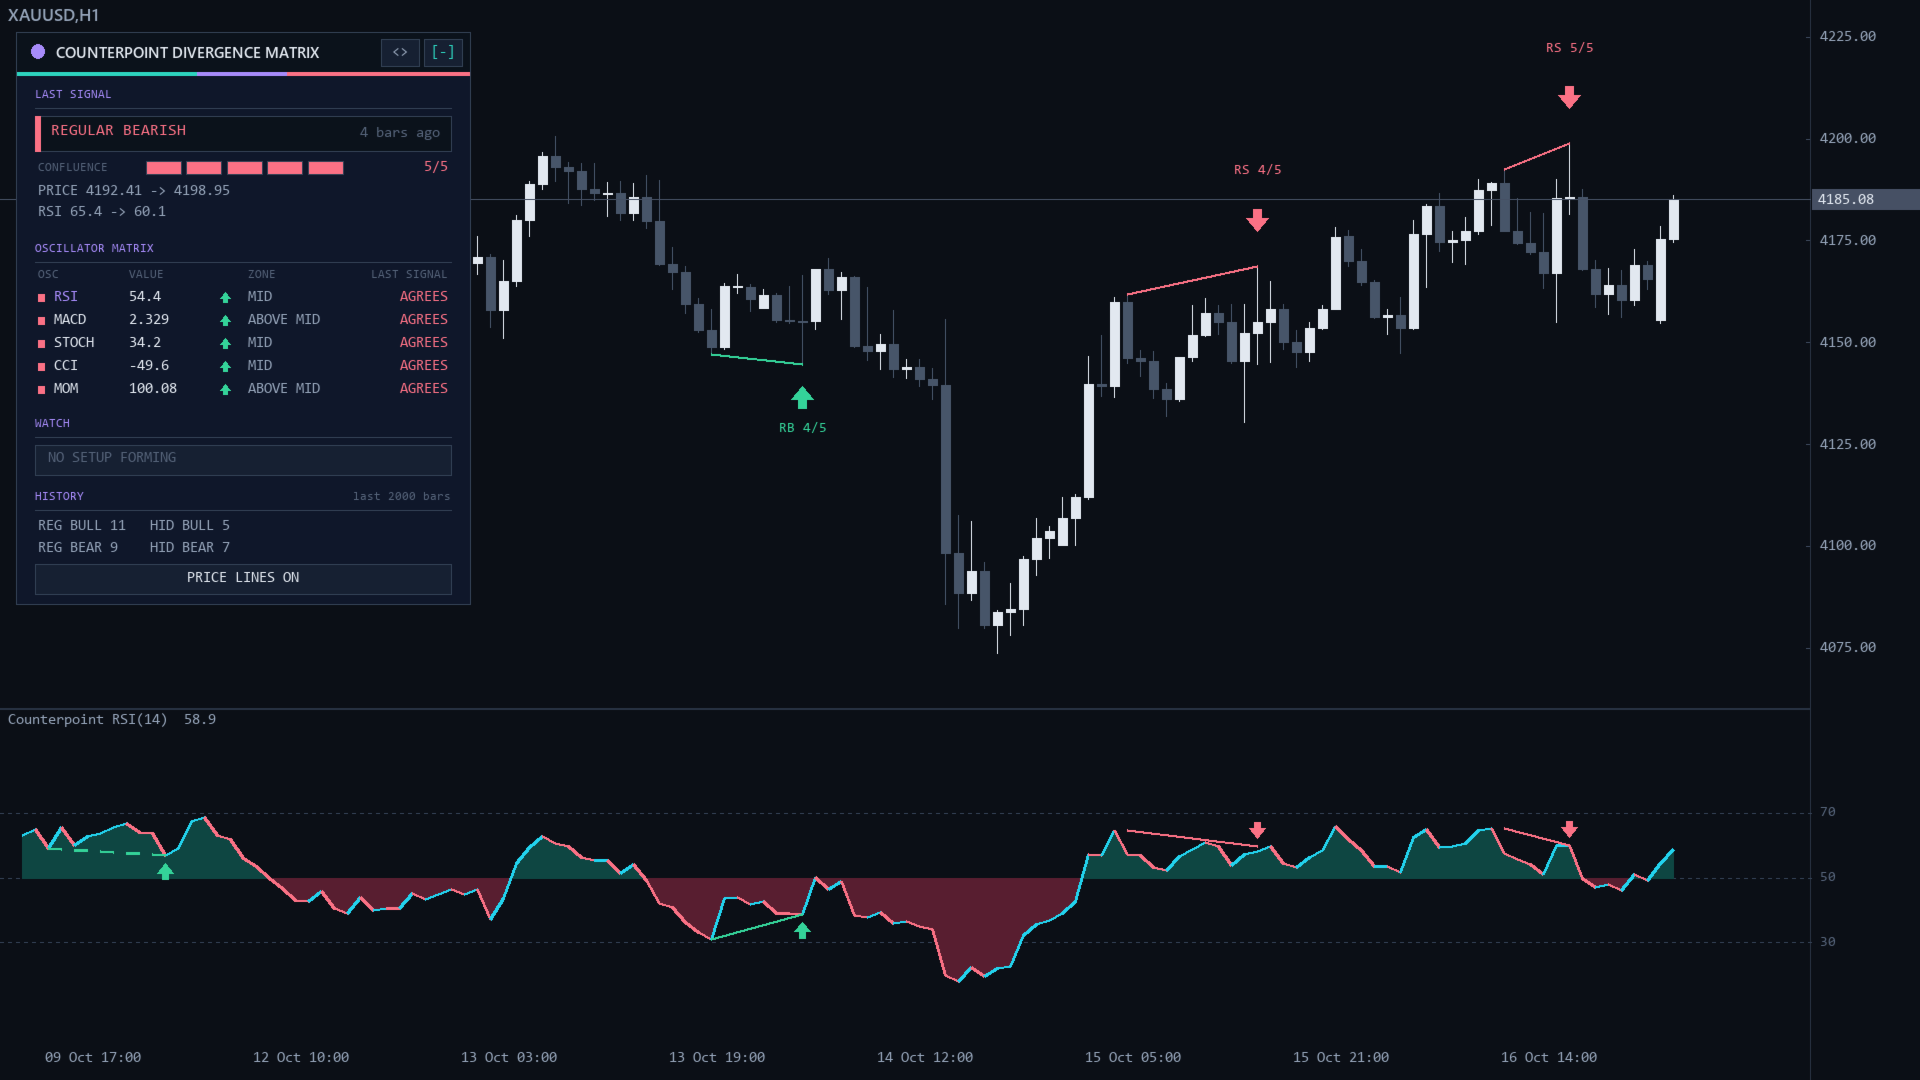
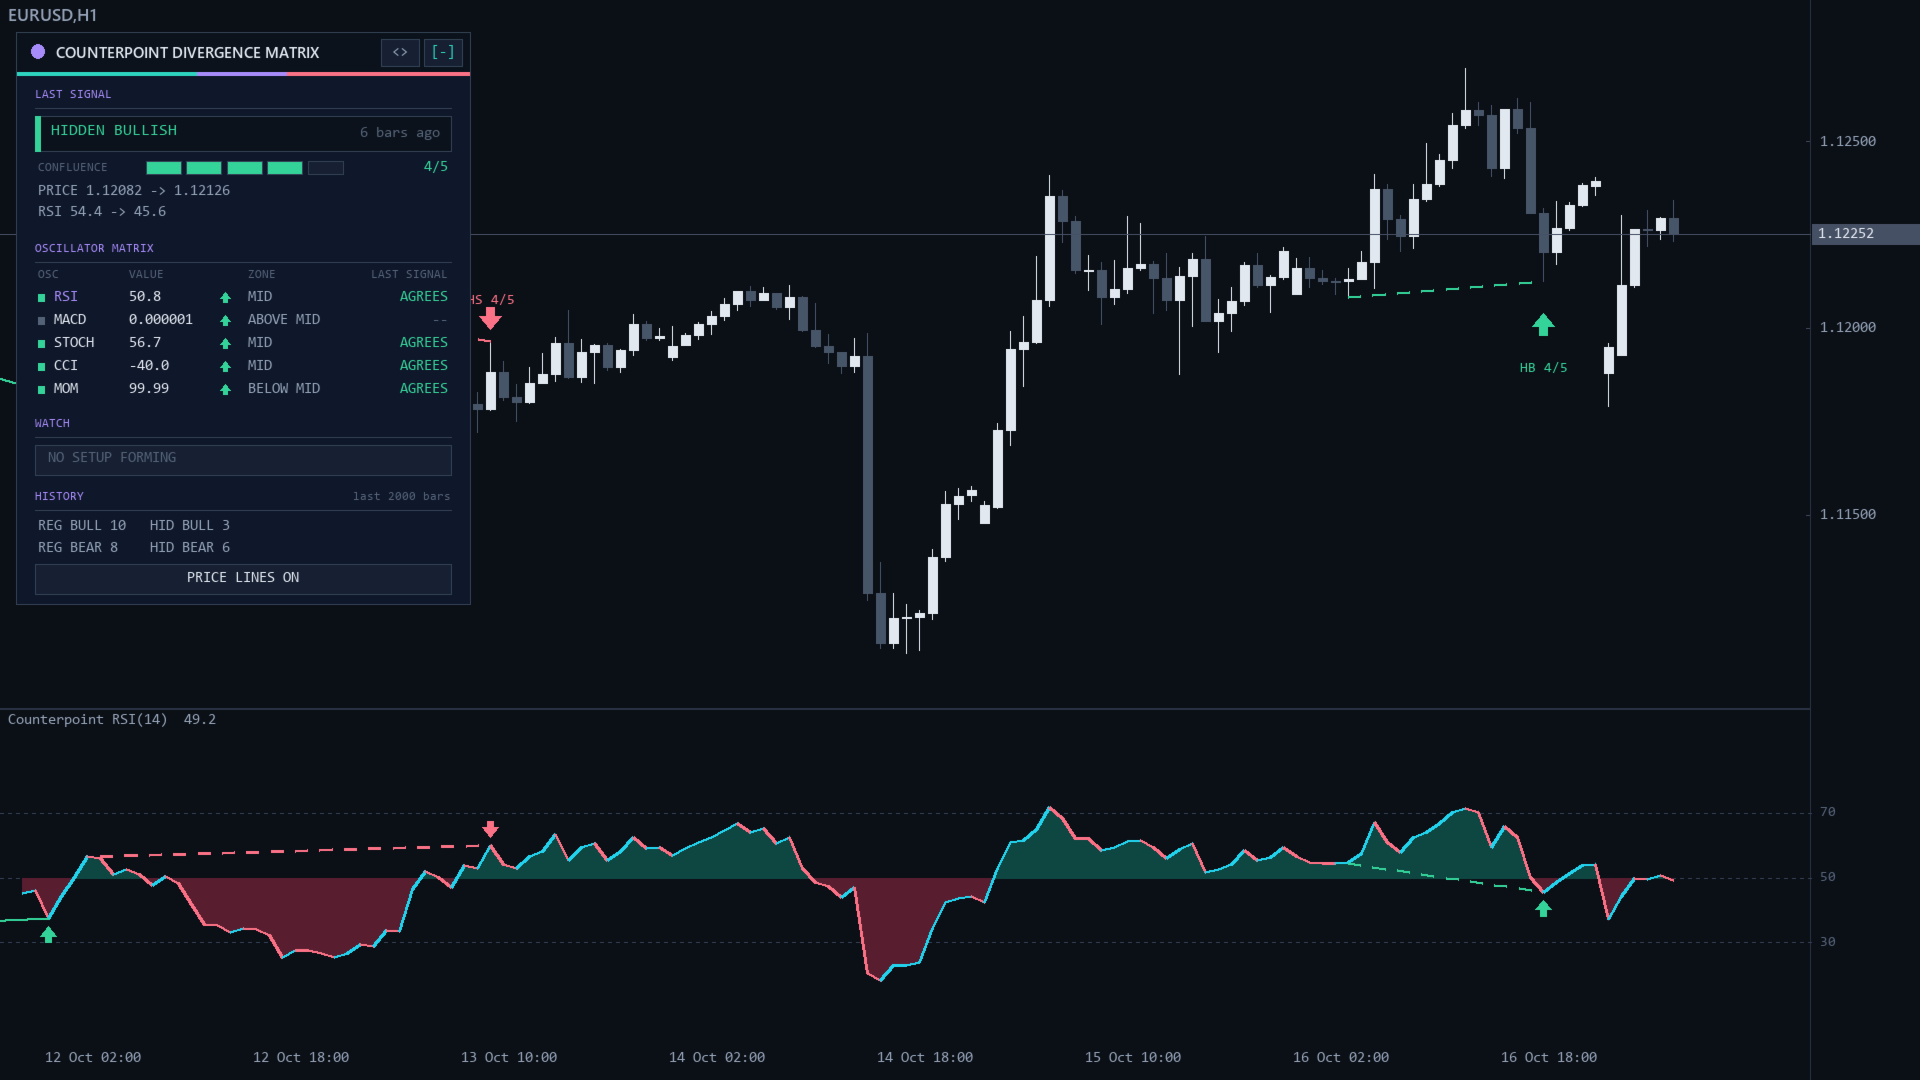
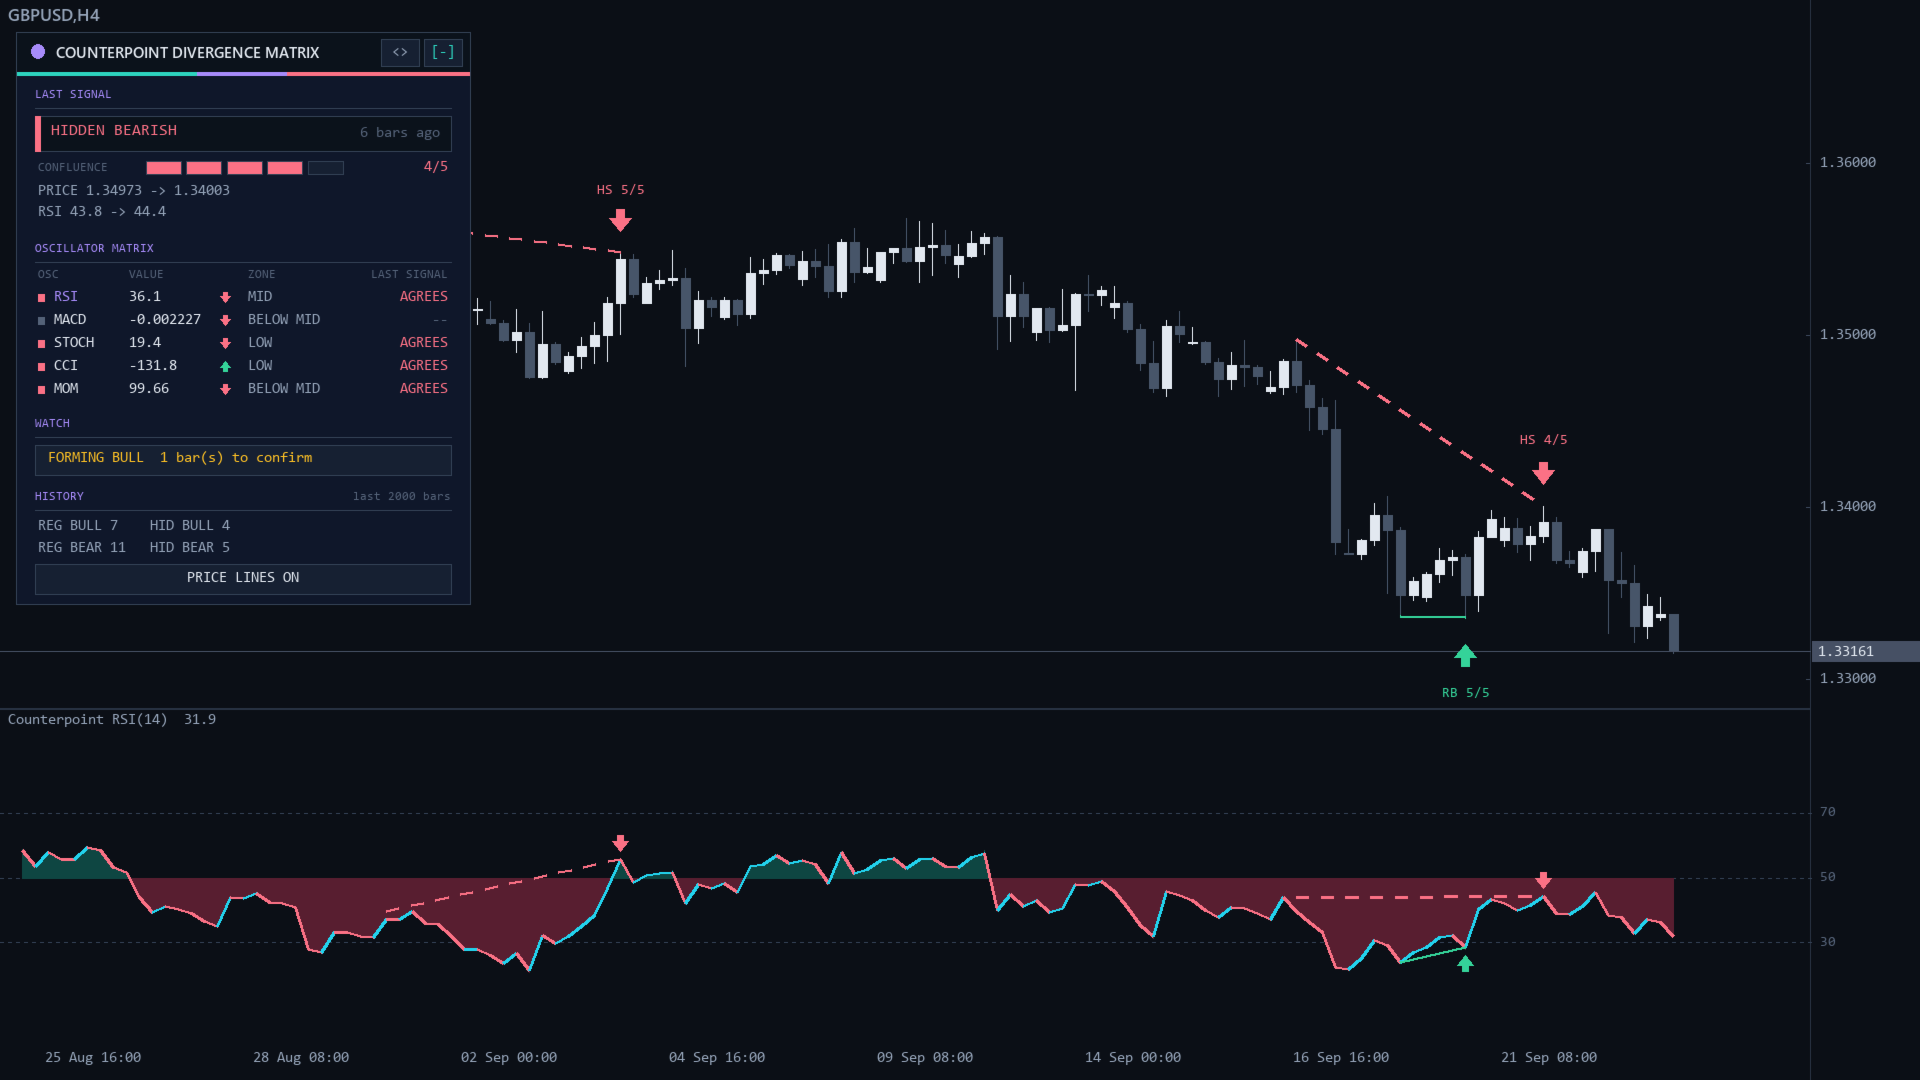
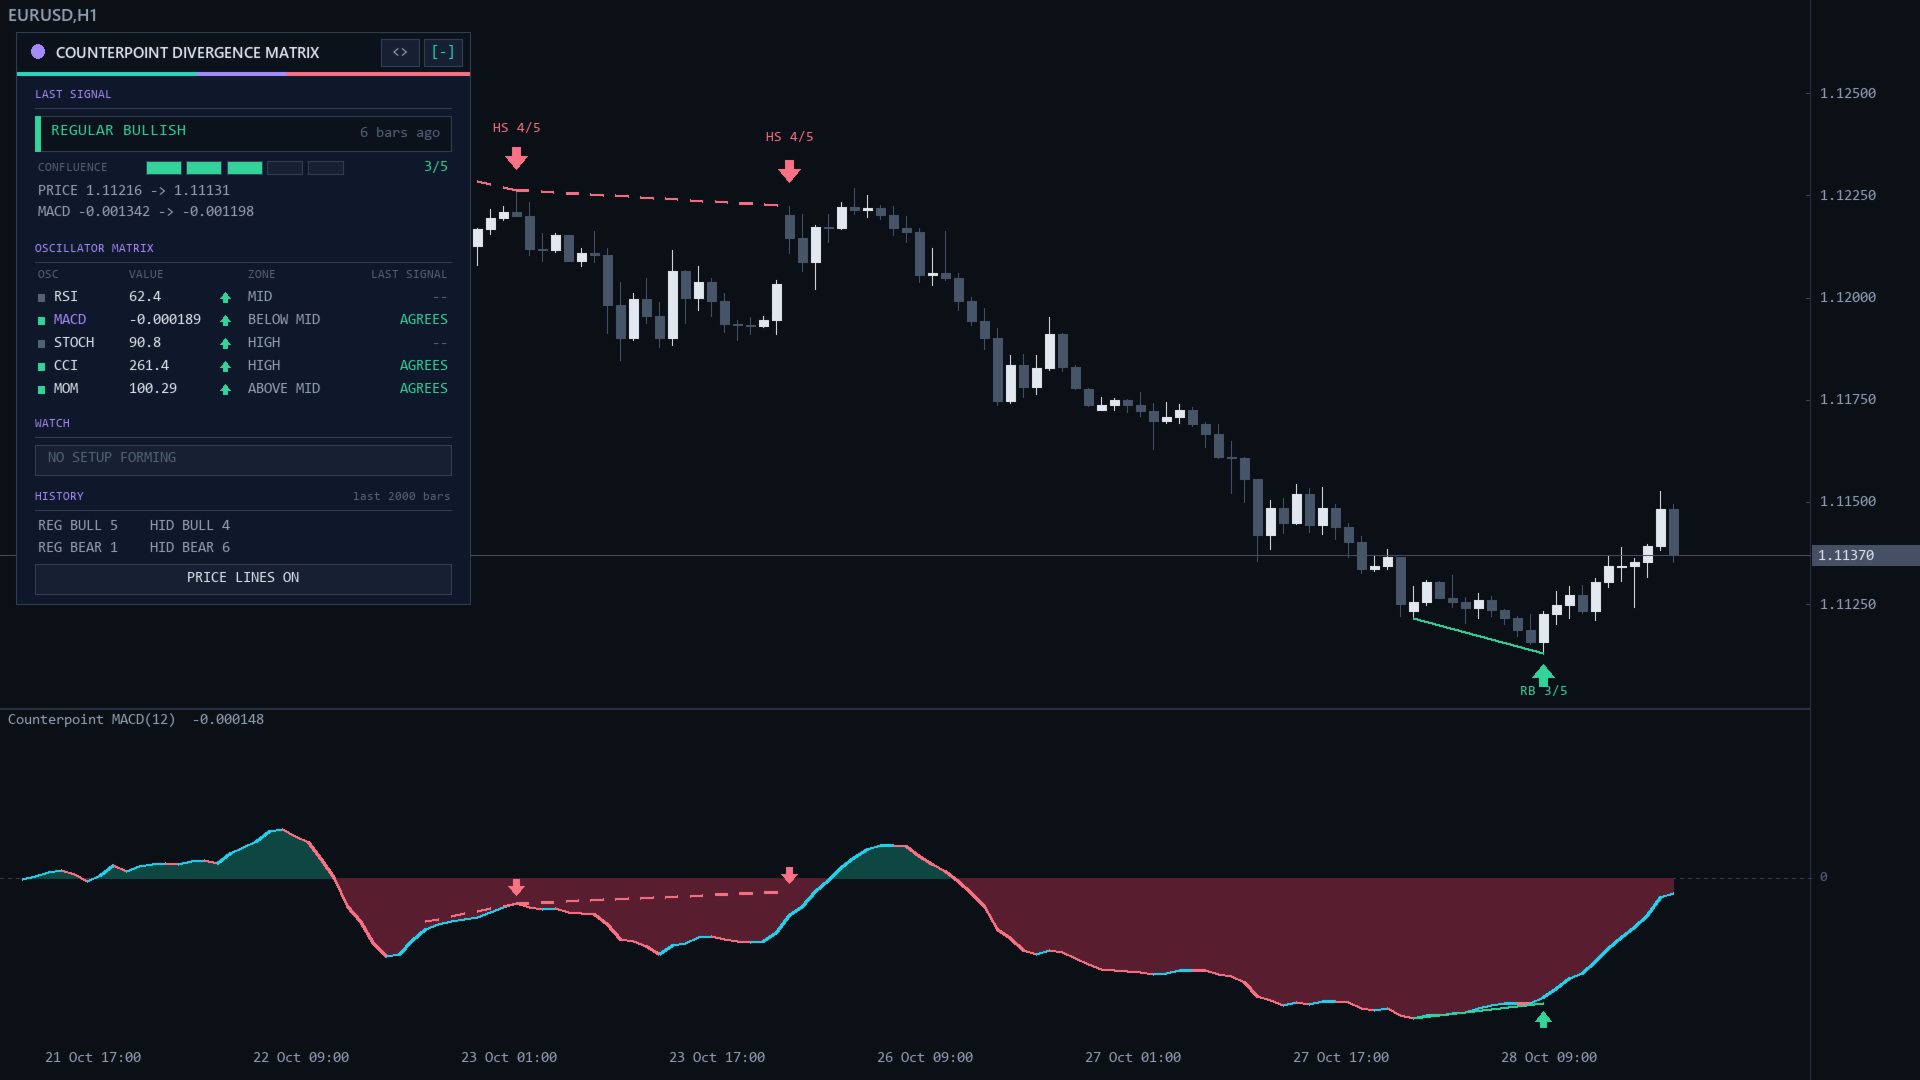
- Each divergence appears as a line between two swings in both windows, an arrow and a label such as RB 4/5 on the price chart.
- Quick check: a visual Strategy Tester run on EURUSD H1 over a month shows the signals appear bar by bar.
- For phone alerts set your MetaQuotes ID under Tools > Options > Notifications and Push Notification = true.
How It Finds Divergence
Swings: a swing low (high) is a bar whose low (high) is beyond the Pivot Left Bars bars before it and not beyond the Pivot Right Bars bars after it. A swing is confirmed once those right-hand bars have closed, so every signal arrives Pivot Right Bars bars after the swing.
Pairing: each new swing is compared with the most recent earlier swing of the same side that is at least Min Bars Between Pivots and at most Max Bars Between Pivots bars back. The oscillator value of a swing is its lowest (or highest) value within Oscillator Pivot Tolerance bars of the swing.
Types (price swing vs oscillator):
- REGULAR BULLISH: lower low in price, higher low in the oscillator.
- HIDDEN BULLISH: higher low in price, lower low in the oscillator.
- REGULAR BEARISH: higher high in price, lower high in the oscillator.
- HIDDEN BEARISH: lower high in price, higher high in the oscillator.
Filters:
- Divergence Types limits the output to Regular only or Hidden only.
- Regular Divergence on Extreme Side Only: a regular bullish divergence needs the older oscillator low below the midline (50 for RSI and Stochastic, 0 for MACD and CCI, 100 for Momentum), a regular bearish one the older high above it.
- Line-of-Sight Check: between the two swings neither the oscillator nor price may cross the straight line joining them. This removes about a third of raw divergences.
- Confluence: the same pair of swings is tested on all five oscillators. The score is how many show the same divergence (1-5). Signals below Min Confluence are not shown.
Repainting: only closed bars are used. Once a signal appears it never changes or disappears. Markers sit on the newer swing bar; the Signal Code and Confluence buffers are written on the confirmation bar.
Divergence describes momentum, not direction. In tests on two years of EURUSD, GBPUSD and XAUUSD H1, price moved one ATR in the signal's direction before one ATR against it in about half of the cases. Use it with trend, levels and risk management, never alone.
Card Controls
The Matrix card sits on the price chart.
- [-] / [+]: collapse the card into a pill (COUNTERPOINT plus the last signal, or WAITING) or expand it.
- <>: move the card to the next chart corner.
- PRICE LINES ON / PRICE LINES OFF: show or hide the lines, arrows and labels on the price chart. Subwindow lines stay.
Collapse, corner and price lines return to the inputs when the indicator is re-attached or the timeframe changes.
Readouts
Subwindow: the primary oscillator as a line (cyan while rising, coral while falling) filled against its midline (teal above, dark red below), dotted levels (30/50/70 RSI, 20/50/80 Stochastic, -100/0/100 CCI, 0 MACD, 100 Momentum), divergence lines (solid regular, dashed hidden) and arrows: up below a bullish swing, down above a bearish one.
Price chart: the same lines between the two price swings, an arrow 0.6 ATR beyond the newer swing and a label: RB, HB, RS or HS plus the confluence, e.g. RS 5/5. Hover for the full name. Only the newest Max Divergences Drawn signals are kept.
Card modules:
- LAST SIGNAL: NO SIGNAL YET, REGULAR BULLISH, HIDDEN BULLISH, REGULAR BEARISH or HIDDEN BEARISH, bars ago, CONFLUENCE meter (n/5), PRICE older -> newer swing and the oscillator values.
- OSCILLATOR MATRIX: each of RSI, MACD, STOCH, CCI and MOM (primary in violet) with its value, a green up or red down arrow, the zone (HIGH, LOW or MID for RSI, Stochastic and CCI; ABOVE MID or BELOW MID for MACD and Momentum) and AGREES or -- for the last signal.
- WATCH: NO SETUP FORMING, or FORMING BULL / FORMING BEAR with bar(s) to confirm when a regular divergence is waiting for its right-hand bars. This is a heads-up only and may vanish.
- HISTORY: REG BULL, HID BULL, REG BEAR and HID BEAR counts over the last History Bars to Scan bars.
Buffers for EAs (iCustom)
0 Counterpoint Fill (oscillator), 1 Counterpoint Midline, 2 Counterpoint Oscillator, 3 line colour index (0 rising, 1 falling), 4 Bullish Divergence (oscillator value at the swing, EMPTY_VALUE otherwise), 5 Bearish Divergence, 6 Signal Code (+1 regular bullish, +2 hidden bullish, -1 regular bearish, -2 hidden bearish, 0 none), 7 Confluence (1-5, 0 none). Read 6 and 7 on closed bars:
int h = iCustom(_Symbol, _Period, "Market\\Counterpoint Divergence Matrix");
double code[1], conf[1];
if(CopyBuffer(h, 6, 1, 1, code) == 1 && CopyBuffer(h, 7, 1, 1, conf) == 1 && code[0] != 0)
   Print("divergence ", code[0], " confluence ", conf[0]);
Alerts
When a signal confirms on the newest closed bar: Pop-up Alert, Sound Alert, Push Notification and Email Alert, each optional, with text like "Counterpoint: REGULAR BULLISH divergence on EURUSD H1 (confluence 4/5)". Signals found in history when the indicator loads do not alert.
Side Effects
Chart objects prefixed CPD_P_ (card) and CPD_S_ (divergence drawings), removed with the indicator. No files, no global variables, no DLLs.
Input Parameters
Oscillators
- Primary Oscillator (RSI): RSI, MACD main line, Stochastic %K, CCI or Momentum; plotted and used for detection.
- RSI Period (14), MACD Fast EMA (12), MACD Slow EMA (26, above fast), MACD Signal Period (9).
- Stochastic %K Period (14), Stochastic %D Period (3), Stochastic Slowing (3).
- CCI Period (20), Momentum Period (10).
Swings and Divergence Rules
- Pivot Left Bars (5) and Pivot Right Bars (3): swing strength; right bars are the confirmation delay.
- Min Bars Between Pivots (5) and Max Bars Between Pivots (60).
- Oscillator Pivot Tolerance (2): bars around a swing searched for the oscillator extreme (max = right bars).
- Divergence Types (Regular and hidden): Regular and hidden, Regular only, Hidden only.
- Line-of-Sight Check (true), Regular Divergence on Extreme Side Only (true).
- Min Confluence (3): 1-5.
Drawing
- ATR Period (14): spacing of arrows and labels.
- History Bars to Scan (2000), Max Divergences Drawn (60).
- Draw Lines on Price Chart (true), Bullish Color, Bearish Color.
Matrix Card and Alerts
- Show Matrix Card (true), Start Collapsed (false), Card Scale (1.0, 0.5-2.5).
- Pop-up Alert (true), Sound Alert (false), Push Notification (false), Email Alert (false).
Typical Setups
- Reversal watch on H1/H4: Divergence Types = Regular only, Min Confluence = 4.
- Trend continuation: Divergence Types = Hidden only, Pivot Left Bars 8, Max Bars Between Pivots 40, used with your trend filter.
- Faster M5/M15: Pivot Left Bars 3, Pivot Right Bars 2, Min Confluence 4.
- MACD trader: Primary Oscillator = MACD main line, Oscillator Pivot Tolerance 3.
Notes
- Signals are delayed by Pivot Right Bars bars by design; that delay is what makes them final.
- Works on any symbol and timeframe, in the Strategy Tester and with iCustom.
- No profit guarantee; test on a demo account first.
Risk Disclaimer
Trading forex and CFDs on margin carries a high risk of loss. Past or simulated results do not guarantee future results. This indicator does not trade and does not promise profit.