Nadaraya Watson Envelope Scanner MT4

  • Indicators
  • Evgenii Sutulov
    Evgenii Sutulov
    I build trading indicators, strategies, and dashboards that don't repaint.
    Seven years doing this. MetaTrader 4, MetaTrader 5, TradingView.
    Closed bars only. What you see is what happened.
    The bar being formed never changes a published value.
  • Version: 1.3
  • Activations: 20

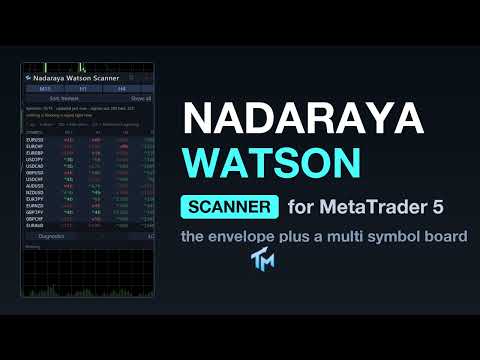
Mean reversion is a numbers game, and the numbers live on more charts than you can watch. Nadaraya Watson Envelope Scanner runs a causal, non-repainting kernel regression envelope across your symbol list on up to four timeframes at once, prints every re-entry with its age, and marks the rows where the timeframes agree. Out of the box it scans fifteen pairs; one setting raises that to twenty-eight. The envelope itself draws on the chart in front of you, so you act on what the table found without attaching a second indicator.

The price increases by $10 every 10 purchases.

The chart half is Nadaraya Watson Envelope itself: a causal Nadaraya-Watson kernel regression centre line, an envelope built from the mean absolute error around it, and marks where price came back inside the envelope after having traded outside it. The board half runs the same calculation over the list and puts the answer in a table: the board tells you where to look, and the chart under it shows you what is actually there.

The board

A row per symbol, a column per scanned timeframe, up to four of them, on up to twenty-eight symbols; fifteen are scanned out of the box and the maximum is one setting away. The symbol list is comma separated, or the board can take the Market Watch list instead. Broker prefix and suffix are detected from the chart you are on, or given by hand. Out of the box the board scans four: M15, H1, H4 and D1.

A cell reads like ^14b: a direction glyph, then how many bars ago that signal happened. The word flat means the calculation ran and found no direction there. Three dots mean the cell has not been measured yet, and with tooltips switched on, hovering it says why in words. A cell whose signal is older than the freshness threshold is drawn in the same colour, quieter, so the hue says which way and the weight says how much it still matters. A row with a fresh signal anywhere in it gets a wash of the accent colour so your eye lands on it before you have read a single cell.

The AGREE column is the point of the board. It takes the visible timeframe columns for that symbol, finds the majority side, and prints it as v3/4: the direction the majority agrees on, and how many of the visible timeframes stand on it. A row where every visible timeframe agrees is drawn bold and in that side's colour, because that is the row the board exists to surface. A tie prints a dash and counts as no verdict, because calling a one-one split a signal would be the board inventing conviction it does not have. With only one timeframe visible the column is dropped entirely, header and all, rather than showing a 1/1 that restates the cell beside it.

Every column header is a button. Click a timeframe header and the board sorts by that column, the freshest signal on that timeframe first, and rows with none in it go to the bottom together. Click the same header again to reverse. Click AGREE to sort by agreement, with full agreement first and a full house outranking a partial one of the same count. The active column is drawn in the accent colour with a caret showing the direction, so the sort state is on the header itself. There is also a Sort button that cycles freshest, grade and name, for when you want a whole-board order rather than a column order.

A Show button cycles all, buys, sells and fresh. Buys and sells follow the AGREE verdict rather than any single cell, so a row you see under buys always reads an up glyph in AGREE. A tie shows under neither. This filters the view, not the calculation: a hidden row is still being measured and can still alert.

The legend sits above the table and decodes the notation in one line: up glyph, down glyph, bars since, and what the AGREE fraction means. It can be switched off once you know it by heart.

Timeframe buttons at the top show and hide a column. Hiding one does not stop the calculation measuring it.

The row count is fitted to the height of the chart pane, and the row setting is a maximum rather than a demand. When everything fits, no page buttons are drawn at all. When it does not, previous and next buttons appear with the page number on them. Because the board never draws more rows than the pane holds, the page buttons are always on screen and always reachable, however tall the row setting is.

Clicking a cell switches this chart to that symbol and that timeframe. It does not open a window per click.

Two status lines are always on show: how many symbols are ready of how many, how long ago the board last updated, and how many signals it found in the lookback window, then either the watchdog's own line or a sentence explaining why nothing is showing.

Diagnostics

A second panel, off by default, that answers "why is there no signal". It lists the symbol coverage, which series are short of bars and by how much, how many signals were found in the window, and how many symbols this indicator switched on in Market Watch to do its job. It names the stage a cell failed at rather than leaving the cell blank without explanation.

The chart indicator

Drawn in the price window: the centre line coloured by its slope, the upper and lower envelope, and BUY and SELL marks. It can be turned off from the Styles tab if you only want the board. Its timeframe is set separately from the board's timeframes: the board scans several, the chart draws one.

The settings sheet

The gear opens three tabs. Values holds the timeframe, the window N, the bandwidth h and the envelope multiplier, each with steppers, a range and a sentence of help. Changing one here recalculates the whole board and the panel says so while it works, with a count of how many symbols it has redone.

Alerts holds the master switch, the per-event switches, the channels, the cooldown and a test button.

Styles holds show the legend, draw the indicator on this chart, palette, show the centre line, the envelope and the arrows, line width and arrow size. These are the same display controls the matching single-chart indicator carries, under the same names, so a chart set up one way can be reproduced on the other.

Three colour schemes are available, including a colour-blind safe one that uses blue and orange and never puts red against green. Panel position, scheme, collapsed state, the sort, the filter, which timeframe columns are visible and every value changed on the sheet are stored per chart and survive a timeframe change and a terminal restart. The interface is English.

Alerts

Off out of the box. A master switch on the panel itself turns them all on or off without opening the sheet, and there is a Test alert button that fires through every channel currently on.

Events: a fresh BUY and a fresh SELL, declared separately for each scanned timeframe, plus data health, which speaks when a symbol loses or regains its data. There is a minimum grade setting, and this port does not grade, so every signal counts as grade one for that purpose.

Channels: popup window, sound, push to the mobile terminal, e-mail. Cooldown is per cell and per event, thirty minutes by default, because a board watching many symbols has many more chances to repeat itself than a single chart does. Telegram is not part of this product.

Cost

The work is budgeted. A set number of symbols is refreshed per timer tick, lower being gentler on a slow machine, so a long list spreads its load out instead of stalling the terminal. The first pass is visibly progressive and the panel says what percentage of the symbols it has measured.

Reading it from an EA

The chart indicator publishes twelve buffers on this platform, readable through iCustom. This map is not the MetaTrader 5 edition's map: MQL4 has no colour-indexed plots, so the slope-coloured centre line is drawn as a pair of plain lines and the indices behind them shift.

Buffer 0, Buy, holds the mark price on a BUY bar and EMPTY_VALUE otherwise, and it is not drawn; buffer 1, Sell, is the same for a SELL bar. Buffers 2 and 3 are the centre line as its two display halves, one while it rises and one while it falls. Buffer 4, Upper, and buffer 5, Lower, are the two envelope edges. Buffers 6 and 7 are the drawn copies of buffers 0 and 1. Buffer 8 is the centre line as one continuous series, the same values the MetaTrader 5 edition publishes at its index 2, and buffer 9 is its colour index. Buffer 10, Signal, reads +1 for a re-entry from below, -1 for a re-entry from above and 0 for none. Buffer 11, Slope, is +1 while the centre is rising and -1 while it is falling.

The Data Window lists the eight drawn rows. The contract behind them, buffers 8 to 11, does not appear there, and that proves nothing: iCustom reads every index above just the same. An EA that wants the centre line by value reads buffer 8.

Buffers 0 and 1 are the EA contract. They are never painted, and they are filled on every pass whatever the Styles tab is set to, so nothing on the display side can starve a strategy of a signal. There is no Override buffer here, which is one index this map does not share with the single-chart Nadaraya Watson Envelope MTF: there the panel override counter ends the map, here it does not exist.

MQL4 has no input groups, so the parameter list an EA passes to iCustom here is shorter than the MetaTrader 5 edition's, and the positions differ. Build the call against this edition's input list, not the other platform's. An instance created by iCustom is read-only and always uses the parameters you passed.

The board itself is a panel, not a buffer. It is read by eye and by alert.

Honest limits

The board reads closed bars, and a cell's age is counted in closed bars: a value published on a closed bar does not change afterwards. The mark on the current forming bar of the chart indicator can appear and disappear before that bar closes.

AGREE is a count of timeframes, not a probability. Four timeframes pointing the same way means four correlated readings of the same instrument agreed, which is worth knowing and is not a forecast.

A tie deliberately produces no verdict, and rows with a tie are hidden by both the buys and the sells filters. That is the honest answer rather than a missing one.

Scanning has a cost. Twenty-eight symbols on four timeframes is a hundred and twelve cells and it will be felt on a slow machine. The budget setting is what you turn down.

A symbol your broker does not carry, or one with too little history for the kernel window, cannot be measured. The board says which, and why, rather than showing an empty cell.

No profit figure, win rate or backtest result is claimed here.
More from author
UT Bot MTF
Evgenii Sutulov
UT Bot MTF is an ATR trailing stop and the flip signals it produces. The stop follows price at a distance of a chosen multiple of ATR, ratchets in the direction of the move and never gives ground back. When price closes through it, the stop flips to the other side and the indicator marks a BUY or a SELL. That is the whole engine, and it is deliberately simple. What this product adds around it is the part that decides whether you can actually use it: four independent filters, an honest account of
FREE
Currency Strength Pro ranks the eight major currencies by relative strength, read from up to 28 pairs, on a multi-timeframe composite, then ranks the basket's own pairs into a graded scanner. Closed bars only, never on a tick. Launch price: $59. It rises to $69 after the next 10 copies, then step by step to the final $98.  The idea is simple: trade a strong currency against a weak one, instead of the chart that happens to look nice today. The strength table answers "which currency". The scanner
Nadaraya Watson Envelope MTF draws a smooth centre line through price and an envelope around it, then marks the bars where price came back inside that envelope after having traded outside it. The question it answers is narrow and it is the only one it claims to answer: price has stretched away from its own recent centre, and it has just stopped stretching. Whether you treat that as a mean-reversion entry, as a place to take profit on a trend position, or as nothing at all is your decision. The i
FREE
Half Trend MTF draws a stepped trend line that holds its level until the market takes it out, and flips to the other side when it does. Around it sits an ATR channel. The decision it supports is a simple one, and it is stated plainly: the line says which side the trend is currently held on, the flip says the moment that changed, and the channel says how much room the current volatility gives price before the flip is likely to matter. Because the line only moves when the extremes of the last N ba
FREE
Wave Trend Oscillator MTF is a two-line momentum oscillator in its own sub-window. The fast line measures how far the typical price has run from its own smoothed centre, relative to its recent average deviation, and a slower average of that fast line is drawn beside it. The event is a cross between the two lines inside a zone the market has actually reached. Crosses in the middle of the range are not signals, and that single rule is what separates this product from a plain oscillator. Three thin
FREE
Currency Strength Flux ranks the eight major currencies by relative strength, read from up to 28 pairs, on a four-timeframe composite that only ever uses closed bars. The idea is simple: trade a strong currency against a weak one, instead of the chart that happens to look nice today. Everything on the panel serves that one decision. What it does The panel ranks EUR, GBP, AUD, NZD, USD, CAD, CHF and JPY from strongest to weakest. Every reading is built from the pairs your broker actually quotes.
FREE
QQE Mod MTF
Evgenii Sutulov
QQE Mod MTF is a momentum oscillator in its own sub-window. It runs two independent QQE blocks over RSI and turns them into one readable histogram. QQE, which stands for Qualitative Quantitative Estimation, smooths RSI and then builds a trailing band around it from the smoothed average of the RSI's own absolute changes. The band does not move against the trend, which is what makes a QQE cross slower and less noisy than an RSI cross. This product runs two of those blocks at once and publishes wha
FREE
Squeeze Momentum MTF answers two questions at once, in one sub-window. The first is whether the market is compressed. Bollinger Bands are compared with a Keltner Channel: when the Bollinger Bands sit entirely inside the Keltner Channel, volatility has contracted and the market is in a squeeze. When they push back outside it, the squeeze has released. The second is which way the compressed energy is pointing. A detrended price series is fitted by linear regression and the endpoint of that fit is
FREE
Currency Strength Flux ranks the eight major currencies by relative strength, read from up to 28 pairs, on a four-timeframe composite that only ever uses closed bars. The idea is simple: trade a strong currency against a weak one, instead of the chart that happens to look nice today. Everything on the panel serves that one decision. What it does The panel ranks EUR, GBP, AUD, NZD, USD, CAD, CHF and JPY from strongest to weakest. Every reading is built from the pairs your broker actually quotes.
FREE
Exhaustion Count MTF counts. It does not predict direction and it does not tell you which way to trade. It answers one question: has this move been going on long enough that it is running out of participants. Two independent phases run on the chart, a setup and a countdown, each with its own rules, its own cancellation conditions and its own place in the buffers an Expert Advisor can read. The setup Nine consecutive closes on one side of the close four bars back, started by a price flip. A bar t
FREE
A trailing stop that never gives ground, and the exact bar it turns. UT Bot MTF draws the ATR stop on your chart, marks every BUY and SELL flip, and then does the part almost no version of it does: it tells you how many signals its filters threw away and which filter threw them, and it warns you, in colour, while the arrow on the current bar can still disappear. Free, no trial, no locked features. The engine is deliberately simple. The stop follows price at a chosen multiple of ATR, ratchets in
FREE
Momentum you can read at a glance, and a product that tells you when it is not sure. QQE Mod MTF runs two independent QQE blocks over RSI and prints one histogram: bright when both blocks agree on a direction, grey when they do not. That grey is the point. Most oscillators give you a colour on every bar and leave you to guess how much it is worth; this one says out loud when there is no confirmation. Free, no trial, no locked features. QQE, which stands for Qualitative Quantitative Estimation, s
FREE
A trend line that refuses to wander. Half Trend MTF holds its level while the market pushes at it and flips only when the extremes of the last N bars actually take it out, so it sits still through the chop that makes a moving average look like a signal generator. Around it an ATR channel shows how much room today's volatility gives price before that flip is likely to matter. Free, no trial, no locked features. The decision it supports is a simple one, and it is stated plainly: the line says whic
FREE
An arrow tells you to buy. Obsidian Scalper Pro tells you where to buy, where the stop goes, where the three targets are, how big the position should be for your risk, and how good the setup is out of 100. Every signal arrives as a finished trade plan drawn on the chart, and a built in statistics window shows the honest result of the last hundred of them, win rate with a confidence interval and all. Every decision is made on a closed bar, so the history you are looking at is the history you woul
Nine closes, thirteen counts, and the discipline most implementations quietly drop. Exhaustion Count MTF runs the classic setup and countdown pair with the full cancellation and recycling rules, marks the perfected nines, leaves the Setup Barrier levels on the chart, and never prints a number on a bar that has not closed, so nothing here repaints, ever. Free, no trial, no locked functions. It counts. It does not predict direction and it does not tell you which way to trade. It answers one questi
FREE
A nine or a thirteen is rare on any one chart, and that is precisely why a watch list beats chart-hopping. Exhaustion Count Scanner runs the full setup and countdown method, cancellation and recycling rules included, across your symbol list on up to eight timeframes at once, prints every running count with the count it is heading for, and marks the rows where the timeframes agree. Out of the box it scans fifteen pairs; one setting raises that to twenty-eight. The counts also draw on the chart in
Twenty-eight symbols, four timeframes, one screen, and the trade already on the chart under it. Half Trend Scanner runs the stepped trend line across your whole watchlist, sorts the board by what flipped most recently, and tells you in one column how many timeframes agree on each symbol. Every cell it could not measure explains itself in words instead of going blank, so an empty board is never a mystery. The price increases by $10 every 10 purchases. It is two products in one file. The first is
A kernel regression that does not repaint, which is the whole point. Nadaraya Watson Envelope MTF draws a smooth centre line through price and an error envelope around it, marks the bars where price came back inside after stretching out, and computes every bar from the bars behind it only, so a closed bar never moves. The usual charting-site version of this line is fitted two-sided and rewrites itself under your feet; this one is causal by construction. Free, no trial, no locked functions. The q
FREE
Twenty-eight symbols on four timeframes at once, and a board that admits when momentum is not confirmed. QQE Mod Scanner runs two independent QQE blocks over RSI across your whole watchlist, prints in every cell which way momentum turned and how many bars ago, and writes flat where the two blocks do not agree instead of colouring the cell anyway. The AGREE column tells you how many timeframes stand on the same side, and the oscillator itself is drawn in the sub-window under the table, so the mom
The market goes quiet before it moves, and this window shows both halves of that sentence. Squeeze Momentum MTF marks the bars where Bollinger Bands sit entirely inside the Keltner Channel, prints the exact bar where that compression releases, and colours a momentum histogram so you see which side the stored energy was on when it let go, on this timeframe or a higher one drawn right here. Free, no trial, no locked functions. The first question it answers is whether the market is compressed. Boll

FREE
A squeeze release lasts a few bars and never waits for you to cycle through charts. Squeeze Momentum Scanner watches your symbol list on up to four timeframes at once, prints the exact bar each compression let go and which side the momentum was on, and marks the rows where the timeframes agree. Out of the box it scans fifteen pairs; one setting raises that to twenty-eight. The oscillator itself draws in this chart's sub-window, so you act on what the table found without attaching a second indica

Watch twenty-eight symbols on four timeframes at once, and see the trade on the chart in the same breath. UT Bot Scanner runs the ATR trailing stop across your whole watchlist, sorts the board by what flipped most recently, tells you how many timeframes agree on each symbol, and draws the indicator itself on the chart under the table, so the moment the board finds something you are already looking at it. Every cell that could not be measured explains itself in words instead of going blank. The p
An oscillator that ignores every cross in the middle of the range. Wave Trend Oscillator MTF publishes a cross only when it happens inside a zone the market has actually reached, grades it by how deep that zone was, finds divergences on the fast line and can draw them on the price chart where you trade, and it can compute all of this on a higher timeframe while you watch your own. Free, no trial, no locked functions. The fast line measures how far the typical price has run from its own smoothed
FREE
One glance instead of twenty-eight charts. Wave Trend Oscillator Scanner runs the Wave Trend calculation across your symbol list on up to four timeframes at once, prints every fresh cross with its age and its grade, and marks the rows where the timeframes actually agree. Out of the box it scans fifteen pairs; one setting raises that to twenty-eight. And the oscillator itself draws in this chart's sub-window, so you act on what the table found without attaching a second indicator. The price incre
Currency Strength Pro ranks the eight major currencies by relative strength, read from up to 28 pairs, on a multi-timeframe composite, then ranks the basket's own pairs into a graded scanner. Closed bars only, never on a tick. Launch price: $59. It rises to $69 after the next 10 copies, then step by step to the final $98.  The idea is simple: trade a strong currency against a weak one, instead of the chart that happens to look nice today. The strength table answers "which currency". The scanner
Nadaraya Watson Envelope Scanner is two products in one file. The first is Nadaraya Watson Envelope itself, drawn on the chart you are looking at: a causal Nadaraya-Watson kernel regression centre line, an envelope built from the mean absolute error around it, and marks where price came back inside the envelope after having traded outside it. The price increases every 10 purchases, the next price is $39 The second is a board that runs the same calculation over a list of symbols on several time
Exhaustion Count Scanner is two products in one file. The first is Exhaustion Count MTF itself, drawn on the chart in front of you: the setup and countdown numbers printed bar by bar, the Setup Barrier levels currently in force, and the arrows on completed signals. The second is a board that runs the same counting across a list of symbols on up to eight timeframes at once. A nine or a thirteen is a rare event on any one instrument, which is exactly the case a board is for. The table finds them a
QQE Mod Scanner is two products in one file. The first is the QQE Mod oscillator itself, in this chart's own sub-window: two independent QQE blocks over RSI, reduced to one histogram, a trailing line drawn around zero and a Bollinger filter on that line. The state it publishes is the combination of the two, bright when both blocks agree on a direction and grey when they do not. The second is a board that runs the same calculation across a list of symbols on several timeframes at once. The board
Wave Trend Oscillator Scanner is two products in one file. The first is the Wave Trend oscillator itself, in this chart's own sub-window: the fast and slow wave lines and the histogram of their difference, coloured by whether momentum is expanding or fading, with divergence lines that can also be drawn on the price chart itself. The second is a board that runs the same calculation across a list of symbols on several timeframes at once. This is one of the two products in the family where the grad
Squeeze Momentum Scanner is two products in one file. The first is Squeeze Momentum MTF itself, in this chart's own sub-window: the momentum histogram coloured by expansion and fading, and the row of squeeze dots that says whether the Bollinger Bands are inside the Keltner Channel, outside it, or have just come out. The price increases every 10 purchases, the next price is $39 The second is a board that runs the same calculation across a list of symbols on several timeframes at once. A squeeze
Filter:
No reviews
Reply to review