Squeeze Momentum MTF
- Indicators
-
Evgenii Sutulov
 Premium components
1. https://www.mql5.com/en/market/product/201632 - Rotation Manager Console - Version: 1.3
Squeeze Momentum MTF answers two questions at once, in one sub-window.
The first is whether the market is compressed. Bollinger Bands are compared with a Keltner Channel: when the Bollinger Bands sit entirely inside the Keltner Channel, volatility has contracted and the market is in a squeeze. When they push back outside it, the squeeze has released.
The second is which way the compressed energy is pointing. A detrended price series is fitted by linear regression and the endpoint of that fit is the momentum histogram. Its sign says the side, and its colour also says whether the current bar is expanding on the previous one or fading against it, so a histogram that is still positive but shrinking reads differently from one that is positive and growing.
The decision it supports: the market has been quiet, it has just stopped being quiet, and here is which side the momentum was on when it did.
What is on the chart
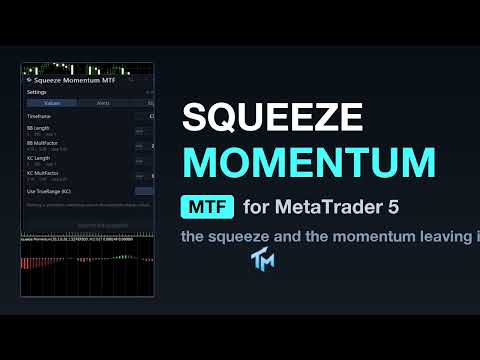
In its own sub-window there are two things. The momentum histogram, in four colours: positive and expanding, positive and fading, negative and expanding, negative and fading. And a row of dots on the zero line, in three states: no squeeze, squeeze on, squeeze just released.
The signal the product publishes is the release: the previous closed bar was in a squeeze and this one is not, with the sign of the momentum saying which way.
The panel
A canvas panel, by default on the price chart rather than crammed into the oscillator pane, though it can be moved into the oscillator pane. Draggable, collapsible, closeable.
It shows the timeframe in force and the Bollinger and Keltner lengths actually being used. It says what the last closed bar is: a bullish squeeze release, a bearish squeeze release, or no release. And it says whether the numbers come from the properties dialog or the panel, and how many were changed.
Below that sit the settings the panel can move, with their values. The gear opens a three-tab sheet.
The Values tab covers the timeframe, the Bollinger length, the Bollinger multiplier, the Keltner length, the Keltner multiplier, and whether the Keltner range uses true range or plain high-low. Each row has steppers, a range and a sentence of help. The Alerts tab covers the master switch, the per-event switches, four channels, the cooldown and a test button. The Styles tab covers the palette, whether the histogram and the squeeze dots are drawn, and the dot size; it changes appearance only.
Three colour schemes, including a colour-blind safe one that uses blue and orange rather than red and green. Panel state and every change made on the sheet persist per chart across a timeframe change and a terminal restart. The interface is English.
Alerts
Off out of the box. The events are a BUY signal and a SELL signal, both meaning a squeeze release with the momentum on that side. Channels: a popup window, a sound, a push to the mobile terminal and e-mail. There is a cooldown per event, two hours by default.
Alerts fire on the last closed bar. Two further alerts, off by default, speak on the forming bar within a chosen number of seconds of its close. They are labelled early because a release that exists mid-bar can be gone by the close. Telegram is not part of this product.
Multi-timeframe
The Timeframe setting computes on a higher timeframe and draws the result here. Only closed senior bars are read: a chart bar shows the newest senior bar that had already closed by that bar's own time, not the one that contains it.
The foreign series is built in the background and the first read of it can return nothing. The indicator retries and the panel says whether it is waiting for a download or short of history. It never fails initialisation over missing bars.
Reading it from an EA
Six buffers, all readable through iCustom and CopyBuffer. Buffer 0, Momentum, is the linear-regression endpoint of the detrended series. Buffer 1 is the colour index for the histogram: 0 means up and expanding, 1 up and fading, 2 down and expanding, 3 down and fading. Buffer 2, Squeeze, is the dot, always 0.0 where it is visible. Buffer 3 is the colour index for the dot: 0 means no squeeze, 1 squeeze on, 2 squeeze released. Buffer 4, Signal, is +1 when a squeeze has just released bullish, -1 when it has released bearish, and 0 when there is no release. Buffer 5, Override, counts how many settings were changed from the panel.
This product has no separate Buy and Sell price buffers. The event is buffer 4.
The Styles tab hides a plot by taking its colour away, never by emptying a buffer. Every index in the list above stays readable through iCustom and CopyBuffer, and stays visible in the Data Window, with the display switches off. Buffer 5 lets a strategy tell that a chart instance is running on values changed by hand from the panel; an instance created by iCustom is read-only and always uses the parameters you passed.
Provenance
This is a port of "Squeeze Momentum Indicator [LazyBear]", from the author's own open-source publication. No licence is attached to that publication, which makes a close port of the formulas admissible, and this implementation follows the formulas rather than guessing at them.
The product carries the method's name because that is what it implements. The original work is LazyBear's and no authorship of it is claimed here.
Honest limits
The histogram and the dot on the forming bar are live and will change until that bar closes. A release that shows mid-bar can be absent at the close. Closed bars do not change.
A squeeze release is a statement about volatility, not about direction. The momentum sign tells you which side the energy was on at the moment of release, and that is a description of what has just happened rather than a forecast of what comes next.
A squeeze can also release into nothing. Compression is a necessary condition for an expansion, not a sufficient one.
The Bollinger and Keltner settings move the squeeze detection materially. Widening the Keltner multiplier produces more squeezes, narrowing it produces fewer, and neither configuration is the correct one.
No profit figure, win rate or backtest result is claimed here.