Cascade WMA Trend MTF
- Indicators
-
Evgenii Sutulov
 I build trading indicators, strategies, and dashboards that don't repaint.
Seven years doing this. MetaTrader 4, MetaTrader 5, TradingView.
Closed bars only. What you see is what happened.
The bar being formed never changes a published value. - Version: 1.3
One line, six weighted averages deep, that changes direction instead of crossing something. Cascade WMA Trend MTF chains six weighted moving averages whose periods grow the way a Fibonacci sequence does, which smooths the result far past what a single average of the same length would do, and takes its signal from the finished line turning. Any higher timeframe can be drawn on any chart, closed senior bars only. It is free: no trial, no locked features, no upgrade page.
Six weighted moving averages are chained, each one taken over the output of the last, and their periods are formed by adding the previous two together. With the shipped values of three and five that gives the sequence three, five, eight, thirteen, twenty one and thirty four. The signal is the direction of the finished line changing, nothing crossing anything.
Six stages of weighting make a line that is very hard to move, which is the point of the method and also the whole of its cost. The ATR period in the settings scales the distance an arrow is drawn from the bar and never touches the flip itself.
What is on the chart
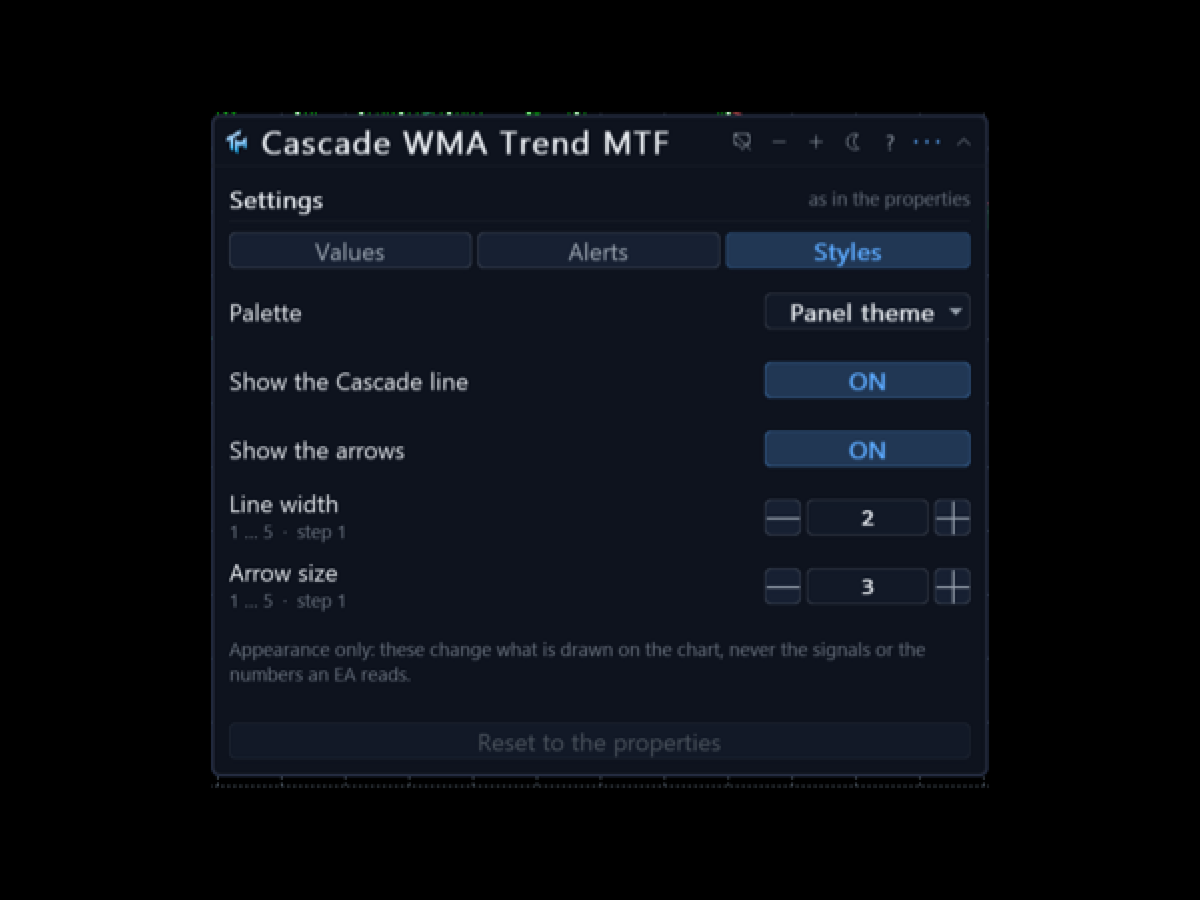
Drawn in the price window: the cascade line coloured by its direction and unbroken across the turn, and BUY and SELL arrows on the bar where the direction changed. There is no channel in this product, so the Styles tab offers the line, its width and the arrow size and nothing else.
The panel
A canvas panel on the price chart, draggable, collapsible, closeable. It shows the timeframe in force and the setting values actually being used. It says what the last closed bar was: a BUY signal, a SELL signal, or neither. And it says whether the numbers on screen came from the properties dialog or from the panel, and how many of them were changed by hand.
Below that sit the settings the panel can move, with their current values. The gear opens a three-tab sheet.
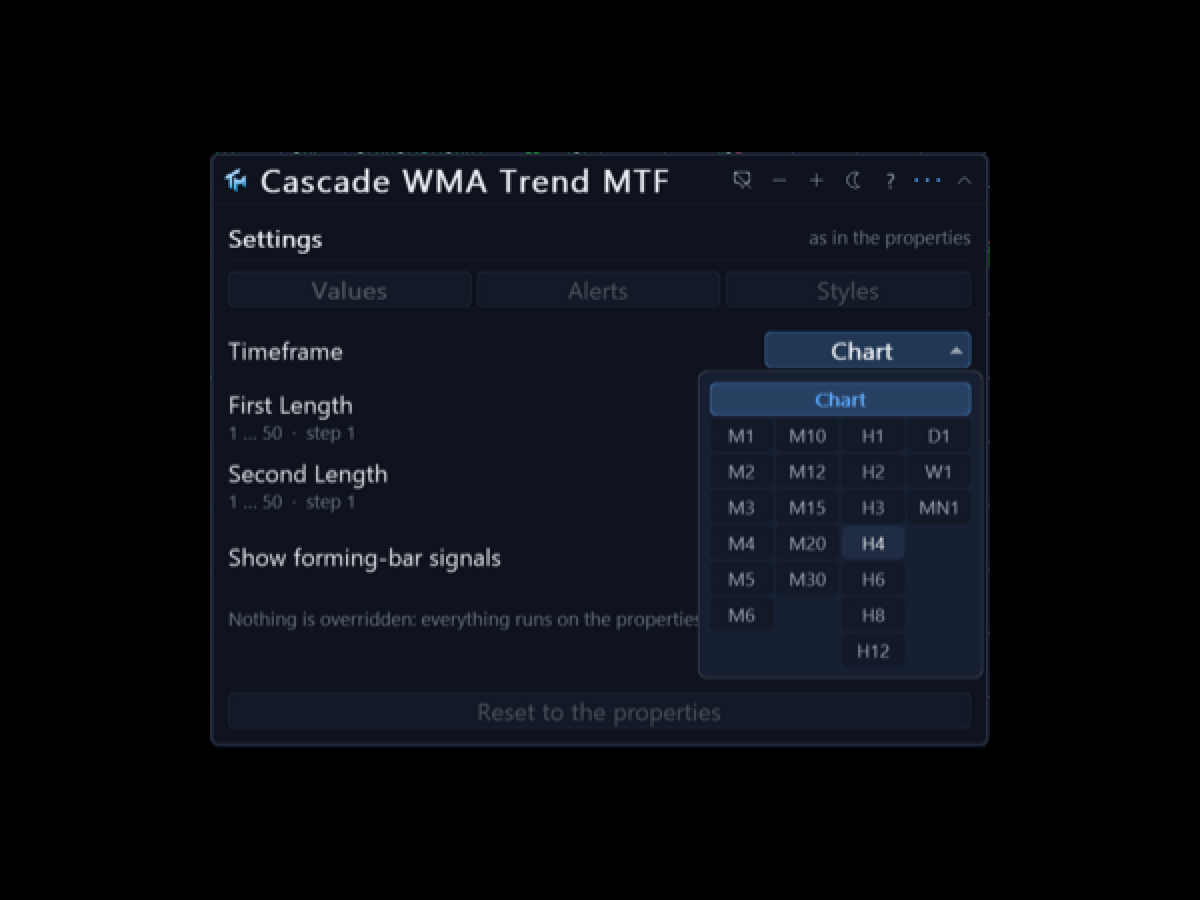
Values covers the timeframe, the first length and the second length that seed the chain, three and five out of the box, and the ATR period of fourteen, which scales the arrow offset only. Styles covers the palette, the line and its width, and the arrow size. Every Values row has steppers, a range and a sentence of help; the Styles tab changes appearance only.
The Alerts tab covers the master switch, the per event switches, the channels, the cooldown in minutes and a test alert.
Three colour schemes: dark, light, and a colour-blind safe one that uses blue and orange rather than red and green. Everything about the panel, including every value changed on the sheet, is stored per chart and survives a timeframe change and a terminal restart. The interface is English.
Alerts
Off out of the box. Three events: a BUY signal, a SELL signal, and a touch of the cascade line, which is the pull back event rather than a flip. Each has a switch of its own.
Channels: a popup window, a sound, a push to the mobile terminal and e-mail. There are per-event and per-channel switches, and a cooldown that defaults to two hours.
Alerts fire on the last closed bar. Two further alerts, off by default, speak on the forming bar within a chosen number of seconds of its close, and they are labelled early because a flip that exists mid-bar can un-happen. Telegram is not part of this product.
Signals on the forming bar
There is one switch that matters more than the others, and it is in the Values tab as well as in the inputs: whether buffers and arrows are allowed on the bar that is still forming.
With it on, which is the shipped default, you see a flip as soon as the market makes it. Sometimes that flip is undone before the bar closes and the arrow disappears. With it off, nothing is written on the forming bar at all: there is no repaint of any kind, and every signal arrives one bar late by construction.
Both behaviours are legitimate. The product does not pick for you and it does not hide which one it is doing: the panel and the setting name both say so.
Multi-timeframe
The Timeframe setting computes on a higher timeframe and draws the result here. Only closed senior bars are read: a chart bar shows the newest senior bar that had already closed by that chart bar's own close, so the flip lands on the bar that closes together with the senior bar, and nothing is drawn that could not have been known in real time.
The foreign series is built in the background. The first read of it can come back empty, the indicator retries, and the panel says whether it is waiting for a download or looking at a genuine shortage of history. It never fails initialisation over missing bars.
Reading it from an EA
Sixteen buffers, all readable through iCustom and CopyBuffer. Buffer 0, Buy, carries the arrow price on a BUY bar and EMPTY_VALUE otherwise, and is not drawn; buffer 1, Sell, is the same for a SELL. Buffers 2 to 5 belong to the two fills and are display plumbing, not for reading. Buffer 6 is the cascade line while the trend is up and buffer 7 is the same line while it is down; on the turning bar both hold a value, which is what keeps the drawn line unbroken. Buffer 8 is a service series kept for the shared buffer map and buffer 9 is a second service series kept for the same reason. Buffers 10 and 11 are the drawn copies of buffers 0 and 1. Buffer 12, Signal, is +1 on a BUY bar, -1 on a SELL bar and 0 otherwise. Buffer 13 is Override, buffer 14 is the cascade line as one unbroken series, and buffer 15 is the trend itself, 0 while up and 1 while down.
Buffers 0 and 1 are the contract: never painted, filled on every pass whatever the Styles tab says, and present in the Data Window. Hiding the arrows on the display cannot starve a strategy of the signal, because hiding is done by changing how a plot is drawn and never by emptying a buffer.
An instance created by iCustom is read only and always uses the parameters you passed. The Override buffer lets a strategy detect that a chart instance is running on numbers changed by hand from the panel.
Provenance
This is a port of "MavilimW" by KivancOzbilgic, an openly published TradingView script, which makes a port by formula admissible. The product name is descriptive on purpose: Mavilim is the author's own brand and a brand does not transfer with a formula, so this is called Cascade WMA Trend and the mathematics is credited above. One deviation is declared: on the first bars of a series the windows are progressive rather than empty, and after the warm up the two agree.
The product is called Cascade WMA Trend MTF because that is the name of the method, not because authorship of the method is claimed here. The original work belongs to its author.
Honest limits
Six chained averages turn late. That is not a defect to be tuned away; it is the whole of what the method offers, and a faster setting is a different indicator.
There is no volatility filter and no channel here. A turn in a flat market looks exactly like a turn at the start of a move, and the product does not pretend to tell them apart.
The two seed lengths move every arrow the product will ever draw, because they set all six periods. Two settings give two different sets of signals and neither of them is the correct one.
No profit figure, win rate or backtest result is claimed here.