Squeeze Momentum Scanner
- Indicators
-
Evgenii Sutulov
 Premium components
1. https://www.mql5.com/en/market/product/201632 - Rotation Manager Console - Version: 1.3
- Activations: 20
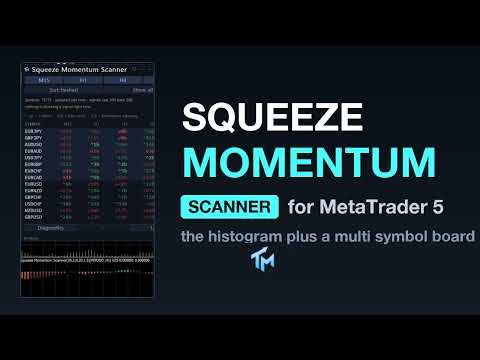
Squeeze Momentum Scanner is two products in one file. The first is Squeeze Momentum MTF itself, in this chart's own sub-window: the momentum histogram coloured by expansion and fading, and the row of squeeze dots that says whether the Bollinger Bands are inside the Keltner Channel, outside it, or have just come out.
The second is a board that runs the same calculation across a list of symbols on several timeframes at once. A squeeze release is a short-lived event and it happens on different instruments at different times, which is exactly the case a board is for: the table finds them, and the sub-window under it shows you the histogram that produced one.
The board
A row per symbol, a column per scanned timeframe, up to four columns and up to twenty-eight symbols. The symbol list is comma separated, or the board can take the Market Watch list instead. Broker prefix and suffix are detected from the chart you are on, or given by hand. Out of the box the board scans four timeframes: M15, H1, H4 and D1.
A cell reads like ^14b: the side momentum was on when the squeeze released, and how many bars ago that release was. The word flat means the calculation ran and found no release in the window. Three dots mean the cell is not measured yet, and hovering it explains why. A release older than the freshness threshold keeps its hue and loses its weight. A row carrying a fresh release anywhere in it gets a wash of the accent colour.
The AGREE column takes the visible timeframe columns for a symbol, finds the majority side and prints something like v3/4: the direction, and how many of the visible timeframes stand on it. Full agreement is drawn bold in that side's colour. A tie prints a dash and is not a verdict, because calling a one to one split a signal would be inventing conviction. With one timeframe visible the column is dropped entirely rather than printing a 1/1 that restates the cell next to it.
Column headers are buttons. Click a timeframe header to sort by that column, freshest first, rows with nothing at the bottom; click again to reverse. Click AGREE to sort by agreement, full agreement first. The active header carries the accent colour and a caret. A separate Sort button cycles freshest, grade and name.
A Show button cycles all, buys, sells and fresh. Buys and sells follow the AGREE verdict rather than any single cell, so a row shown under buys always reads an up glyph in AGREE, and a tie appears under neither. The filter acts on the view, not on the calculation.
The legend above the table decodes the notation and can be turned off. Timeframe buttons show and hide a column without stopping the measurement. Clicking a cell switches this chart to that symbol and that timeframe.
The visible row count is fitted to the pane and the row setting is a maximum. Page buttons appear only when the rows do not fit. Because the board never draws more rows than the pane holds, the page buttons are always on screen and always reachable, however tall the row setting is.
Two status lines are always on show: symbols ready of total, time since the last update, releases found in the lookback window; then either the watchdog line or a sentence explaining why nothing is showing.
Diagnostics
A second panel, off by default, answers the question "why is there no signal": symbol coverage, which series are short of bars, how many signals were found in the window, and how many symbols this indicator switched on in Market Watch. A cell that could not be measured is explained rather than left blank.
The chart indicator
Drawn in its own sub-window: the four-colour momentum histogram and the three-state squeeze dots. Its timeframe is set separately from the timeframes the board scans.
The settings sheet
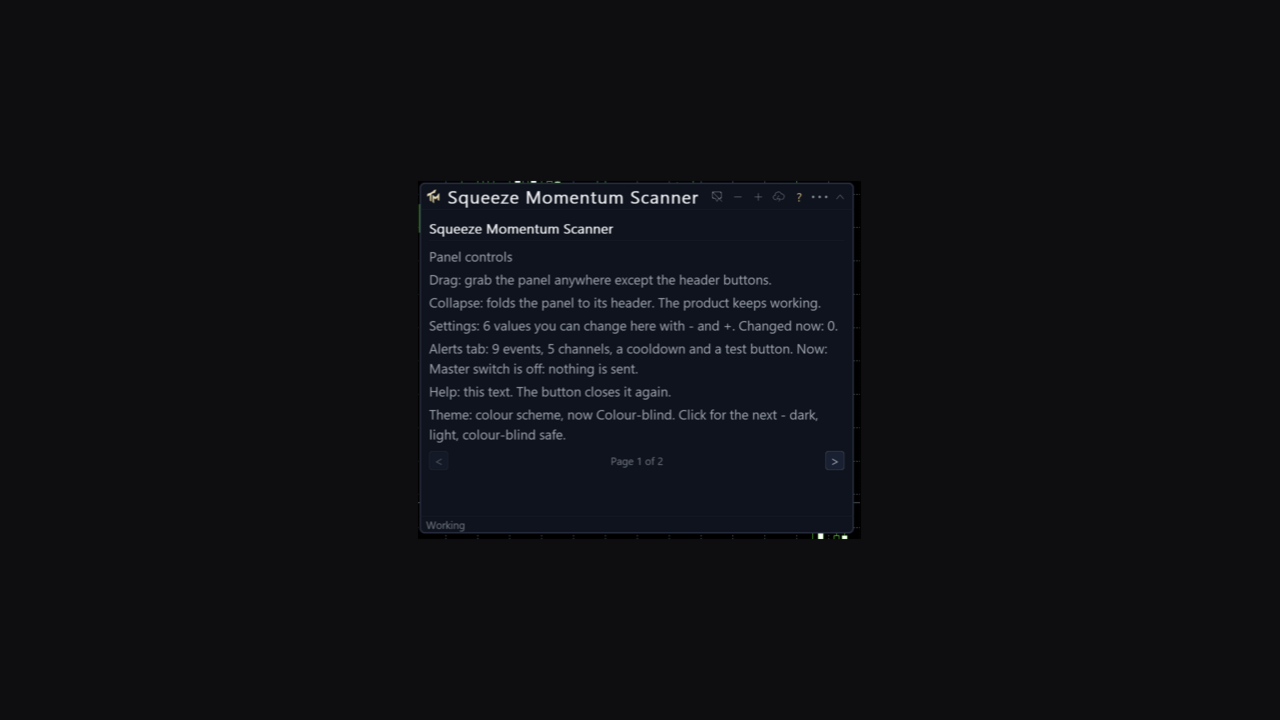
The gear opens three tabs. Values covers the timeframe, the Bollinger length, the Bollinger multiplier, the Keltner length, the Keltner multiplier, and whether the Keltner range uses true range or plain high minus low. Every row has steppers, a range and a sentence of help. Changing one recalculates the whole board, and the panel reports progress while it does.
Alerts covers the master switch, the per-event switches, the four channels, the cooldown and a test button.
Styles covers the legend, the palette, the momentum histogram, the squeeze dots and the dot size. These are the same display controls the matching single-chart indicator carries, under the same names, so a chart set up one way can be reproduced on the other.
Three colour schemes, including a colour-blind safe one that uses blue and orange rather than red and green. Panel position, scheme, the sort, the filter, the visible columns and every value changed on the sheet persist per chart across a timeframe change and a terminal restart. The interface is English.
Alerts
Off out of the box, with a master switch on the panel and a Test alert button next to it.
The events are a fresh BUY and a fresh SELL, declared separately for each scanned timeframe, plus data health, which speaks when a symbol loses or regains its data. There is a minimum grade setting; this port does not grade, so every signal counts as grade one for it.
The channels are a popup window, a sound, a push to the mobile terminal and e-mail. The cooldown is kept per cell and per event, thirty minutes by default. Telegram is not part of this product.
Cost
The work is budgeted: a set number of symbols is refreshed per timer tick, so a long list spreads its load rather than stalling the terminal. The first pass is progressive and the panel reports the percentage measured.
Reading it from an EA
The chart indicator's buffers are readable through iCustom and CopyBuffer. Buffer 0, Momentum, is the linear-regression endpoint of the detrended series, and buffer 1 is its colour index: 0 means up and expanding, 1 up and fading, 2 down and expanding, 3 down and fading. Buffer 2, Squeeze, is the dot, always 0.0 wherever it is visible, and buffer 3 is its colour index: 0 means no squeeze, 1 a squeeze in progress, 2 a squeeze released. Buffer 4, Signal, is +1 for a bullish release, -1 for a bearish one and 0 when there is none.
There are no separate Buy and Sell price buffers in this product. The event is buffer 4.
The Styles tab hides a plot by taking its colour away, never by emptying a buffer. Every index listed above stays readable through iCustom and CopyBuffer, and stays visible in the Data Window, with the display switches off.
The board is a panel and not a buffer. It is read by eye and by alert.
Provenance
This is a port of "Squeeze Momentum Indicator [LazyBear]", from the author's own open-source publication. No licence is attached to that publication, which makes a close port of the formulas admissible, and this implementation follows the formulas rather than guessing at them.
The product carries the method's name because that is what it implements. The original work is LazyBear's and no authorship of it is claimed here.
Honest limits
The board reads closed bars and counts a cell's age in closed bars. In the sub-window the histogram and the dot for the bar that has not closed are live and will change until it does, so a release visible mid-bar can be absent at the close. What a closed bar has published does not change afterwards.
A squeeze release is a statement about volatility, not about direction. The momentum sign says which side the energy was on at the moment of release. A squeeze can also release into nothing: compression is a necessary condition for expansion, not a sufficient one.
AGREE counts timeframes, it does not estimate probability, and four correlated readings of one instrument agreeing is not the same as four independent confirmations. A tie deliberately produces no verdict and is hidden by both the buys filter and the sells filter.
The Bollinger and Keltner settings materially change how many squeezes are detected. A wider Keltner multiplier gives more, a narrower one gives fewer, and neither configuration is the correct one.
Scanning costs. Twenty-eight symbols on four timeframes is a hundred and twelve cells; the budget setting is what you turn down on a slow machine.
No profit figure, win rate or backtest result is claimed here.