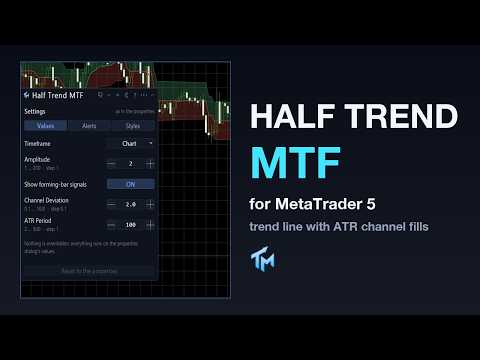
Half Trend MTF
- Indicators
-
Evgenii Sutulov
 Premium components
1. https://www.mql5.com/en/market/product/201632 - Rotation Manager Console - Version: 1.3
Half Trend MTF draws a stepped trend line that holds its level until the market takes it out, and flips to the other side when it does. Around it sits an ATR channel.
The decision it supports is a simple one, and it is stated plainly: the line says which side the trend is currently held on, the flip says the moment that changed, and the channel says how much room the current volatility gives price before the flip is likely to matter.
Because the line only moves when the extremes of the last N bars move against it, it does not wander in a chop the way a moving average does. It sits still, and then it flips.
What is on the chart
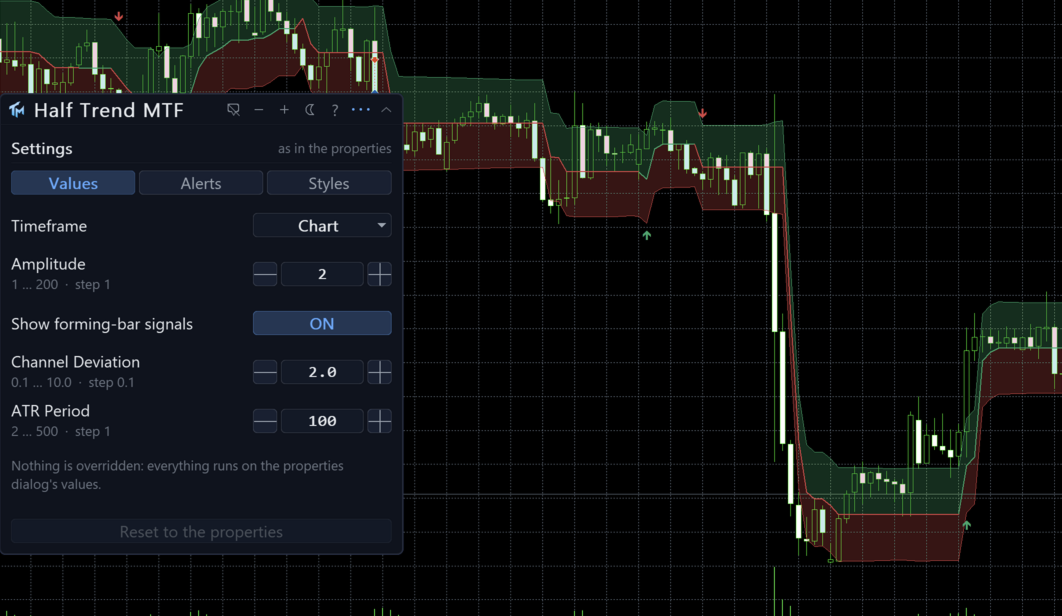
The Half Trend line, drawn in the trend's colour and unbroken across the flip bar: one plot while the trend is up, another while it is down, joined where they hand over. The ATR channel, an upper and a lower band whose distance from the line is a multiple of half the ATR, each band a thin line in its own colour. Between them two soft fills, the bull colour above the line and the bear colour below it, so which half of the channel price is in reads at a glance. And BUY and SELL arrows on the flip bars. Everything draws in the price window.
The panel
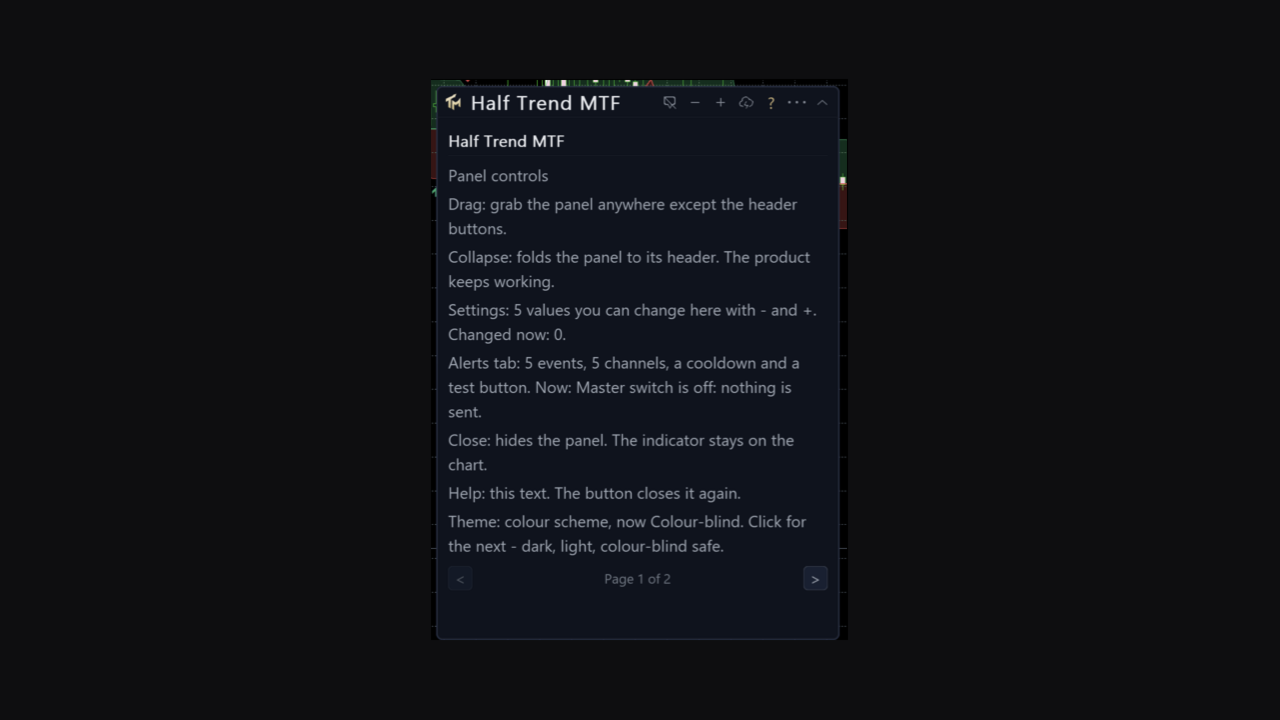
A canvas panel on the price chart, draggable, collapsible, closeable. It shows the timeframe in force and the amplitude actually being used. It says what the last closed bar was: a BUY flip, a SELL flip, or no flip. And it says whether the numbers on screen are the properties dialog's or the panel's, and how many were changed.
Below that sit the settings the panel can move, with their current values. The gear opens a three-tab sheet.
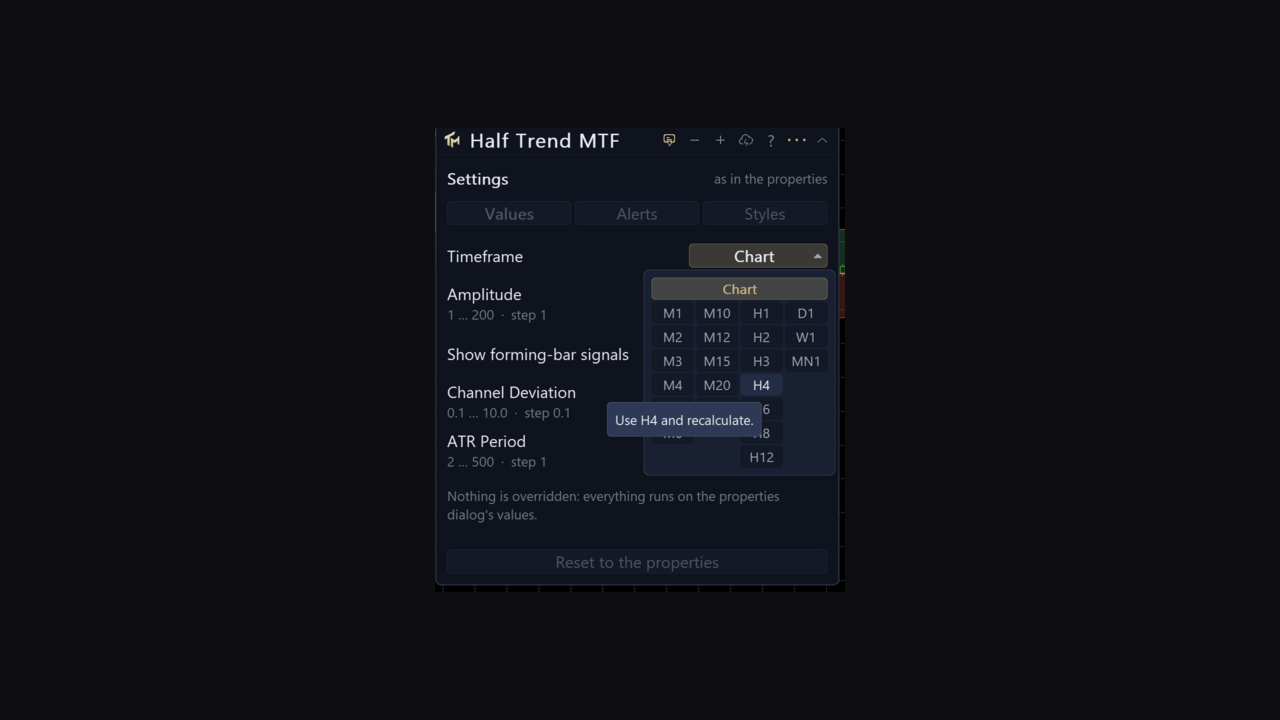
The Values tab covers the timeframe, the amplitude, whether forming-bar signals are shown, the channel deviation and the ATR period. Every row has steppers, a range and a sentence of help, there is a counter of how many values are no longer the properties dialog's numbers, and one button puts them all back.
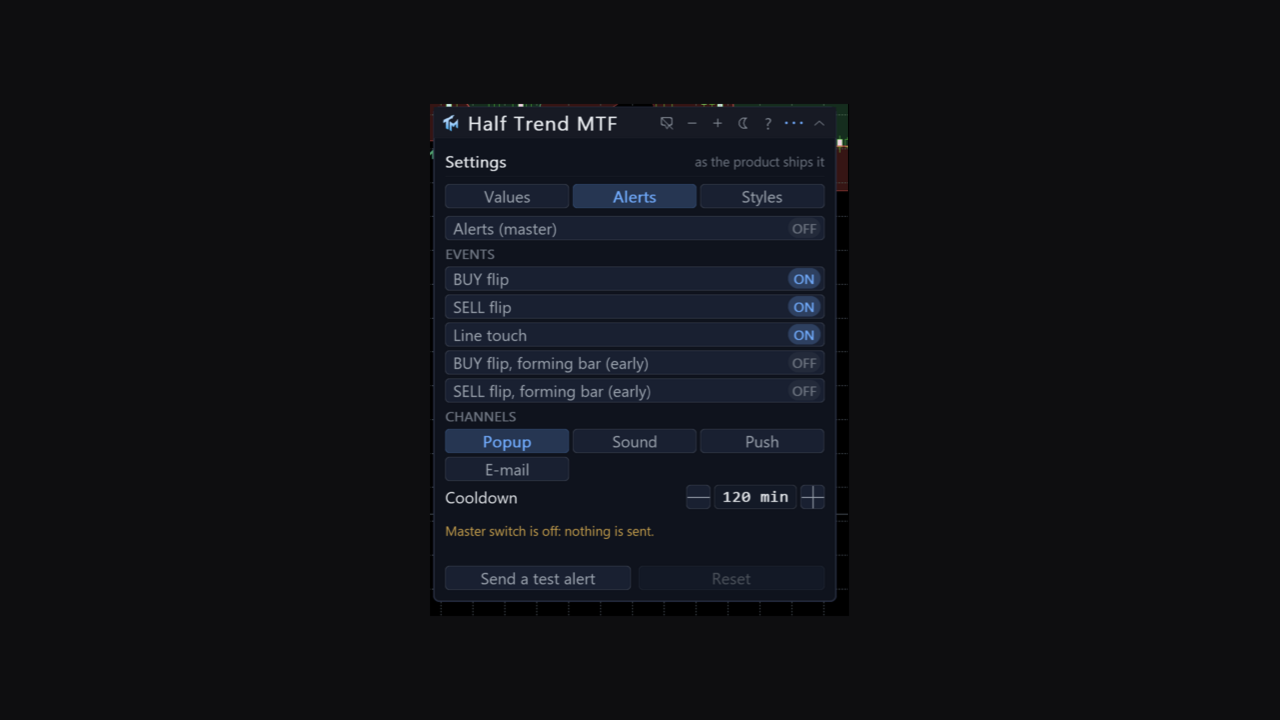
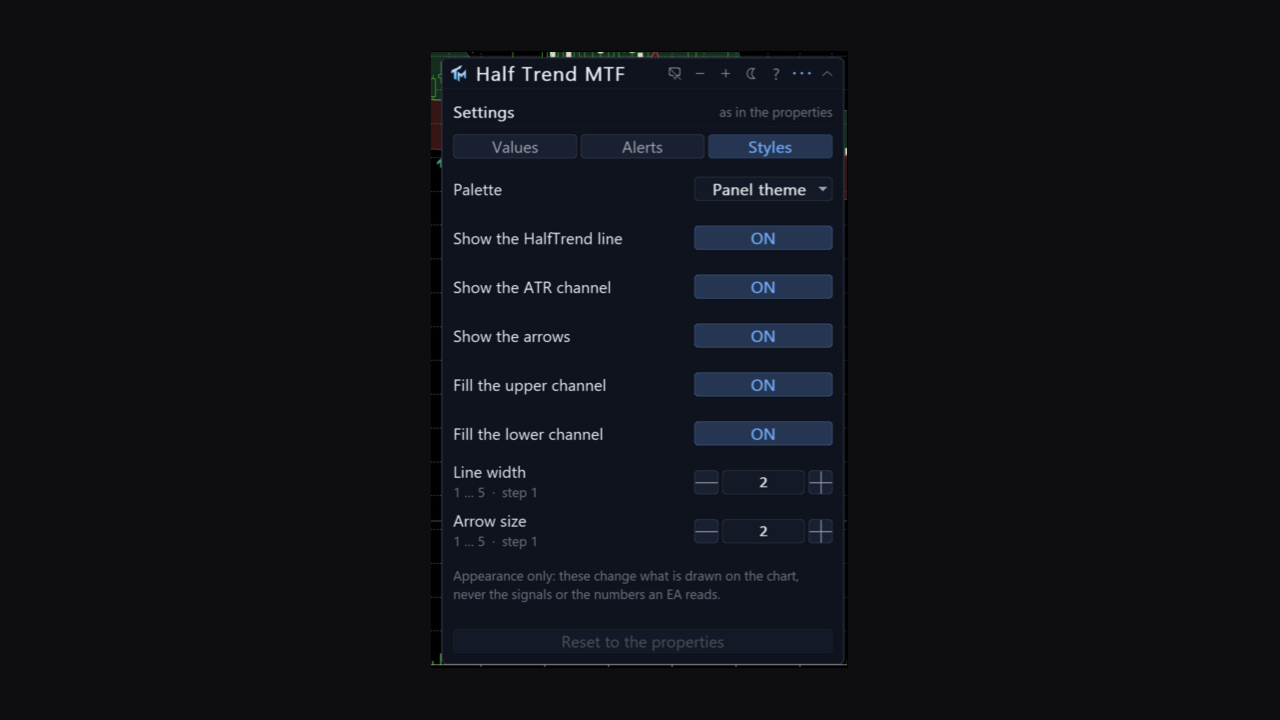
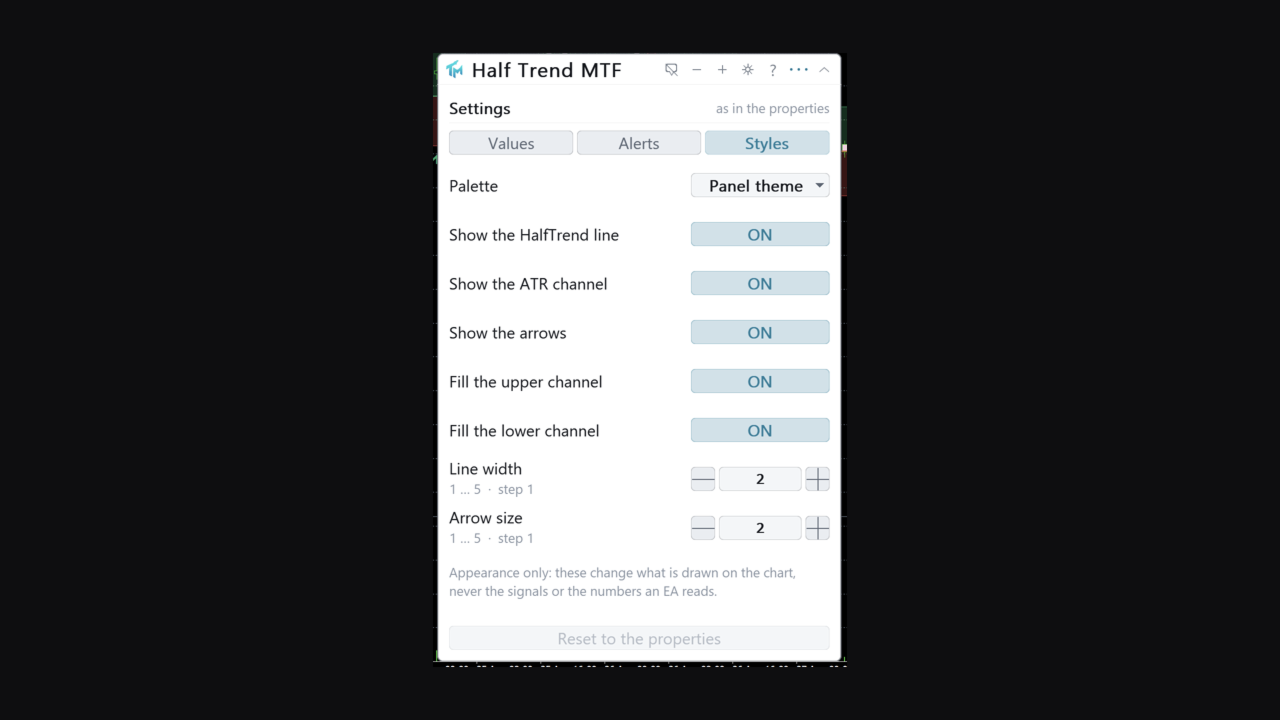
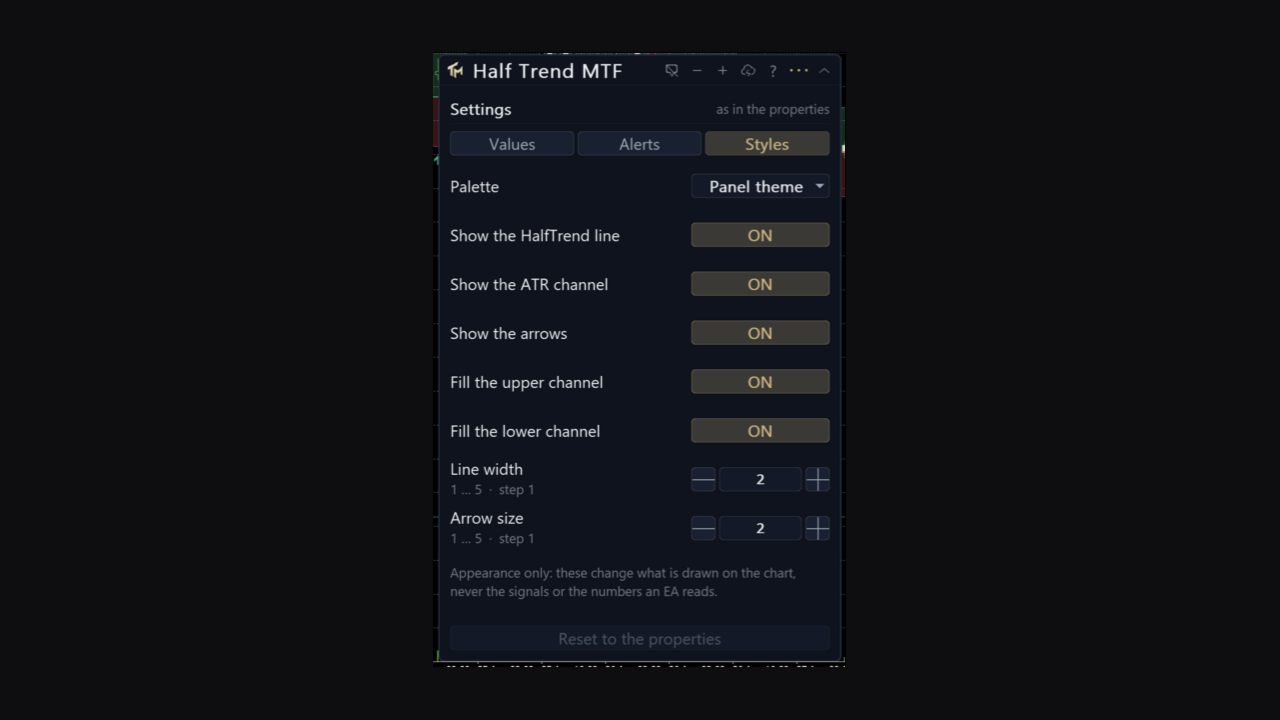
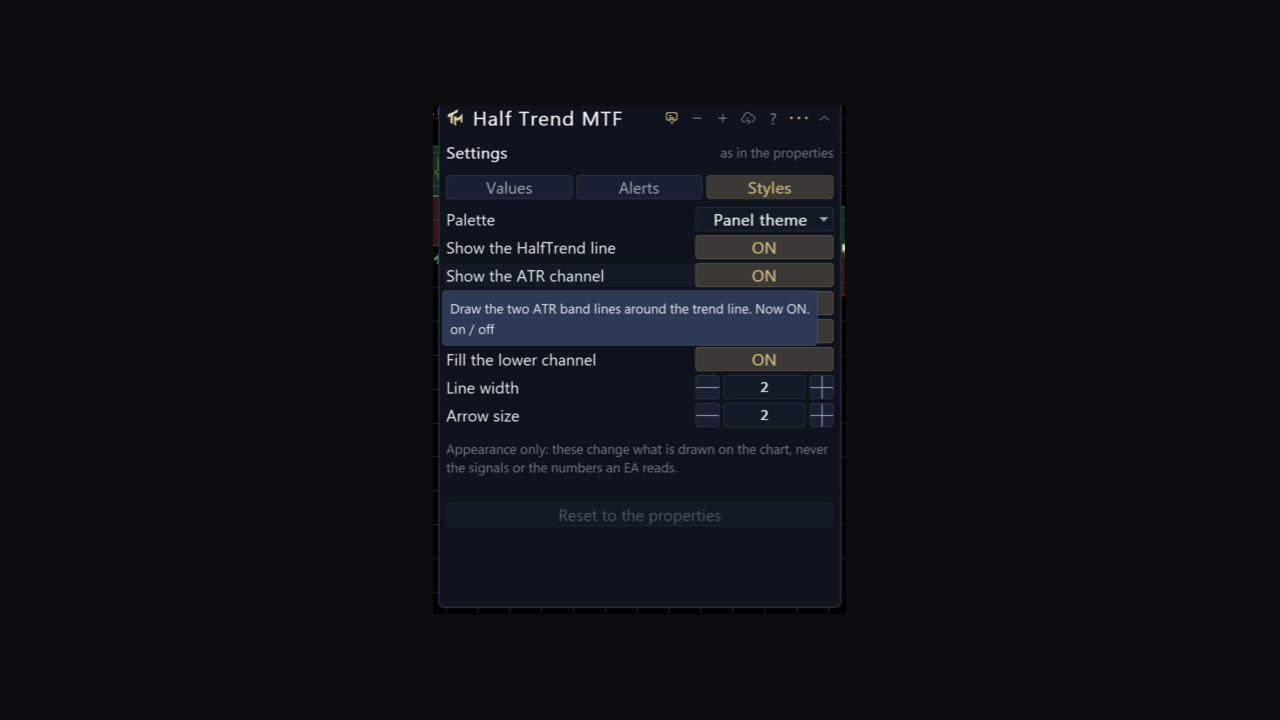
The Alerts tab covers the master switch, the per-event switches, the channels, the cooldown in minutes and a test alert. The Styles tab covers the palette, whether the line, the ATR channel and the arrows are drawn, the two channel fills, each with a switch of its own, the line width and the arrow size; it changes appearance only and never triggers a recomputation.
Three colour schemes: dark, light, and a colour-blind safe one that uses blue and orange rather than red and green. Everything about the panel, including every value changed on the sheet, is stored per chart and survives a timeframe change and a terminal restart. The interface is English.
Alerts
Off out of the box. Three events: a BUY flip, a SELL flip, and a touch of the Half Trend line, which is the pull-back event rather than the reversal event.
Channels: a popup window, a sound, a push to the mobile terminal and e-mail. There are per-event and per-channel switches, and a cooldown that defaults to two hours.
Alerts fire on the last closed bar. Two further alerts, off by default, speak on the forming bar within a chosen number of seconds of its close, and they are labelled early because a flip that exists mid-bar can un-happen. Telegram is not part of this product.
Signals on the forming bar
There is one switch that matters more than the others, and it is in the Values tab as well as in the inputs: whether buffers and arrows are allowed on the bar that is still forming.
With it on, which is the shipped default, you see a flip as soon as the market makes it. Sometimes that flip is undone before the bar closes and the arrow disappears. With it off, nothing is written on the forming bar at all: there is no repaint of any kind, and every signal arrives one bar late by construction.
Both behaviours are legitimate. The product does not pick for you and it does not hide which one it is doing: the panel and the setting name both say so.
Multi-timeframe
The Timeframe setting computes on a higher timeframe and draws the result here. Only closed senior bars are read: a chart bar shows the newest senior bar that had already closed by that chart bar's own close, so the flip lands on the bar that closes together with the senior bar, and nothing is drawn that could not have been known in real time.
The foreign series is built in the background. The first read of it can come back empty, the indicator retries, and the panel says whether it is waiting for a download or looking at a genuine shortage of history. It never fails initialisation over missing bars.
Reading it from an EA
Sixteen buffers, all readable through iCustom and CopyBuffer. Buffer 0, Buy, carries the arrow price on a BUY flip bar and EMPTY_VALUE otherwise, and is not drawn. Buffer 1, Sell, is the same for a SELL flip bar. Buffers 2 to 5 belong to the two channel fills and are display plumbing, not for reading. Buffer 6, Half Trend Up, is the trend line while the trend is up, and buffer 7, Half Trend Down, is the trend line while the trend is down; on a flip bar both hold a value, which is what keeps the drawn line unbroken. Buffer 8, ATR High, is the upper channel band and buffer 9, ATR Low, is the lower one. Buffer 10, BuyMark, and buffer 11, SellMark, are the drawn copies of buffers 0 and 1. Buffer 12, Signal, is +1 on a BUY flip, -1 on a SELL flip and 0 when there is no flip. Buffer 13, Override, counts how many settings were changed from the panel. Buffer 14 is the line as one unbroken series, and buffer 15 is the trend itself, 0 while up and 1 while down, so a strategy never has to infer direction from which line buffer is empty.
Buffers 0 and 1 are the contract: never painted, filled on every pass whatever the Styles tab says, and present in the Data Window. Hiding the arrows cannot starve a strategy of the signal.
An instance created by iCustom is read-only and always uses the parameters you passed. Buffer 13 lets a strategy detect that a chart instance is running on hand-changed numbers.
Provenance
This is a port of "HalfTrend", published on TradingView by everget, which is itself a port of an older MT4 indicator. The algorithm is canonical and originates on MT4. The TradingView script is openly published, which makes a port by formula admissible, and this implementation was reconstructed from the formulas rather than translated line by line.
The product is called Half Trend MTF because Half Trend is the name of the method, not because it claims authorship of it. The original work is the original author's.
Honest limits
With forming-bar signals on, which is the shipped default, an arrow on the current bar can disappear before that bar closes. Turn the setting off and nothing is written on the forming bar at all. Closed bars never change either way.
A stepped trend line flips late by design. In a range it will flip repeatedly, and each flip will be a real flip of the line and a poor trade. Nothing here filters for whether a trend exists.
The ATR channel describes volatility. It is not a target, a stop, or a statement about where price will go.
Amplitude, channel deviation and ATR period all move the flips. Two configurations produce two different sets of arrows and neither is the correct one.
No profit figure, win rate or backtest result is claimed here.