Squeeze Momentum MTF MT4

  • Indicators
  • Evgenii Sutulov
    Evgenii Sutulov
    I build trading indicators, strategies, and dashboards that don't repaint.
    Seven years doing this. MetaTrader 4, MetaTrader 5, TradingView.
    Closed bars only. What you see is what happened.
    The bar being formed never changes a published value.
  • Version: 1.3

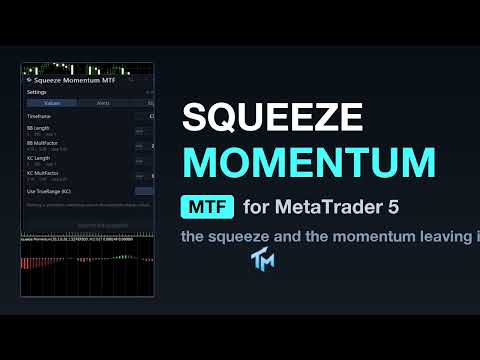
The market goes quiet before it moves, and this window shows both halves of that sentence. Squeeze Momentum MTF marks the bars where Bollinger Bands sit entirely inside the Keltner Channel, prints the exact bar where that compression releases, and colours a momentum histogram so you see which side the stored energy was on when it let go, on this timeframe or a higher one drawn right here. Free, no trial, no locked functions.

The first question it answers is whether the market is compressed. Bollinger Bands are compared with a Keltner Channel: when the Bollinger Bands sit entirely inside the Keltner Channel, volatility has contracted and the market is in a squeeze. When they push back outside it, the squeeze has released.

The second is which way the compressed energy is pointing. A detrended price series is fitted by linear regression and the endpoint of that fit is the momentum histogram. Its sign says the side, and its colour also says whether the current bar is expanding on the previous one or fading against it, so a histogram that is still positive but shrinking reads differently from one that is positive and growing.

The decision it supports: the market has been quiet, it has just stopped being quiet, and here is which side the momentum was on when it did.

What is on the chart

In its own sub-window there are two things. The momentum histogram, in four colours: positive and expanding, positive and fading, negative and expanding, negative and fading. And a row of dots on the zero line, in three states: no squeeze, squeeze on, squeeze just released.

The signal the product publishes is the release: the previous closed bar was in a squeeze and this one is not, with the sign of the momentum saying which way.

The panel

A canvas panel, by default on the price chart rather than crammed into the oscillator pane, though it can be moved into the oscillator pane. Draggable, collapsible, closeable.

It shows the timeframe in force and the Bollinger and Keltner lengths actually being used. It says what the last closed bar is: a bullish squeeze release, a bearish squeeze release, or no release. And it says whether the numbers come from the properties dialog or the panel, and how many were changed.

Below that sit the settings the panel can move, with their values. The gear opens a three-tab sheet.

The Values tab covers the timeframe, the Bollinger length, the Bollinger multiplier, the Keltner length, the Keltner multiplier, and whether the Keltner range uses true range or plain high-low. Each row has steppers, a range and a sentence of help. The Alerts tab covers the master switch, the per-event switches, four channels, the cooldown and a test button. The Styles tab covers the palette, whether the histogram and the squeeze dots are drawn, and the dot size; it changes appearance only.

Three colour schemes, including a colour-blind safe one that uses blue and orange rather than red and green. Panel state and every change made on the sheet persist per chart across a timeframe change and a terminal restart. The interface is English.

Alerts

Off out of the box. The events are a BUY signal and a SELL signal, both meaning a squeeze release with the momentum on that side. Channels: a popup window, a sound, a push to the mobile terminal and e-mail. There is a cooldown per event, two hours by default.

Alerts fire on the last closed bar. Two further alerts, off by default, speak on the forming bar within a chosen number of seconds of its close. They are labelled early because a release that exists mid-bar can be gone by the close. Telegram is not part of this product.

Multi-timeframe

The Timeframe setting computes on a higher timeframe and draws the result here. Only closed senior bars are read: a chart bar shows the newest senior bar that had already closed by that bar's own time, not the one that contains it.

The foreign series is built in the background and the first read of it can return nothing. The indicator retries and the panel says whether it is waiting for a download or short of history. It never fails initialisation over missing bars.

Reading it from an EA

Thirteen buffers, all readable through iCustom. MetaTrader 4 draws only the leading buffers, so the drawn series come first and the readable contract sits behind them. This map is not the MetaTrader 5 edition's map: an EA written against that edition must be re-pointed to the indices below.

Buffers 0 to 3 are the display split of the momentum histogram, one plain histogram per state: positive and expanding, positive and fading, negative and expanding, negative and fading. Buffers 4 to 6 are the display split of the squeeze dot, one row per state: no squeeze, squeeze on, squeeze released. Buffer 7 is Momentum, the linear-regression endpoint of the detrended series, as one continuous series. Buffer 8 is the colour index that goes with it: 0 means up and expanding, 1 up and fading, 2 down and expanding, 3 down and fading. Buffer 9 is Squeeze, the dot as one series, and buffer 10 is its colour index: 0 means no squeeze, 1 squeeze on, 2 squeeze released. Buffer 11 is Signal: +1 when a squeeze has just released bullish, -1 when it has released bearish, 0 when there is no release. Buffer 12 is Override, the number of settings changed from the panel.

The Data Window lists the seven drawn rows, the four histogram columns and the three dot rows. The contract, buffers 7 to 12, does not appear there, and that proves nothing: iCustom reads every index above just the same. This product has no separate Buy and Sell price buffers; the event is buffer 11.

MQL4 has no input groups, so the parameter list an EA passes to iCustom here is shorter than the MetaTrader 5 edition's, and the positions differ. Build the call against this edition's input list, not the other platform's.

The Styles tab hides a plot by taking its colour away, never by emptying a buffer. Buffer 12 lets a strategy tell that a chart instance is running on values changed by hand from the panel; an instance created by iCustom is read-only and always uses the parameters you passed.

Provenance

This is a port of "Squeeze Momentum Indicator [LazyBear]", from the author's own open-source publication. No licence is attached to that publication, which makes a close port of the formulas admissible, and this implementation follows the formulas rather than guessing at them.

The product carries the method's name because that is what it implements. The original work is LazyBear's and no authorship of it is claimed here.

Honest limits

The histogram and the dot on the forming bar are live and will change until that bar closes. A release that shows mid-bar can be absent at the close. Closed bars do not change.

A squeeze release is a statement about volatility, not about direction. The momentum sign tells you which side the energy was on at the moment of release, and that is a description of what has just happened rather than a forecast of what comes next.

A squeeze can also release into nothing. Compression is a necessary condition for an expansion, not a sufficient one.

The Bollinger and Keltner settings move the squeeze detection materially. Widening the Keltner multiplier produces more squeezes, narrowing it produces fewer, and neither configuration is the correct one.

No profit figure, win rate or backtest result is claimed here.
Recommended products
CCI Trend finder
Jose Ramon Miranda Ramos
CCI Trend Finder indicator with different colors at levels 0, 100 and -100. The cross is a signal for "123 Exit" as presented by MPlay and used in Woodies CCI system. This exit signal is effective especially in short-term breakout trades, because it prevents early exiting at small corrections.  This indicator is great for having it as an extra tool for your analysis.
FREE
Ava Ffx Signal
Nirundorn Promphao
The principle of this indicator is very simple: detecting the candlestick pattern in H1 timeframe, then monitoring the return point of graph by using the pullback of High-Low of H1 Candlestick and finally predicting BUY and SELL signal with arrows, alerts and notifications. The parameters are fixed and automatically calculated on each time frame. Example: If you install indicator on XAUUSD, timeframe H1: the indicator will detect the reversal, pullback, price action on this timeframe (for exam
FREE
Donchian channels are a tool in technical analysis used to determine the relative volatility of a market and the potential for price breakouts. Can help identify potential breakouts and reversals in price, which are the moments when traders are called on to make strategic decisions. These strategies can help you capitalize on price trends while having pre-defined entry and exit points to secure gains or limit losses. Using the Donchian channel can thus be part of a disciplined approach to managi
FREE
Wave Reversal Indicator
Vitalyi Belyh
4.33 (3)
Wave Reversal Indicator - determines the direction of trend waves and price reversals. The indicator shows wave movements and trend directions. It gives recommendations where to follow the trader, helps to follow the trading strategy. It is an addition to an intraday or medium-term strategy. Almost all parameters are selected for each time frame and are changed automatically, the only parameter for manual adjustment is the wavelength. Works on various trading instruments and timeframes, recomme
FREE
One Minute Gold
Abdulkarim Karazon
4.69 (13)
-The One Minute Gold is a volume-price action-trend filtered entry arrow signals that help traders take the right side of the market and generates opportunities. CONTACT IN PRIVATE FOR EA VESION. ( POWERFUL PERFORMANCE ARROWS HERE <) Why Chose the One Minute Gold ? 1. TP-SL . With a built-in tp and sl objects that come on chart for each signal so the trader can place tp and sl accordingly, the tp and sl logic has two methods : ATR Tp and Sl - Fixed points Tp-Sl. 2.STATS PANEL … An informative pa
FREE
Williams Precision Prime
Steffen Reinhold Noll
5 (2)
Williams Precision Prime – Precision Meets Legend Williams Precision Prime is a high-performance trend-following indicator that bridges the gap between Larry Williams' time-tested logic and modern algorithmic filtering, all wrapped in the exclusive Peak Precision design. Engineered for traders who demand clarity, stability, and mathematically sound entries, this system utilizes a triple-layer EMA strategy (100, 50, and 21) to identify high-probability "Cross-Momentum" setups within a confirmed d
FREE
Extremum Reverse Bar
Yurij Izyumov
2.8 (5)
This indicator has been created for finding the probable reversal points of the symbol price. A small candlestick reversal pattern is used it its operation in conjunction with a filter of extremums. The indicator is not redrawn! If the extremum filter is disabled, the indicator shows all points that have a pattern. If the extremum filter is enabled, the condition works – if the history Previous bars 1 candles back contains higher candles and they are farther than the Previous bars 2 candle, such
FREE
Smart RSI MT4
Mostafa Saad Saeed Shawara
Product Title Smart RSI (MT4) – part of the SmartView series Short Description A RSI indicator with a unique user experience on MetaTrader platform. Features advanced capabilities not previously available, such as opening settings with double-click, hiding and showing indicators without deleting them, and displaying indicator windows at full chart size. Designed to work seamlessly with the rest of the SmartView Indicators series. Overview The SmartView series offers a unique and distinctive user
FREE
SMC Alpha Oracle PRO is a professional technical analysis tool for the MetaTrader 4 platform, fully automating chart разметка based on the Smart Money Concepts (SMC) methodology. The indicator detects market structure shifts, institutional supply/demand areas, and liquidity pools strictly utilizing mathematical Price Action algorithms. Key Analytical Modules and Logic Market Structure (BOS / CHoCH): Tracks Break of Structure (BOS) and Change of Character (CHoCH) based on customized Swing Hig
FREE
Binary options tester Trading panel to test your strategies according to the rules of binary options. Scope: Set the percentage of profit from the transaction. Set the expiration time in seconds. Set the bet size Set the Deposit amount. Make several deals in a row. Keep track of the time before expiration. The tick chart with trade levels is duplicated to an additional window for accuracy. It allows you to work both in the testing mode and in the real quotes mode. The program gives an idea of bi
FREE
Lowess Channel
Tinashe Ndarimani
5 (1)
MT5 version Overview The Lowess Channel indicator is a smoothed trend-following tool designed to help traders identify the direction of the trend , detect flat or ranging markets , and spot breakouts from consolidation zones. It creates a central smoothed line with upper and lower channel boundaries, adapting to market noise while maintaining clarity. How It Works The indicator builds a channel around a smoothed price line. The central line reflects the current trend. The upper and lower bound
FREE
BoxInside MT4
Evgeny Shevtsov
4.83 (6)
This indicator calculates the volume profile and places labels that correspond to the VAH, VAL and POC levels, for each candle individually. Indicator operation features The indicator works on the timeframes from M5 to MN, but it uses the history data of smaller periods: M1 - for periods from M5 to H1, M5 - for the H4 period, M30 - for the D1 period, H4 - for the W1 period, D1 - for the MN period. The color and location of the VAL, VAH and POC labels on the current candle are considered to be c
FREE
Strength Graph
Zi Feng Ding
5 (1)
This indicator is a tool to measure the relative strength of different currency pairs. It present major currencies strength value base on their relative strength/weakness in custom period of time. Indicator parameters Strength Period - Change the strength period in the settings affects the number of bars used for calculation. The higher the period value, the smoother the indicator lines and the result will represent longer term strength of each currencies, rather than recent strength. Display O
FREE
SuperTrend V
Muhammad Hassaan
*This is TradingView indicator converted to mql4* The SuperTrend V indicator is a popular technical analysis tool used to identify trends and potential trend reversals in financial markets. It is based on the concept of the SuperTrend indicator but incorporates additional features and variations. The SuperTrend V indicator uses a combination of price action and volatility to determine the trend direction and generate trading signals. Here are the key components and features of the indicator: Ca
FREE
Blahtech Moving Average
Blahtech Limited
5 (5)
Blahtech Moving Average indicator is a multitimeframe version of the standard Moving Average indicator. It is also enhanced with customisable alerts, period breaks and other configuration options. The 50 day and 200 day moving averages are widely followed by investors and traders, with breaks above and below the MA lines considered to be signals of interest. Links [  Install  |  Update  |   Training   |   All Products  ] Feature Highlights Up to three timeframes Configurable calculation variabl
FREE
Wave Entry Alerts In Gold
Azad Amanuel Gorgis Gorgis
Wave Entry Alerts In Gold is a custom indicator developed by Azad Gorgis for MetaTrader 4. This indicator is designed to provide alerts based on ZigZag patterns, specifically tailored for trading on the Gold (XAU/USD) symbol. Key Features: - Chart Window Indicator: The indicator is designed to be displayed on the main chart window. - Arrow Signals: The indicator generates arrow signals on the chart, indicating potential reversal points based on ZigZag patterns. - Customizable Parameters: Trade
FREE
AQ TExplorer
HIT HYPERTECH INNOVATIONS LTD
5 (2)
T-Explorer is a Real Time Optimized MetaTrader 4 tool that provides tradable information based on the 10 of the most popular and reliable technical indicators in many timeframes. Our machine learning models calculate the optimum rules and configuration for each indicator in order to provide high probability signals of success. Users are able to customize T-Explorer by selecting suitable timeframes and mode ( FAST, MEDIUM, SLOW ) for the indicators to be used. T-Explorer aggregates and combines o
FREE
SC MTF Rsi MT4
Krisztian Kenedi
5 (1)
Relative Strength Index (RSI) indicator with multi-timeframe support, customizable visual signals, and configurable alert system. Freelance programming services, updates, and other TrueTL products are available on my MQL5 profile . Feedback and reviews are highly appreciated! What is RSI? Relative Strength Index (RSI) is a momentum oscillator that measures the speed and magnitude of price changes. The indicator oscillates between 0 and 100, comparing the magnitude of recent gains to recent lo
FREE
Ava Swan Pro Signal
Nirundorn Promphao
4.5 (2)
The principle of this indicator is very simple: detecting the candlestick pattern in M30 timeframe, then monitoring the return point of graph by using the pullback of High-Low of M5 Candlestick and finally predicting BUY and SELL signal with arrows, alerts and notifications. The parameters are fixed and automatically calculated on each time frame. Example: If you install indicator on XAUUSD, timeframe M5: the indicator will detect the reversal, pullback, price action on this timeframe (for exa
FREE
Check my paid tools they work great and I share Ea's based on them for free please r ate The Dual Timeframe RSI (Relative Strength Index) indicator is a novel trading tool that allows traders to monitor RSI readings from two different timeframes on a single chart. This dual perspective enables traders to identify potential trend confirmations and divergences more effectively. For instance, a trader might use a 1-hour RSI alongside a daily RSI to ensure that short-term trades align with the broa
FREE
CyberZingFx Trend Reversal Lite
Afsal Meerankutty
4.52 (23)
CyberZingFx Trend Reversal is a technical indicator designed to identify potential trend reversals, swing highs, swing lows and changes in market direction. The indicator provides Buy and Sell arrow signals together with exit signals, take profit signals, trend signals, support and resistance levels, scalping signals and price action signals. Confirmed reversal arrow signals do not repaint. Please see the screenshots and video below to understand the different signals displayed by the indicator
FREE
Wave Entry Alerts In EUR
Azad Amanuel Gorgis Gorgis
1 (1)
Wave_Entry_Alerts_In_EUR.mq4 is a custom indicator developed by Azad Gorgis for MetaTrader 4. This indicator is designed to provide alerts based on ZigZag patterns, specifically tailored for trading on the (EUR/USD) symbol. Key Features: - Chart Window Indicator: The indicator is designed to be displayed on the main chart window. - Arrow Signals: The indicator generates arrow signals on the chart, indicating potential reversal points based on ZigZag patterns. - Customizable Parameters: Traders
FREE
Greasy scalper is an indicator for scalping. Shows in which direction now with a high probability there will be a price movement. This may be a movement of several points, or several tens of points. But most likely this movement will happen with a high degree of probability. And the larger the timeframe, the greater the likelihood that the price will go in the direction of the arrow. Knowing this information, we can use it for profit. We can open short trades in the direction of the arrow. As s
FREE
OnTicks
Corentin Petitgirard
2.63 (8)
Now free! Discover the Expert Advisor that never loses and multiplies your profits at lightning speed! Imagine a trading tool that wins at every tick, leaving no room for loss. That’s exactly what our Expert Advisor offers: a cutting-edge algorithm designed to provide you with consistent and rapid profits! Thanks to its market intelligence, it constantly opens positions, capturing every opportunity to maximize your gains. The more you use it, the faster you’ll see your profits skyrocket. Why
FREE
Alert RSI
Richard Waweru
3.71 (7)
Having to check constantly if your RSI has reached a specific level can be tedious and draining at times, especially if you have to monitor different asset classes at a time. The Alert RSI indicator will assist in this task, ensuring that you get the most with little effort. When the RSI values get to a specified level, the alerts will go off, on the chart, on the MT4 phone app or via email (You can receive text messages to your phone if you activate texts on your Gmail account). The indicator d
FREE
Traditional MACD MT4
Daniel Lewis
4.58 (55)
MACD indicator in MetaTrader 4/5 looks different than MACD does in most other charting software. That is because the MetaTrader 4/5 version of MACD displays the MACD line as a histogram when it is traditionally displayed as a line. Additionally, the MetaTrader 4/5 version computes the Signal line using an SMA, while according to MACD definition it is supposed to be an EMA. The MetaTrader 4/5 version also does not compute a true MACD Histogram (the difference between the MACD/Signal lines). This
FREE
After purchasing the Tpx Dash Supply Demand indicator, you must download this indicator which will link and feed market data to the Tpx Dash Supply Demand indicator and will provide all Supply Demand price signals, ATR Stop, VAH and VAL, trend values ​​with the ADX, and POC prices and locations in the market. Just download it and Dash will locate the indicator to retrieve the information!
FREE
ReturnAutoScale
Stanislav Korotky
5 (2)
The indicator calculates running total of linear weighted returns. It transforms rates into integrated and difference-stationary time series with distinctive buy and sell zones. Buy zones are shown in blue, sell zones in red. Parameters: period - number of bars to use for linear weighted calculation; default value - 96; smoothing - period for EMA; default value - 5; mode - an integer value for choosing calculation mode: 0 - long term trading; 1 - medium term trading; 2 - short term trading; defa
FREE
Spread Gold Radar What is Spread Gold Radar? Spread Gold Radar is a lightweight tool that shows your broker's current spread in real time and makes even short, sharp spikes immediately visible on a clean, colour-coded panel. It is built exclusively for Gold (XAUUSD) quoted with 2 decimal places. Why it matters? In Gold scalping especially, the spread often decides whether a trade closes in profit, at a loss, or not at all. The very same trade can run into profit at one broker and into the S
FREE
A trailing stop that never gives ground, and the exact bar it turns. UT Bot MTF draws the ATR stop on your chart, marks every BUY and SELL flip, and then does the part almost no version of it does: it tells you how many signals its filters threw away and which filter threw them, and it warns you, in colour, while the arrow on the current bar can still disappear. Free, no trial, no locked features. The engine is deliberately simple. The stop follows price at a chosen multiple of ATR, ratchets in
FREE
Buyers of this product also purchase
M1 Sniper
Oleg Rodin
5 (29)
M1 SNIPER  is an easy to use trading indicator system. It is an arrow indicator which is designed for M1 time frame. The indicator can be used as a standalone system for scalping on M1 time frame and it can be used as a part of your existing trading system. Though this trading system was designed specifically for trading on M1, it still can be used with other time frames too. Originally I designed this method for trading XAUUSD and BTCUSD. But I find this method helpful in trading other markets
SR Liquidity
Oleg Rodin
5 (2)
SR Liquidity is a trading indicator designed to reveal the hidden zones where market liquidity concentrates and price reacts most strongly. These special liquidity areas act as powerful support and resistance levels, giving you a clear map of where the market is most likely to reverse. Instead of drawing ordinary Support/Resistance lines, SR Liquidity analyzes real price behavior to detect the zones where buying and selling pressure accumulate. These are actually the pools of liquidity that driv
Trend SniperX MT4
Sarvarbek Abduvoxobov
5 (1)
Trend Sniper X is a multi-timeframe trend-following indicator for MetaTrader 5 that helps traders identify trend direction and potential reversal points with clarity and precision. For MT5: https://www.mql5.com/en/market/product/181101 Price Information: The current price is promotional and is subject to change as upcoming updates and new features are released. Code2Profit Channel Master the Market with Multi-Timeframe Analysis! How to Maximize Your Win Rate with Trend Sniper X: Key Rules & Sess
Neuro Poseidon MT4
Daria Rezueva
4.8 (45)
Neuro Poseidon is a new indicator by Daria Rezueva. It combines precise trading signals with adaptive TP/SL levels - creating best possible trades as a result! Message me and get  Neuro Poseidon Assistant  as a gift to automize your trading process! What makes it stand out? 1. Proven profitability on all assets and timeframes 2. Only confirmed BUY and SELL signals present on the chart 3. Adaptive TP & SL levels generated by the software for each trade 4. Easy to understand - suitable for all
This product was   updated   for the   2026 market   and   optimized   for the   latest MT5 builds . PRICE UPDATE NOTICE: Smart Trend Trading System   is currently available for $99. The price will   increase to $199   after the next   30 purchases. SPECIAL OFFER:  After purchasing Smart Trend Trading System, send me a private message to claim the Smart Universal EA for FREE and turn your Smart Trend signals into automated trades. Smart Trend Trading System is a complete non-repainting, non-re
DayTrader PRO MT4
Davit Beridze
4.43 (7)
DayTrader PRO (Buy DayTrader PRO and Get another Paid Self Optimizing indicator for Free as Bonus) MT5:  https://www.mql5.com/en/market/product/186222 DayTrader PRO   is an advanced trading indicator that combines John Ehlers' Laguerre Filter with a powerful Auto-Optimization Engine. Instead of using fixed parameters, the indicator automatically searches for the best settings based on recent market conditions, helping you adapt to changing volatility without constant manual adjustments. The in
Trading Special – 30% OFF Best Solution for any Newbie or Expert Trader! This dashboard software is working on 28 currency pairs plus one. It is based on 2 of our main indicators (Advanced Currency Strength 28 and Advanced Currency Impulse). It gives a great overview of the entire Forex market plus Gold or 1 indices. It shows Advanced Currency Strength values, currency speed of movement and signals for 28 Forex pairs in all (9) timeframes. Imagine how your trading will improve when you can watch
Gann Made Easy
Oleg Rodin
4.84 (172)
Gann Made Easy is a professional and easy to use Forex trading system which is based on the best principles of trading using the theory of W.D. Gann. The indicator provides accurate BUY and SELL signals including Stop Loss and Take Profit levels. You can trade even on the go using PUSH notifications. PLEASE CONTACT ME AFTER PURCHASE TO GET TRADING  INSTRUCTIONS   AND GREAT EXTRA INDICATORS  FOR FREE! Probably you already heard about the Gann trading methods before. Usually the Gann theory is a
KURAMA GOLD SIGNAL PRO (MT4) — 7-Layer Filter, Auto TP/SL, Quality Score & Signal History Save | Complete XAUUSD Trading System No repaint in real time. The moment a signal appears, the arrow, entry, TP and SL are locked on the spot and never move afterward. What you trade is this real-time signal. And in v7.20, every signal that is actually sent is auto-saved and restored exactly after restart. BUYER BONUS Buy the lifetime license and receive AI Zone Radar (
Zoryk Gold mt4
Reda El Koutbane
5 (1)
discount ends soon original price 69 $ ZORYK — Advanced XAUUSD Signal System for MetaTrader 4 You know the feeling. You spend time analyzing gold. You wait for the entry. You finally open the trade, and price immediately moves against you. You close too early, move the Stop Loss, or hesitate for a few seconds. Then the market reaches the exact destination you originally expected without you. The direction was not always the problem. The real problem was uncertainty. You did not know exactl
I have been trading for some time now and always find it a difficulty remembering the timing of the various market opening hours at the other part of the world (especially, when it comes to daylight saving), but could not find any decent indicator online that could help. And it is for this reason that gives birth to this indicator, which I have spent much time, effort and thinking. As many already know that opening of a certain marketplace, depending on which currency pair, has an impact on the
Presenting one-of-a-kind Gann Indicator for XAUUSD IQ Gold Gann Levels is a non-repainting, precision tool designed exclusively for XAUUSD intraday trading. It uses W.D. Gann’s square root method to plot real-time support and resistance levels, helping traders spot high-probability entries with confidence and clarity. William Delbert Gann (W.D. Gann) was an exceptional market analyst whose trading technique was based on a complex blend of mathematics, geometry, astrology, and ancient calculation
CRT Candle Range Theory HTF MT4.   Ultimate CRT Indicator: Advanced ICT Concepts and Malaysian SnR Trading System Master the Market Maker's Footprints with the Most Advanced Candle Range Theory Indicator Unlock the true power of  Smart Money Concepts (SMC)  and trade precisely like the institutions with the  Ultimate CRT Indicator . Built exclusively for serious traders, this indicator automates the highly effective  Candle Range Theory (CRT) , a core pillar of  ICT Concepts (Inner Circle Trader
The elite (V3) multi-indicator suite from JoaquinTrading specifically geared towards Forex & binary options, including regulated exchanges such Nadex, Cantor Exchange, and other binary option brokers. The Probability Tool Suite Elite will provide the given win/loss outcome probabilities of up to 10 strike levels, a specific expiration duration, based on a combination of up to 16 indicators, rules, or conditions and derivative behavior (i.e. expiry, touch, touch & retrace).  Using this indicato
Trading Special –40% OFF Best Solution for any Newbie or Expert Trader! This Indicator is a unique, high quality and affordable trading tool because we have incorporated a number of proprietary features and a new formula. With only ONE chart you can read Currency Strength for 28 Forex pairs! Imagine how your trading will improve because you are able to pinpoint the exact trigger point of a new trend or scalping opportunity? User manual: click here That's the first one, the original! Don't buy a
Advanced Supply Demand
Bernhard Schweigert
4.91 (302)
Trading Special – 30% OFF Best Solution for any Newbie or Expert Trader! This indicator is a unique, high quality and affordable trading tool because we have incorporated a number of proprietary features and a new formula. With this update, you will be able to show double timeframe zones. You will not only be able to show a higher TF but to show both, the chart TF, PLUS the higher TF: SHOWING NESTED ZONES. All Supply Demand traders will love it. :) Important Information Revealed Maximize the pot
Market Reversal Alerts
Lee Samson
4.19 (114)
Profit from market structure changes as price reverses and pulls back. The Market Reversal Alerts indicator identifies when a trend or extended price move is approaching exhaustion, alerts you the moment market structure shifts, and confirms the entry when price re-tests the reversal zone, so you trade defined areas instead of guesses. How it works As price forms new highs or lows near potential exhaustion points, the indicator identifies the breakout and momentum, then draws a rectangle on the
Ace Supply Demand Zone Indicator The concept of supply demand relies on the quantity mismatching between buying and selling volumes in the financial market. Supply and demand zone can provide the good entry and exit. A zone is easier to trade than a line. The supply demand zone can provide the detailed trading plan and the risk management. Its ability to predict market direction is high. There are two distinctive points about Ace Supply Demand Zone Indicator. Ace Supply Demand Zone indicator was
Elliott Wave Principle MT4
Mohamed Amr Mohamed Osama Abdelwahab
**Trade the waves the way the book teaches — not by guesswork.** Meta Trader 5 version can be found at:  https://www.mql5.com/en/market/product/184530?source=Site +Market+My+Products+Page This indicator reads price structure and labels Elliott Wave impulses (1-2-3-4-5) and corrections (A-B-C) automatically, then shows you exactly where the next wave is likely to go and where the book says the trade is. It is built directly on *Elliott Wave Principle — Key to Market Behavior*   by A.J. Frost &
Prop Firm Sniper
Mohamed Hassan
4.33 (6)
Prop Firm Sniper MT4  is a professional market structure indicator that automatically identifies high-probability BUY and SELL opportunities using BOS and CHoCH analysis. Recommended Timeframes: For backtesting, use the indicator on   M5 or M15   for Gold (XAUUSD), and   M15 or H1   for more volatile Forex pairs such as   GBPUSD, USDJPY, EURGBP , and similar markets. CONTACT ME AFTER PURCHASE TO CLAIM YOUR FREE BONUSES! Prop Firm Sniper  is a professional market structure indicator designed t
Dynamic Forex28 Navigator
Bernhard Schweigert
4.43 (7)
Specials Discount now. The Next Generation Forex Trading Tool. Dynamic Forex28 Navigator is the evolution of our long-time, popular indicators, combining the power of three into one: Advanced Currency Strength28 Indicator (695 reviews) + Advanced Currency IMPULSE with ALERT (520 reviews) + CS28 Combo Signals (recent Bonus) Details about the indicator  https://www.mql5.com/en/blogs/post/758844 What Does The Next-Generation Strength Indicator Offer? Everything you loved about the originals, now
Atomic Analyst
Issam Kassas
5 (13)
This product was   updated   for   the 2026 market   and   optimized   for the   latest MT5 builds. PRICE UPDATE NOTICE: Atomic Analyst is currently available for $99. The price will increase to $199 after the next 30 purchases. SPECIAL OFFER:  After purchasing Atomic Analyst, send me a private message to claim the Smart Universal EA for FREE and turn your Atomic Analyst signals into automated trades. Atomic Analyst is a non-repainting, non-redrawing, and non-lagging price action trading indic
Automatically draw support and resistance levels PLUS propulsion candle gaps on your chart, so you can see where price is likely to head next and/or potentially reverse. This indicator is designed to be used as part of the position trading methodology taught on my website (The Market Structure Trader) and displays key information for targeting and potential entries. MT5 version available here:  https://www.mql5.com/en/market/product/97973 There are 2 CORE features in the indicator and 4 addition
Gold Channel is a volatility-based indicator, developed with a specific timing algorithm for the XAUUSD pair, which consists of finding possible corrections in the market. This indicator shows two outer lines, an inner line (retracement line) and an arrow sign, where the theory of the channel is to help identify overbought and oversold conditions in the market. The market price will generally fall between the boundaries of the channel. If prices touch or move outside the channel it is a tradi
BTMM State Engine Pro by G-Labs — Beat The Market Maker indicator for MetaTrader 4. Asian session range, London and New York kill zones, level progression (L1/L2/L3), peak formation detection (PFH/PFL), entry signals, and a multi-pair scanner from one chart. Stop scanning charts one pair at a time. The State Engine tracks the BTMM daily cycle automatically — Asian box, room boundaries, level blocks, peak formations, and filtered entries — while the scanner dashboard shows level, peak status,
PRO Renko System
Oleg Rodin
5 (31)
PRO Renko System is a highly accurate trading system specially designed for trading RENKO charts. The ARROWS and Trend Indicators DO NOT REPAINT! The system effectively neutralizes so called market noise giving you access to accurate reversal signals. The indicator is very easy to use and has only one parameter responsible for signal generation. You can easily adapt the tool to any trading instrument of your choice and the size of the renko bar. I am always ready to provide extra support to help
Special offer :  ALL TOOLS , just   $35   each for a limited time! New tools  will be  $30  for the  first week  or the  first 3 purchases ! Trading Tools Channel on MQL5: Join my MQL5 channel to receive the latest updates Multi-Timeframe & Multi-Symbol Guide:  Multi-Timeframe & Scanner User Guide - Available in 12 Languages See the MT5 version at:  Volume-Trend Order Block MT5 Multi-Timeframe Scanner See the MT4 version at:  Volume-Trend Order Block MT4 Multi-Timeframe Scanner See more product
Apollo Striker is an effective BUY/SELL arrow indicator that predicts the direction of price movement. This indicator is suitable for absolutely all traders, regardless of the preferred strategy or currency pair, time frame. This arrow indicator can be used with absolutely any trading instrument, be it currencies, metals, indices, stocks or even cryptocurrencies. Moreover, a trader can easily adapt the indicator signals for any trading pair and time frame using a special parameter in the indicat
TrendLine PRO MT4
Evgenii Aksenov
4.83 (168)
The Trend Line PRO indicator is an independent trading strategy. It shows the trend change, the entry point to the transaction, as well as automatically calculates three levels of Take Profit and Stop Loss protection. Trend Line PRO is perfect for all Meta Trader symbols: currencies, metals, cryptocurrencies, stocks and indices. The indicator is used in trading on real accounts, which confirms the reliability of the strategy. Robots using   Trend Line PRO   and real Signals can be found here:   
UPD1 Volume BOX
Vitaliy Kuznetsov
4.94 (16)
The indicator displays the horizontal volume profile in the specified area (BOX) and the maximum volume (POC). Product Features. 1. You can use ticks or just price. 2. Adaptive grid spacing (M1-MN). 3. Adaptive high volume (median) search step depending on box size. 4. Automatic chameleon color for box lines and buttons. 5. Multiple boxes, easy to create and delete. 6. 70% volume area (enable in settings). 7. There is an alert for touching the maximum horizontal volume line (POC). 8. VWAP. 9. C
More from author
QQE Mod Scanner is two products in one file. The first is the QQE Mod oscillator itself, in this chart's own sub-window: two independent QQE blocks over RSI, reduced to one histogram, a trailing line drawn around zero and a Bollinger filter on that line. The state it publishes is the combination of the two, bright when both blocks agree on a direction and grey when they do not. The second is a board that runs the same calculation across a list of symbols on several timeframes at once. The board
Squeeze Momentum Scanner is two products in one file. The first is Squeeze Momentum MTF itself, in this chart's own sub-window: the momentum histogram coloured by expansion and fading, and the row of squeeze dots that says whether the Bollinger Bands are inside the Keltner Channel, outside it, or have just come out. The price increases every 10 purchases, the next price is $39 The second is a board that runs the same calculation across a list of symbols on several timeframes at once. A squeeze
UT Bot MTF
Evgenii Sutulov
UT Bot MTF is an ATR trailing stop and the flip signals it produces. The stop follows price at a distance of a chosen multiple of ATR, ratchets in the direction of the move and never gives ground back. When price closes through it, the stop flips to the other side and the indicator marks a BUY or a SELL. That is the whole engine, and it is deliberately simple. What this product adds around it is the part that decides whether you can actually use it: four independent filters, an honest account of
FREE
Currency Strength Pro ranks the eight major currencies by relative strength, read from up to 28 pairs, on a multi-timeframe composite, then ranks the basket's own pairs into a graded scanner. Closed bars only, never on a tick. Launch price: $59. It rises to $69 after the next 10 copies, then step by step to the final $98.  The idea is simple: trade a strong currency against a weak one, instead of the chart that happens to look nice today. The strength table answers "which currency". The scanner
Half Trend MTF draws a stepped trend line that holds its level until the market takes it out, and flips to the other side when it does. Around it sits an ATR channel. The decision it supports is a simple one, and it is stated plainly: the line says which side the trend is currently held on, the flip says the moment that changed, and the channel says how much room the current volatility gives price before the flip is likely to matter. Because the line only moves when the extremes of the last N ba
FREE
Nadaraya Watson Envelope MTF draws a smooth centre line through price and an envelope around it, then marks the bars where price came back inside that envelope after having traded outside it. The question it answers is narrow and it is the only one it claims to answer: price has stretched away from its own recent centre, and it has just stopped stretching. Whether you treat that as a mean-reversion entry, as a place to take profit on a trend position, or as nothing at all is your decision. The i
FREE
QQE Mod MTF
Evgenii Sutulov
QQE Mod MTF is a momentum oscillator in its own sub-window. It runs two independent QQE blocks over RSI and turns them into one readable histogram. QQE, which stands for Qualitative Quantitative Estimation, smooths RSI and then builds a trailing band around it from the smoothed average of the RSI's own absolute changes. The band does not move against the trend, which is what makes a QQE cross slower and less noisy than an RSI cross. This product runs two of those blocks at once and publishes wha
FREE
Wave Trend Oscillator MTF is a two-line momentum oscillator in its own sub-window. The fast line measures how far the typical price has run from its own smoothed centre, relative to its recent average deviation, and a slower average of that fast line is drawn beside it. The event is a cross between the two lines inside a zone the market has actually reached. Crosses in the middle of the range are not signals, and that single rule is what separates this product from a plain oscillator. Three thin
FREE
Currency Strength Flux ranks the eight major currencies by relative strength, read from up to 28 pairs, on a four-timeframe composite that only ever uses closed bars. The idea is simple: trade a strong currency against a weak one, instead of the chart that happens to look nice today. Everything on the panel serves that one decision. What it does The panel ranks EUR, GBP, AUD, NZD, USD, CAD, CHF and JPY from strongest to weakest. Every reading is built from the pairs your broker actually quotes.
FREE
Squeeze Momentum MTF answers two questions at once, in one sub-window. The first is whether the market is compressed. Bollinger Bands are compared with a Keltner Channel: when the Bollinger Bands sit entirely inside the Keltner Channel, volatility has contracted and the market is in a squeeze. When they push back outside it, the squeeze has released. The second is which way the compressed energy is pointing. A detrended price series is fitted by linear regression and the endpoint of that fit is
FREE
Currency Strength Flux ranks the eight major currencies by relative strength, read from up to 28 pairs, on a four-timeframe composite that only ever uses closed bars. The idea is simple: trade a strong currency against a weak one, instead of the chart that happens to look nice today. Everything on the panel serves that one decision. What it does The panel ranks EUR, GBP, AUD, NZD, USD, CAD, CHF and JPY from strongest to weakest. Every reading is built from the pairs your broker actually quotes.
FREE
A trailing stop that never gives ground, and the exact bar it turns. UT Bot MTF draws the ATR stop on your chart, marks every BUY and SELL flip, and then does the part almost no version of it does: it tells you how many signals its filters threw away and which filter threw them, and it warns you, in colour, while the arrow on the current bar can still disappear. Free, no trial, no locked features. The engine is deliberately simple. The stop follows price at a chosen multiple of ATR, ratchets in
FREE
Exhaustion Count MTF counts. It does not predict direction and it does not tell you which way to trade. It answers one question: has this move been going on long enough that it is running out of participants. Two independent phases run on the chart, a setup and a countdown, each with its own rules, its own cancellation conditions and its own place in the buffers an Expert Advisor can read. The setup Nine consecutive closes on one side of the close four bars back, started by a price flip. A bar t
FREE
A trend line that refuses to wander. Half Trend MTF holds its level while the market pushes at it and flips only when the extremes of the last N bars actually take it out, so it sits still through the chop that makes a moving average look like a signal generator. Around it an ATR channel shows how much room today's volatility gives price before that flip is likely to matter. Free, no trial, no locked features. The decision it supports is a simple one, and it is stated plainly: the line says whic
FREE
Momentum you can read at a glance, and a product that tells you when it is not sure. QQE Mod MTF runs two independent QQE blocks over RSI and prints one histogram: bright when both blocks agree on a direction, grey when they do not. That grey is the point. Most oscillators give you a colour on every bar and leave you to guess how much it is worth; this one says out loud when there is no confirmation. Free, no trial, no locked features. QQE, which stands for Qualitative Quantitative Estimation, s
FREE
An oscillator that ignores every cross in the middle of the range. Wave Trend Oscillator MTF publishes a cross only when it happens inside a zone the market has actually reached, grades it by how deep that zone was, finds divergences on the fast line and can draw them on the price chart where you trade, and it can compute all of this on a higher timeframe while you watch your own. Free, no trial, no locked functions. The fast line measures how far the typical price has run from its own smoothed
FREE
A kernel regression that does not repaint, which is the whole point. Nadaraya Watson Envelope MTF draws a smooth centre line through price and an error envelope around it, marks the bars where price came back inside after stretching out, and computes every bar from the bars behind it only, so a closed bar never moves. The usual charting-site version of this line is fitted two-sided and rewrites itself under your feet; this one is causal by construction. Free, no trial, no locked functions. The q
FREE
An arrow tells you to buy. Obsidian Scalper Pro tells you where to buy, where the stop goes, where the three targets are, how big the position should be for your risk, and how good the setup is out of 100. Every signal arrives as a finished trade plan drawn on the chart, and a built in statistics window shows the honest result of the last hundred of them, win rate with a confidence interval and all. Every decision is made on a closed bar, so the history you are looking at is the history you woul
Nine closes, thirteen counts, and the discipline most implementations quietly drop. Exhaustion Count MTF runs the classic setup and countdown pair with the full cancellation and recycling rules, marks the perfected nines, leaves the Setup Barrier levels on the chart, and never prints a number on a bar that has not closed, so nothing here repaints, ever. Free, no trial, no locked functions. It counts. It does not predict direction and it does not tell you which way to trade. It answers one questi
FREE
A nine or a thirteen is rare on any one chart, and that is precisely why a watch list beats chart-hopping. Exhaustion Count Scanner runs the full setup and countdown method, cancellation and recycling rules included, across your symbol list on up to eight timeframes at once, prints every running count with the count it is heading for, and marks the rows where the timeframes agree. Out of the box it scans fifteen pairs; one setting raises that to twenty-eight. The counts also draw on the chart in
Twenty-eight symbols, four timeframes, one screen, and the trade already on the chart under it. Half Trend Scanner runs the stepped trend line across your whole watchlist, sorts the board by what flipped most recently, and tells you in one column how many timeframes agree on each symbol. Every cell it could not measure explains itself in words instead of going blank, so an empty board is never a mystery. The price increases by $10 every 10 purchases. It is two products in one file. The first is
Mean reversion is a numbers game, and the numbers live on more charts than you can watch. Nadaraya Watson Envelope Scanner runs a causal, non-repainting kernel regression envelope across your symbol list on up to four timeframes at once, prints every re-entry with its age, and marks the rows where the timeframes agree. Out of the box it scans fifteen pairs; one setting raises that to twenty-eight. The envelope itself draws on the chart in front of you, so you act on what the table found without
Twenty-eight symbols on four timeframes at once, and a board that admits when momentum is not confirmed. QQE Mod Scanner runs two independent QQE blocks over RSI across your whole watchlist, prints in every cell which way momentum turned and how many bars ago, and writes flat where the two blocks do not agree instead of colouring the cell anyway. The AGREE column tells you how many timeframes stand on the same side, and the oscillator itself is drawn in the sub-window under the table, so the mom
A squeeze release lasts a few bars and never waits for you to cycle through charts. Squeeze Momentum Scanner watches your symbol list on up to four timeframes at once, prints the exact bar each compression let go and which side the momentum was on, and marks the rows where the timeframes agree. Out of the box it scans fifteen pairs; one setting raises that to twenty-eight. The oscillator itself draws in this chart's sub-window, so you act on what the table found without attaching a second indica
Watch twenty-eight symbols on four timeframes at once, and see the trade on the chart in the same breath. UT Bot Scanner runs the ATR trailing stop across your whole watchlist, sorts the board by what flipped most recently, tells you how many timeframes agree on each symbol, and draws the indicator itself on the chart under the table, so the moment the board finds something you are already looking at it. Every cell that could not be measured explains itself in words instead of going blank. The p
One glance instead of twenty-eight charts. Wave Trend Oscillator Scanner runs the Wave Trend calculation across your symbol list on up to four timeframes at once, prints every fresh cross with its age and its grade, and marks the rows where the timeframes actually agree. Out of the box it scans fifteen pairs; one setting raises that to twenty-eight. And the oscillator itself draws in this chart's sub-window, so you act on what the table found without attaching a second indicator. The price incre
Currency Strength Pro ranks the eight major currencies by relative strength, read from up to 28 pairs, on a multi-timeframe composite, then ranks the basket's own pairs into a graded scanner. Closed bars only, never on a tick. Launch price: $59. It rises to $69 after the next 10 copies, then step by step to the final $98.  The idea is simple: trade a strong currency against a weak one, instead of the chart that happens to look nice today. The strength table answers "which currency". The scanner
Nadaraya Watson Envelope Scanner is two products in one file. The first is Nadaraya Watson Envelope itself, drawn on the chart you are looking at: a causal Nadaraya-Watson kernel regression centre line, an envelope built from the mean absolute error around it, and marks where price came back inside the envelope after having traded outside it. The price increases every 10 purchases, the next price is $39 The second is a board that runs the same calculation over a list of symbols on several time
Exhaustion Count Scanner is two products in one file. The first is Exhaustion Count MTF itself, drawn on the chart in front of you: the setup and countdown numbers printed bar by bar, the Setup Barrier levels currently in force, and the arrows on completed signals. The second is a board that runs the same counting across a list of symbols on up to eight timeframes at once. A nine or a thirteen is a rare event on any one instrument, which is exactly the case a board is for. The table finds them a
Wave Trend Oscillator Scanner is two products in one file. The first is the Wave Trend oscillator itself, in this chart's own sub-window: the fast and slow wave lines and the histogram of their difference, coloured by whether momentum is expanding or fading, with divergence lines that can also be drawn on the price chart itself. The second is a board that runs the same calculation across a list of symbols on several timeframes at once. This is one of the two products in the family where the grad
Filter:
No reviews
Reply to review