Nadaraya Watson Envelope MTF
- Indicators
-
Evgenii Sutulov
 Premium components
1. https://www.mql5.com/en/market/product/201632 - Rotation Manager Console - Version: 1.3
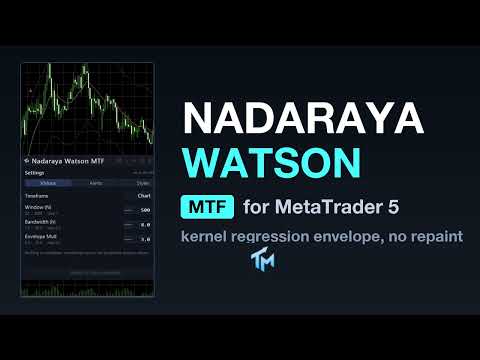
Nadaraya Watson Envelope MTF draws a smooth centre line through price and an envelope around it, then marks the bars where price came back inside that envelope after having traded outside it.
The question it answers is narrow and it is the only one it claims to answer: price has stretched away from its own recent centre, and it has just stopped stretching. Whether you treat that as a mean-reversion entry, as a place to take profit on a trend position, or as nothing at all is your decision. The indicator locates the event, it does not rate it.
How the line is built
The centre line is a Nadaraya-Watson kernel regression: every bar is a weighted average of the bars behind it, with a Gaussian weight that falls off with distance. The envelope sits a chosen number of mean absolute errors above and below that centre, so it widens when price has been noisy around the line and tightens when it has been obedient.
The estimate is causal. Bar i is computed from bars i, i-1, i-2 and back, and never from a bar to its right. That is a deliberate departure from how kernel regression is usually shown on charting sites, where the fit is two-sided and the line moves under your feet as new bars arrive. Here the centre line, once a bar has closed, does not change.
What is on the chart
The centre line is coloured by its own slope, one colour while it is rising and another while it is falling. The upper and lower envelope are drawn as dotted bands. BUY and SELL marks appear on the bars where price re-entered the envelope, placed below the low and above the high respectively.
It draws in the price window, over the candles.
The panel
A canvas panel on the chart, movable by dragging it, collapsible, closeable. It carries three lines of live text: the timeframe the maths is actually running on together with the window and bandwidth in force; what the last closed bar did, meaning the centre value and either a BUY return, a SELL return, or no re-entry; and where the numbers came from, the properties dialog or the panel, and how many of them were changed by hand.
Below that sits every setting the panel can move, with its current value. A changed value is highlighted so you can see at a glance that the chart is not running on the defaults.
The settings sheet
The gear opens a settings sheet with three tabs.
Values holds the four things that can move a signal: the timeframe, the window N, the bandwidth h and the envelope multiplier. Each row has minus and plus steppers, a legal range, and a sentence explaining what moving it does. A counter at the top says how many of the four are no longer what the properties dialog says, and a single button puts them all back.
Alerts holds the master switch, the per-event switches, the four channels, and the cooldown in minutes, plus a button that sends a test alert through every channel that is on.
Styles holds appearance only: palette, whether the centre line, the envelope and the arrows are drawn, line width and arrow size. Nothing on this tab recomputes anything. Hiding the centre line does not stop it being calculated, alerting, or being readable by an EA.
Three colour schemes: dark, light, and a colour-blind safe scheme that uses blue and orange and never puts red against green. The scheme button is in the panel header and the chart palette can be set to follow it.
Panel position, scheme, collapsed state and every value changed on the sheet are stored per chart and survive a timeframe change and a terminal restart. The interface is English.
Alerts
Off out of the box. The master switch ships in the off position, so attaching the indicator makes no noise until you ask it to.
Events: a BUY signal, a SELL signal. Channels: popup window, sound, push notification to the mobile terminal, e-mail. Each event and each channel has its own switch, and a cooldown, two hours by default, stops the same event repeating.
Alerts fire on the last closed bar. There are also two optional forming-bar alerts, off by default, that speak while the current bar is still open and only within a chosen number of seconds of its close. They are labelled as early on the panel and in the inputs for a reason: a re-entry that exists mid-bar can stop existing before the bar closes.
Telegram is not part of this product.
Multi-timeframe
The Timeframe setting makes the indicator compute on a higher timeframe and draw the result on the chart you are looking at. It reads only closed senior bars: the value a chart bar shows is the newest senior bar that had already closed by that chart bar's own time, not the senior bar that happens to contain it. The bar that contains it is still forming and is not knowable in real time.
The BUY and SELL marks land on the single chart bar where the senior bar changed. The centre line, the envelope and the slope are held across the whole span of the senior bar, which is what gives the stepped staircase look.
A foreign timeframe is built by the terminal in the background, and the first read of it can legitimately come back empty. The indicator retries once a second and says on the panel whether it is waiting for a download or looking at a real shortage of history. It never fails initialisation over missing bars.
Reading it from an EA
Every buffer is available through iCustom and CopyBuffer, and the two signal buffers are at the front so a strategy does not have to count.
Buffer 0, Buy, holds the price of the BUY mark on a signal bar and EMPTY_VALUE otherwise; buffer 1, Sell, is the same for the SELL mark. Buffer 2, Center, is the kernel regression centre line, and buffer 3 is the colour index that goes with it. Buffer 4, Upper, and buffer 5, Lower, are the two envelope edges. Buffers 6 and 7, BuyMark and SellMark, are the drawn copies of buffers 0 and 1. Buffer 8, Signal, reads +1 for a re-entry from below, -1 for a re-entry from above and 0 for none. Buffer 9, Slope, is +1 while the centre is rising and -1 while it is falling. Buffer 10, Override, reports how many settings were changed from the panel.
Buffers 0 and 1 are the contract. They are not painted, they are filled on every pass whatever the Styles tab is set to, and they appear in the Data Window. The arrows you see on the chart are copies at index 6 and 7, kept in step with the contract. Turning the arrows off can therefore never starve an EA of a signal.
Buffer 10 exists so an EA can tell that the numbers it is reading were not computed on the parameters it passed in. Note that only an instance genuinely attached to a chart can be driven from the panel: an instance created by iCustom is read-only and always follows the parameters you gave it.
Honest limits
The mark on the current, unfinished bar can appear and then disappear. Price is inside the envelope while the bar is open and outside it at the close, and the mark goes away. Once a bar has closed, its mark and its lines do not change.
This is not a strategy. There is no exit rule, no position sizing, no stop placement and no filter for whether the market is in a state where mean reversion is a reasonable idea. In a strong trend price can sit outside the envelope for a long time and every re-entry it eventually produces will be against that trend.
No profit figure, win rate or backtest result is claimed here, and none should be inferred.
On a higher timeframe the earliest bars of the chart may have no senior bar that had already closed, and those are left empty on purpose.
The kernel window is a bar count. On a short history, or on a symbol whose history your broker does not carry, the line starts where there are enough bars to compute it and not before.