Currency Strength Flux MT4

  • Indicators
  • Evgenii Sutulov
    Evgenii Sutulov
    I build trading indicators, strategies, and dashboards that don't repaint.
    Seven years doing this. MetaTrader 4, MetaTrader 5, TradingView.
    Closed bars only. What you see is what happened.
    The bar being formed never changes a published value.
  • Version: 1.4
  • Updated: 13 September 2026

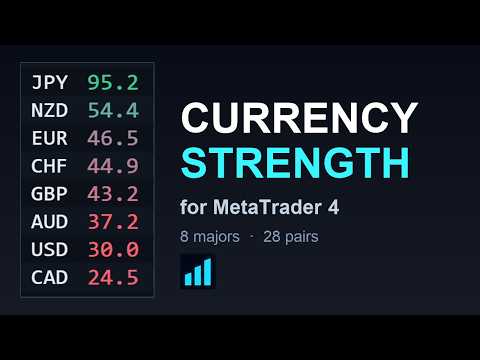
Currency Strength Flux ranks the eight major currencies by relative strength, read from up to 28 pairs, on a four-timeframe composite that only ever uses closed bars.

The idea is simple: trade a strong currency against a weak one, instead of the chart that happens to look nice today. Everything on the panel serves that one decision.

What it does

The panel ranks EUR, GBP, AUD, NZD, USD, CAD, CHF and JPY from strongest to weakest. Every reading is built from the pairs your broker actually quotes. Each pair adds to one side and subtracts from the other, so the eight scores always centre on 50 and the basket is zero-sum by construction.

50 is the basket average, not a fixed level. A score of 70 does not mean the currency is strong in absolute terms; it means it is strong relative to the other seven right now.

Closed bars only

A number printed on the panel cannot change afterwards.

Rates are read from position 1, so the bar being formed is never part of a published value, and the buffer slot for the current bar is left empty. The panel recomputes when the fastest weighted timeframe closes a bar, plus a slow safety interval. Never on a tick.

The footer names the exact bar the numbers came from, in server time, so you can check any reading against your own chart at any moment.

The four-timeframe composite

Four timeframes are averaged with fixed weights: M15 at 15 percent, H1 at 35 percent, H4 at 35 percent and D1 at 15 percent. A currency that is strong on one timeframe and weak on three does not reach the top of the table.

The history behind the panel is anchored to time, not to bar number. Each point is tied to a closed bar of the fastest timeframe, and every other timeframe contributes the last bar that had closed by that moment. This is why the lines in the subwindow stop moving once they are drawn.

Volatility normalisation

Raw returns are divided by ATR before they enter the basket. A 40 point move in a yen cross and a 40 point move in EURCHF are not the same event, and without normalisation the yen crosses would dominate the ranking on volatility alone.

What the columns mean

  • SCORE - relative strength, where 50 is the basket average. 30 to 70 is the usual range.
  • BREADTH - the share of the basket this currency gained against, over the same timeframes as SCORE.
  • SLOPE - the score now minus the score N closed bars ago, so you can see whether strength is building or fading.
  • TREND - per timeframe, the direction most of that currency's pairs point. A filter, not a strength reading.
  • HISTORY - a sparkline of the recent closed bars, at its own fixed reach, so the column stays readable however deep the subwindow history is set.

Pair scanner

Under the table sit the pairs with the widest strength gaps, each with a direction and a SETUP value: the gap discounted by how much the four timeframes disagree about it. A pair that every timeframe agrees on keeps most of its gap; a pair the timeframes argue about loses much of it.

A marker flags a pair whose price keeps extending while the strength gap behind it is already closing.

Click a pair to open that symbol on the chart. Click a currency to list its own pairs, widest gap first.

The eight strength lines

The same eight scores plotted over time in the subwindow, on a fixed 0 to 100 scale, so the same height always means the same reading on any chart and on any day. Two hundred closed bars by default, which is a little over two days of session time on the standard settings.

The two currencies of the chart symbol are lit automatically: open GBPJPY and the panel shows GBP and JPY. Click a currency chip under the subwindow to show or hide any line by hand, and that choice stays with the symbol you made it on. Move to another instrument and it lights that instrument's own two currencies again.

Broker symbols

Suffixes and prefixes are detected from the chart symbol, and a broker suffix input overrides the detection when needed. Candidate symbols are checked against the base and profit currency the broker declares, so a decorated look-alike is never mistaken for the real pair.

If your broker does not quote a cross at all, it is priced through its USD legs and the row is marked accordingly. Only the symbols the chosen basket actually reads are switched on in Market Watch.

The basket is yours

Any of the eight currencies can be switched off. The basket shrinks to N*(N-1)/2 pairs and every count on the panel is measured against that number, not against a fixed 28. Four currencies enabled means six pairs, and the header says six.

Interface

Drag the panel from anywhere, including the rows that are themselves clickable: what decides is whether the hand moved, not what sat under it. Dark and light themes. Two layouts, the full board or the strength table on its own. English and Russian, following the terminal language.

Clicking a scanner row switches the chart symbol, and the panel comes back exactly as you left it. Position, theme and layout all survive the switch, per chart.

Alerts

Eight events on the strength meter itself: a currency entering or leaving the strong or weak band, a currency crossing the basket midline, a new strongest or weakest currency, both ends flipping at once, momentum turning, the chart symbol's own side flipping, the basket spreading out or collapsing, and coverage breaking or coming back. Every one of them is an edge, a change between two states, so nothing rings on every bar of a move that has already been announced.

Popup, sound, push and email, any combination. A cooldown is kept per event, so one currency crossing a band does not silence an unrelated one for the same five minutes. The first pass after attaching only records what it sees; it never greets a chart opened mid-session with an alert about a setup that has been sitting there for hours.

Settings live on their own screen behind the bell icon, with a SAVE button and a file that outlives the chart, so the same alerts follow you from one chart to the next.

Inputs

The names below are exactly as they appear in the Inputs tab.

Main

  • History depth - how many closed bars the subwindow lines carry, from 8 to 512. Default 200.
  • Panel size - percent of the default size. Default 120, raise it to 150 on a 4K screen.

Engine: how strength is measured

  • Lookback - closed bars compared when measuring a move. Default 5.
  • ATR period - period of the volatility normaliser. Default 14.
  • ATR floor - lower bound on ATR as a fraction of price, which keeps a dead market from producing huge normalised moves. Default 0.0005.
  • Score spread - lower values give more contrast between currencies. Default 1.0.
  • Slope - closed bars looked back for the SLOPE column, counted on the heaviest timeframe. Default 3.
  • Slope dead zone - score points below which SLOPE is treated as flat. Default 1.5.
  • Min basket pairs - how many pairs a currency needs before it is scored at all. Default 5.
  • Strong from this score and Weak below this score - where a currency starts being shown as strong or weak. Defaults 62 and 38.

TREND column

  • TREND column: fast EMA and slow EMA - the pair of averages behind the per-timeframe trend filter. Defaults 20 and 50.
  • TREND flat zone - the EMA gap, in ATR units, below which a timeframe counts as flat rather than trending. Default 0.15.

Pair scanner

  • Minimum strength gap for a scanner row - how wide the gap must be before a pair is listed. Default 10.
  • A timeframe agrees from this gap - the gap at which a timeframe counts as agreeing with the setup. Default 2.

Symbols and basket

  • Broker suffix - leave blank to detect it from the chart symbol.
  • Include EUR ... in the basket - one switch per currency, all eight on by default. Switching one off removes it from the basket and from every count.

Interface and performance

  • Interface language - Auto, English or Russian. Auto follows the terminal.
  • Start layout - Full, or the strength table on its own. Also the panel buttons 1 and 2.
  • Draw the 8 strength lines in the subwindow - turn the lines off to keep the panel alone.
  • Timer tick, Pairs processed per timer tick and Safety rescan - how the workload is spread out. The defaults suit a normal terminal and rarely need changing.

What it is not

This is an instrument and direction filter. It is not an entry signal and it is not a forecast. It tells you which currency is being bought and which is being sold, and leaves the entry, the stop and the target to your own method.

Requirements

Works on any broker that quotes the majors, on any chart symbol and any chart timeframe. The eight strength values are published as indicator buffers, so an Expert Advisor can read them through iCustom.

Strategy Tester note: only the tested symbol is simulated tick by tick. The other majors are read from whatever the terminal already has in Market Watch when the test starts, not from a synchronised backtest, so the panel can report a pair as missing inside the tester even on a broker that carries it live. Add every basket pair to Market Watch before starting a test, and treat any reading produced inside the tester as a preview, not a validated backtest.
Recommended products
Show Pips
Roman Podpora
4.27 (59)
This information indicator will be useful for those who always want to be aware of the current situation on the account. The indicator displays data such as profit in points, percentage and currency, as well as the spread for the current pair and the time until the bar closes on the current timeframe. VERSION MT5 - More useful indicators There are several options for placing the information line on the chart: 1. To the right of the price (runs behind the price); 2. As a comment (in the upper

FREE
FFx Force Index
Eric Venturi-Bloxs
5 (1)
The purpose of this new version of the MT4 standard indicator provided in your platform is to display in a sub-window multiple timeframes of the same indicator. See the example shown in the picture below. But the display isn’t like a simple MTF indicator. This is the real display of the indicator on its timeframe. Here's the options available in the FFx indicator: Select the timeframes to be displayed (M1 to Monthly) Define the width (number of bars) for each timeframe box Alert pop up/sound/ema
FREE
FFx RVI
Eric Venturi-Bloxs
5 (1)
The purpose of this new version of the MT4 standard indicator provided in your platform is to display in a sub-window multiple timeframes of the same indicator. See the example shown in the picture below. But the display isn’t like a simple MTF indicator. This is the real display of the indicator on its timeframe. Here's the options available in the FFx indicator: Select the timeframes to be displayed (M1 to Monthly) Define the width (number of bars) for each timeframe box Alert pop up/sound/ema
FREE
Multi TF MA Levels
Luke Anthony Caras
Multi-TF MA Levels plots a single moving average across multiple timeframes directly on your chart, giving you instant context at every level of the market. No switching charts. No mental maths. Just clean, flat lines showing exactly where the MA sits on M15, M30, H1, H4 and D1 — all updated on confirmed bar close so there is no repainting. Features Plots the local timeframe MA plus up to 5 higher timeframe MAs simultaneously HTF lines only update on confirmed bar close — no repainting Higher ti
FREE
The tool that will help you calculate the lot accurately for the risk you need, if you want to risk 1% of your account, just enter the entry, target and stop values ​​ and you will have the lot size to use and only lose the chosen percentage. You can also choose a fixed value. This tool will help you with consistency, because you can only be consistent if you operate consistently and enter with fixed loss values, it is an INFALLIBLE way to be consistent!!!!
FREE
FFx MACD
Eric Venturi-Bloxs
4.2 (5)
The purpose of this new version of the MT4 standard indicator provided in your platform is to display in a sub-window multiple timeframes of the same indicator. See the example shown in the picture below. But the display isn’t like a simple MTF indicator. This is the real display of the indicator on its timeframe. Here's the options available in the FFx indicator: Select the timeframes to be displayed (M1 to Monthly) Define the width (number of bars) for each timeframe box Alert pop up/sound/ema
FREE
FFx Awesome Oscillator
Eric Venturi-Bloxs
4 (1)
The purpose of this new version of the MT4 standard indicator provided in your platform is to display in a sub-window multiple timeframes of the same indicator. See the example shown in the picture below. But the display isn’t like a simple MTF indicator. This is the real display of the indicator on its timeframe. Here's the options available in the FFx indicator: Select the timeframes to be displayed (M1 to Monthly) Define the width (number of bars) for each timeframe box Alert pop up/sound/ema
FREE
Discover the power of precision and efficiency in your trading with the " Super Auto Fibonacci " MT4 indicator. This cutting-edge tool is meticulously designed to enhance your technical analysis, providing you with invaluable insights to make informed trading decisions. Key Features: Automated Fibonacci Analysis: Say goodbye to the hassle of manual Fibonacci retracement and extension drawing. "Super Auto Fibonacci" instantly identifies and plots Fibonacci levels on your MT4 chart, saving you tim
FREE
WONNFX INFOLINE   MT4   is a lightweight informational indicator that displays key trading data directly on your chart. In a single line, it shows your current floating profit/loss in pips, deposit currency, and percentages, as well as the spread and time remaining until the current bar closes. This indicator is ideal for traders who need a concise yet comprehensive snapshot of their open positions in real-time, without cluttering the chart. Key Features Display of Floating Profit/Loss: In   pip
FREE
Austin Currency Strength
Augustine Kamatu
5 (1)
Check out other great products from  https://www.mql5.com/en/users/augustinekamatu/seller   This indicator is the best so far at determining the currency strength of each pair. It provides stable values and is highly adaptive to market changes. It is a great tool to add to your arsenal to make sure you are on the right side of the trend at all times. No inputs required, it is simple plug and play. A Winning Trading Strategy This article describes the components and logic needed to develop a tra
FREE
The Matrix Arrow Indicator Multi Timeframe Panel MT4 is a free add on and a great asset for your Matrix Arrow Indicator MT4 . It shows the current Matrix Arrow Indicator MT4 signal for 5 user customized timeframes and for 16 modifiable symbols/instruments in total. The user has the option to enable/disable any of the 10 standard indicators, that the Matrix Arrow Indicator MT4 consists of. All of the 10 standard indicators attributes are also adjustable, as in the Matrix Arrow Indicator MT4 . The
FREE
Email Drawdown Alert
Roman Starostin
5 (12)
Free informative Indicator-helper. It'll be usefull for traders who trade many symbols or using grid systems (Averaging or Martingale). Indicator counts drawdown as percent and currency separate. It has a number of settings: Count deposite drawdown according equity value and send e-mail or notifications to user if DD more than set; Sending e-mail when max open orders reached; Shows price and remaining pips amount before MarginCall on current chart and Account generally; Display summary trade lot
FREE
This indicator alerts you when/before new 1 or 5 minute bar candle formed. In other words,this indicator alerts you every 1/5 minutes. This indicator is especially useful for traders who trade when new bars formed. *This indicator don't work propery in strategy tester.Use this in live trading to check functionality. There is more powerful Pro version .In Pro version,you can choose more timeframe and so on. Input Parameters Alert_Or_Sound =Sound ----- Choose alert or sound or both to notify y
FREE
Trendline indicator
David Muriithi
2 (1)
Are you tired of drawing trendlines every time you're analyzing charts? Or perhaps you would like more consistency in your technical analysis. Then this is for you. This indicator will draw trend lines automatically when dropped on a chart. How it works Works similar to standard deviation channel found on mt4 and mt5. It has 2 parameters: 1. Starting Bar 2. Number of bars for calculation The   starting bar   is the bar which drawing of the trend lines will begin, while the   number of bars for c
FREE
FFx DeMarker
Eric Venturi-Bloxs
5 (2)
The purpose of this new version of the MT4 standard indicator provided in your platform is to display in a sub-window multiple timeframes of the same indicator. See the example shown in the picture below. But the display isn’t like a simple MTF indicator. This is the real display of the indicator on its timeframe. Here's the options available in the FFx indicator: Select the timeframes to be displayed (M1 to Monthly) Define the width (number of bars) for each timeframe box Alert pop up/sound/ema
FREE
A simple indicator showing the size of the spread at the current time, the maximum for the day and the maximum for the entire duration of the indicator. Daily statistics of the maximum spread are also displayed, indicating the time when this spread was fixed. The location of the display of the received information can be changed depending on your preferences and positioned anywhere on the screen. It is possible to output alerts about exceeding the size of the spread specified in the input pa
FREE
SuperTrend V
Muhammad Hassaan
*This is TradingView indicator converted to mql4* The SuperTrend V indicator is a popular technical analysis tool used to identify trends and potential trend reversals in financial markets. It is based on the concept of the SuperTrend indicator but incorporates additional features and variations. The SuperTrend V indicator uses a combination of price action and volatility to determine the trend direction and generate trading signals. Here are the key components and features of the indicator: Ca
FREE
Trend MA Candles
Claus Dietrich
4.14 (7)
COLORED TREND MA / MACD CANDLES draw MA Candles above/below Moving Average in a single color draw MA as a leading Line like a Supertrend draw MA as a Channel => MA High and Low draw MACD Candles above and below 0 and Signal-Line Your  Advantage: a simple view of the trend direction a simple view over the higher trend direction a calmer chart for the eye clear rules can be defined Settings: Bars to process : 6000 is my default, this value is up to you Value Quick-Set : pre-Settings MACD 12 / 26
FREE
Shadow Flare MT4
Kestutis Balciunas
Shadow Flare Indicator is a non-repainting trend & liquidity tool for MetaTrader 4. It runs a configurable moving-average baseline (HMA, EMA, SMA, or RMA) wrapped in an Average True Range envelope and produces a sticky trend state that only flips when price closes through the upper or lower band. The same trend engine drives an automatic supply/demand zone module that detects pivot highs and pivot lows, draws coloured boxes around them, and mitigates each zone the moment price closes through it.
FREE
Trend Quorum MT4
Kestutis Balciunas
Trend Quorum   is an adaptive trend-following indicator that combines a dynamic SuperTrend engine with a proprietary Trend Quality Index (TQI) and 3 optional confluence filters. Signals only fire when enough independent factors "vote" in agreement — like a quorum. Check MT5 version at:  Trend Quorum MT5 See more products at:   All P roducts For live examples and new tools, visit my profile and send a Friend request so you don’t miss updates! How It Works Adaptive SuperTrend Engine Unlike standar
FREE
HMA Trend
Pavel Zamoshnikov
4.56 (72)
A trend indicator based on the Hull Moving Average (HMA) with two periods. The Hull Moving Average is an improved variant of the moving average, which shows the moment of trend reversal quite accurately. It is often used as a signal filter. Combination of two types of Hull Moving Averages makes a better use of these advantages: HMA with a slow period identifies the trend, while HMA with a fast period determines the short-term movements and signals in the trend direction. Features The movement d
FREE
Free automatic Fibonacci is an indicator that automatically plots a Fibonacci retracement based on the number of bars you select on the BarsToScan setting in the indicator. The Fibonacci is automatically updated in real time as new highest and lowest values appears amongst the selected bars. You can select which level values to be displayed in the indicator settings. You can also select the color of the levels thus enabling the trader to be able to attach the indicator several times with differe
FREE
FFx Fractals
Eric Venturi-Bloxs
4.5 (2)
The purpose of this new version of the MT4 standard indicator provided in your platform is to display in a sub-window multiple timeframes of the same indicator. See the example shown in the picture below. But the display isn’t like a simple MTF indicator. This is the real display of the indicator on its timeframe. Here's the options available in the FFx indicator: Select the timeframes to be displayed (M1 to Monthly) Define the width (number of bars) for each timeframe box Alert pop up/sound/ema
FREE
Follow The Line
Oliver Gideon Amofa Appiah
3.94 (16)
FOLLOW THE LINE GET THE FULL VERSION HERE: https://www.mql5.com/en/market/product/36024 This indicator obeys the popular maxim that: "THE TREND IS YOUR FRIEND" It paints a GREEN line for BUY and also paints a RED line for SELL.  It gives alarms and alerts of all kinds. IT DOES NOT REPAINT and can be used for all currency pairs and timeframes. Yes, as easy and simple as that. Even a newbie can use it to make great and reliable trades. NB: For best results, get my other premium indicators for more
FREE
FFx Volumes
Eric Venturi-Bloxs
3.5 (2)
The purpose of this new version of the MT4 standard indicator provided in your platform is to display in a sub-window multiple timeframes of the same indicator. See the example shown in the picture below. But the display isn’t like a simple MTF indicator. This is the real display of the indicator on its timeframe. Here's the options available in the FFx indicator: Select the timeframes to be displayed (M1 to Monthly) Define the width (number of bars) for each timeframe box Alert pop up/sound/ema
FREE
Wise Men Indicator demo
Bohdan Kasyanenko
3 (2)
The indicator displays signals according to the strategy of Bill Williams on the chart. Demo version of the indicator has the same features as the paid, except that it can work only on a demo account . Signal "First Wise Man" is formed when there is a divergent bar with angulation.  Bullish divergent bar - with lower minimum and closing price in the upper half. Bearish divergent bar - higher maximum and the closing price at the bottom half. Angulation is formed when all three lines of Alligator
FREE
FFx Bears Power
Eric Venturi-Bloxs
5 (1)
The purpose of this new version of the MT4 standard indicator provided in your platform is to display in a sub-window multiple timeframes of the same indicator. See the example shown in the picture below. But the display isn’t like a simple MTF indicator. This is the real display of the indicator on its timeframe. Here's the options available in the FFx indicator: Select the timeframes to be displayed (M1 to Monthly) Define the width (number of bars) for each timeframe box Alert pop up/sound/ema
FREE
Sm Ichimoku Scanner
Steeve Christian Martol
5 (5)
Multi Time Frame Indicator acts as a Scanner based on the Ichimoku Trading System. The outcome is displayed on a board. This helps you to make "at a glance" a mental picture of the System without having to open the chart. Up to 10 Currencies can be watched. Scanned elements And Legend "KUMO Futur" - Green : The Kumo Futur is Bullish. "KUMO Futur" - Red : The Kumo Futur is Bearish. "PRICE Cross KJ" - Green : The Price is Above the Kijun Sen.  "PRICE Cross KJ" - Red : The Price is Below the Kijun
FREE
Lines Profit Loss
Taras Slobodyanik
4.63 (16)
The indicator displays profit (loss) on the current symbol. You can freely drag and drop the line to display the current profit or loss. You can find my products here Parameters Calculation in money or in points — calculate the profit/loss in points or money. Add pending orders to calculate — take pending orders into account in calculations. Magic Number (0 - all orders on symbol) — magic number, if it is necessary to evaluate specific orders. Offset for first drawing (points from the average pr
FREE
The Flower Indicator is a technical analysis tool primarily used to identify trends and assist with scalping or intraday trading strategies. The Flower Indicator is a signal trend indicator based on technical and price dynamics analysis. It visually signals trends using colored flowers—blue flowers indicate an uptrend , while red flowers indicate a downtrend Each levels can act like support & resistance ( watch for +/- 200 levels & the dots when appear on the chart ) You can set the dots to appe
FREE
Buyers of this product also purchase
Trend SniperX MT4
Sarvarbek Abduvoxobov
5 (3)
Trend Sniper X is a multi-timeframe trend-following indicator for MetaTrader 5 that helps traders identify trend direction and potential reversal points with clarity and precision. For MT5: https://www.mql5.com/en/market/product/181101 Price Information: The current price is promotional and is subject to change as upcoming updates and new features are released. Code2Profit Channel Master the Market with Multi-Timeframe Analysis! How to Maximize Your Win Rate with Trend Sniper X: Key Rules & Sess
Zoryk Gold mt4
Reda El Koutbane
5 (2)
discount ends soon original price 69 $ ZORYK — Advanced XAUUSD Signal System for MetaTrader 4 You know the feeling. You spend time analyzing gold. You wait for the entry. You finally open the trade, and price immediately moves against you. You close too early, move the Stop Loss, or hesitate for a few seconds. Then the market reaches the exact destination you originally expected without you. The direction was not always the problem. The real problem was uncertainty. You did not know exactl
SR Liquidity
Oleg Rodin
5 (2)
SR Liquidity is a trading indicator designed to reveal the hidden zones where market liquidity concentrates and price reacts most strongly. These special liquidity areas act as powerful support and resistance levels, giving you a clear map of where the market is most likely to reverse. Instead of drawing ordinary Support/Resistance lines, SR Liquidity analyzes real price behavior to detect the zones where buying and selling pressure accumulate. These are actually the pools of liquidity that driv
Tokyo mt4 Indicator
Vasiliy Strukov
5 (2)
Tokyo Indicator provides a clear visual overview of trend direction, potential trading signals, and market conditions. Its colour-coded, stepped trend line distinguishes bullish phases in blue from bearish phases in magenta. Matching directional arrows highlight potential buying and selling opportunities when the displayed trend changes. An integrated dashboard brings together the current signal, market bias, momentum, volatility, and signal quality in one convenient view. This allows traders t
Gann Made Easy
Oleg Rodin
4.84 (172)
Gann Made Easy is a professional and easy to use Forex trading system which is based on the best principles of trading using the theory of W.D. Gann. The indicator provides accurate BUY and SELL signals including Stop Loss and Take Profit levels. You can trade even on the go using PUSH notifications. PLEASE CONTACT ME AFTER PURCHASE TO GET TRADING  INSTRUCTIONS   AND GREAT EXTRA INDICATORS  FOR FREE! Probably you already heard about the Gann trading methods before. Usually the Gann theory is a
Miraculous Indicator Binary & Forex v3 StrategySafe Miraculous Indicator Binary & Forex v3 StrategySafe is a professional trading indicator designed for traders who want clear signals, powerful confirmation tools, and a structured way to analyze both Binary and Forex markets. This version brings a stronger trading experience with advanced dashboards, GANN Law analysis, Square of 9 levels, angle confirmation, and a clean StrategySafe approach that helps traders filter stronger setups instead of e
PTS Precision Index Oscillator V2
PrecisionTradingSystems
5 (1)
The Precision Index Oscillator (Pi-Osc) by Roger Medcalf of Precision Trading Systems First of all, if you have any questions please contact me via my website which you can find by searching the above title. Version 2 has been carefully recoded to be super fast to load up on your chart and some other technical improvements have been incorporated to enhance experience. Pi-Osc was created to provide accurate trade timing signals designed to find extreme   exhaustion points, the points that markets
Currency Strength Wizard is a very powerful indicator that provides you with all-in-one solution for successful trading. The indicator calculates the power of this or that forex pair using the data of all currencies on multiple time frames. This data is represented in a form of easy to use currency index and currency power lines which you can use to see the power of this or that currency. All you need is attach the indicator to the chart you want to trade and the indicator will show you real str
CRT Candle Range Theory HTF MT4 - Ultimate CRT Indicator: Advanced ICT Concepts and Malaysian SnR Trading System Master the Market Maker's Footprints with the Most Advanced Candle Range Theory Indicator. Unlock the true power of Smart Money Concepts (SMC) and trade precisely like the institutions with the Ultimate CRT Indicator. Built exclusively for serious traders, this indicator automates the highly effective Candle Range Theory (CRT), a core pillar of ICT Concepts (Inner Circle Trader), and
M1 Sniper
Oleg Rodin
4.97 (30)
M1 SNIPER  is an easy to use trading indicator system. It is an arrow indicator which is designed for M1 time frame. The indicator can be used as a standalone system for scalping on M1 time frame and it can be used as a part of your existing trading system. Though this trading system was designed specifically for short-term trading, it still can be helpful for all traders. This trading system can be used with any forex pair and time frame, though lower time frames are recommended from M1 up to M
PRO Renko System
Oleg Rodin
5 (31)
PRO Renko System is a highly accurate trading system specially designed for trading RENKO charts. The ARROWS and Trend Indicators DO NOT REPAINT! The system effectively neutralizes so called market noise giving you access to accurate reversal signals. The indicator is very easy to use and has only one parameter responsible for signal generation. You can easily adapt the tool to any trading instrument of your choice and the size of the renko bar. I am always ready to provide extra support to help
Scalper Vault
Oleg Rodin
5 (39)
Scalper Vault is a professional scalping system which provides you with everything you need for successful scalping. This indicator is a complete trading system which can be used by forex and binary options traders. The recommended time frame is M5. The system provides you with accurate arrow signals in the direction of the trend. It also provides you with top and bottom signals and Gann market levels. The indicator provides all types of alerts including PUSH notifications. PLEASE CONTACT ME AFT
Trading Special – 40% OFF Best Solution for any Newbie or Expert Trader! This indicator is a unique, high quality and affordable trading tool because we have incorporated a number of proprietary features and a secret formula. With only ONE chart it gives Alerts for all 28 currency pairs. Imagine how your trading will improve because you are able to pinpoint the exact trigger point of a new trend or scalping opportunity! Built on new underlying algorithms it makes it even easier to identify and c
PZ Swing Trading
PZ TRADING SLU
5 (4)
Protect against whipsaws: revolutionize your swing trading approach Swing Trading is the first indicator designed to detect swings in the direction of the trend and possible reversal swings. It uses the baseline swing trading approach, widely described in trading literature. The indicator studies several price and time vectors to track the aggregate trend direction and detects situations in which the market is oversold or overbought and ready to correct. [ Installation Guide | Update Guide | Tro
Introduction to Fractal Pattern Scanner Fractal Indicator refers to the technical indicator that makes use of the fractal geometry found in the financial market. Fractal Pattern Scanner is the advanced Fractal Indicator that brings the latest trading technology after the extensive research and development work in the fractal geometry in the financial market. The most important feature in Fractal Pattern Scanner is the ability to measure the turning point probability as well as the trend probabi
This is a professional chart indicator designed for traders focused on stability and clear price action. It helps filter market noise and provides clear visual entry and exit zones for your trading decisions. Core Features: Strictly Non-Repainting: The system is built with strict non-repaint logic. What you see on the chart is the true historical performance. Confirmed Signals: Signals are triggered and confirmed only after the candle closes . Once a trading arrow appears on a closed candle, it
Apollo SR Master is a Support/Resistance indicator with special features which make trading with Support/Resistance zones easier and more reliable. The indicator calculates Support/Resistance zones in real-time without any time lag by detecting local price tops and bottoms. Then to confirm the newly formed SR area, the indicator shows special signal which signalizes that the SR zone can be taken into consideration and used as an actual SELL or BUY signal. In this case the strength of the SR zone
Trend Catcher ind
Ramil Minniakhmetov
5 (11)
TREND CATCHER INDICATOR Trend Catcher Indicator analyzes market price movements, using a combination of the author’s proprietary and customized adaptive trend-analysis indicators.  It identifies the true market direction by filtering out short-term noise and focusing on underlying momentum strength, volatility expansion, and price structure behavior.  It also uses a combination of smoothing and trend-filtering customized indicators such as moving averages, RSI, and volatility filters.   Real ope
DayTrader PRO MT4
Davit Beridze
4.6 (10)
DayTrader PRO (Buy DayTrader PRO and Get another Paid Self Optimizing indicator for Free as Bonus) MT5:  https://www.mql5.com/en/market/product/186222 DayTrader PRO   is an advanced trading indicator that combines John Ehlers' Laguerre Filter with a powerful Auto-Optimization Engine. Instead of using fixed parameters, the indicator automatically searches for the best settings based on recent market conditions, helping you adapt to changing volatility without constant manual adjustments. The in
Smart Trend Trading System is a chart indicator for MetaTrader 4 that brings trend information, entry and exit signals, and price levels into one workspace. It combines 10+ trading tools into one system, including trend detection, reversal zones, smart cloud, trailing stop logic, support and resistance, candle coloring, alerts, and multi-timeframe analysis. The system is designed to help you trade different market conditions: Trending markets: Identify the main trend, detect pullbacks, follow mo
Top Bottom Tracker is an indicator based on sophisticated algorithms that analyse the market trend and can detect the highs and lows of the trend / MT5 version . The price will progressively increase until it reaches 500$. Next price --> $99 Features No repainting This indicator does not change its values when new data arrives Trading pairs All forex pairs Timeframe     All timeframes Parameters ==== Indicator configuration ==== Configuration parameter // 40 (The higher the value, the
KURAMA GOLD SIGNAL PRO (MT4) — 7-Layer Filter, Auto TP/SL, Quality Score & Signal History Save | Complete XAUUSD Trading System No repaint in real time. The moment a signal appears, the arrow, entry, TP and SL are locked on the spot and never move afterward. What you trade is this real-time signal. And in v7.20, every signal that is actually sent is auto-saved and restored exactly after restart. BUYER BONUS Buy the lifetime license and receive AI Zone Radar (
Quantum Breakout Indicator PRO
Bogdan Ion Puscasu
4.96 (26)
Introducing   Quantum Breakout PRO , the groundbreaking MQL5 Indicator that's transforming the way you trade Breakout Zones! Developed by a team of experienced traders with trading experience of over 13 years, Quantum Breakout PRO is designed to propel your trading journey to new heights with its innovative and dynamic breakout zone strategy. Quantum Breakout Indicator will give you signal arrows on breakout zones with 5 profit target zones and stop loss suggestion based on the breakout box. I
ARTEMIS SUB WINDOW REVERSAL SYSTEM The ARTEMIS Sub Window Reversal System is a powerful, non-repainting Forex indicator designed to identify high-probability reversal trades using a combination of Smart Money Concepts and stochastic momentum analysis. Built for traders who want precision entries, this indicator combines liquidity sweep detection, market structure shifts, and momentum confirmation into one clean and professional trading tool. WHY THIS INDICATOR STANDS OUT Most indicators generate
Introducing the POWER TRADE Indicator Created by a small group of experienced traders with years of profitable experience in the financial markets, the Power Trade Indicator is a plug-and-play trading tool designed to help traders spot high-quality setups with ease and confidence. What It Does: It provides powerful entry signals, profit-taking zones, and rebound areas — giving you a complete view of where price action is most likely to move next. The indicator reacts in real time, al
Master the Market Open with the Ultimate Opening Range Breakout (ORB) Indicator for MT4! The Opening Range Breakout (ORB) is one of the most powerful and time-tested day trading strategies used by professional traders worldwide. This indicator completely automates the process of identifying, mapping, and tracking the opening ranges for the three major forex sessions (Asian, London, and New York), giving you a massive edge in catching explosive daily moves. For Free EA ORB Download Here: https://
Introduction Harmonic Patterns are best used to predict potential turning point. Traditionally, Harmonic Pattern was identified manually connecting peaks and troughs points in the chart. Manual harmonic pattern detection is painfully tedious and not suitable for everyone. You are often exposed under subjective pattern identification with manual pattern detection. To avoid these limitations, Harmonic Pattern Plus was designed to automate your harmonic pattern detection process. The functionality
Volume Break Oscillator is an indicator that matches price movement with volume trends in the form of an oscillator. I wanted to integrate volume analysis into my strategies but I have always been disappointed by most volume indicators, such as OBV, Money Flow Index, A/D but also as Volume Weighted Macd and many others. I therefore wrote this indicator for myself, I am satisfied with how useful it is, and therefore I decided to publish it on the market. Main features: It highlights the phase
Scalper Inside PRO
Alexey Minkov
4.74 (69)
Scalper Inside PRO helps you read the intraday trend and plan a trade before you enter the market. It is built around three exclusive strategies for a sharper read of the market. The moment a signal appears, the indicator evaluates market direction and calculates the key levels, so you see the potential entry, the expected stop-loss and several profit-taking levels in advance. Detailed performance statistics show how different instruments and strategies performed in history and help you pick ass
PZ Trend Trading
PZ TRADING SLU
4.8 (5)
Capture every opportunity: your go-to indicator for profitable trend trading Trend Trading is an indicator designed to profit as much as possible from trends taking place in the market, by timing pullbacks and breakouts. It finds trading opportunities by analyzing what the price is doing during established trends. [ Installation Guide | Update Guide | Troubleshooting | FAQ | All Products ] Trade financial markets with confidence and efficiency Profit from established trends without getting whips
More from author
An average without the lag, and a band that refuses to flip the trend on a quiet bar. Zero-Lag Trend MTF feeds the average price plus its own recent change, which removes most of the delay, then wraps it in a band whose width is the highest ATR of the recent past rather than the current one, so a lull cannot turn the trend around. The side changes only on a break of the band, never on a touch. It is free: no trial, no locked features, no upgrade page. A zero lag average removes delay by feeding
FREE
Signals from your Telegram channels, copied to MetaTrader 4 and MetaTrader 5 within seconds. TradingMind Signal Bridge reads the channels and groups you choose, recognises each signal with fast built in rules, hands the messy ones to an AI model, including signals posted as screenshots, and passes the order to an expert advisor on your terminal. A news filter, prop firm account protection and a Telegram bot for remote control keep the decision about what gets traded with you. What this product i
Alpha Trend MTF
Evgenii Sutulov
3 (1)
A trailing stop line that asks where the money is going before it decides which side to hold. Alpha Trend MTF builds its trail from ATR and lets money flow choose the side, then takes its signals from the line crossing its own copy two bars back, which is what keeps it quiet in a chop that shakes ordinary trailing stops out. Signals from a higher timeframe can be drawn on any chart, and only closed senior bars are read. It is free: no trial, no locked features, no upgrade page. Two trail levels
FREE
Half Trend MTF draws a stepped trend line that holds its level until the market takes it out, and flips to the other side when it does. Around it sits an ATR channel. The decision it supports is a simple one, and it is stated plainly: the line says which side the trend is currently held on, the flip says the moment that changed, and the channel says how much room the current volatility gives price before the flip is likely to matter. Because the line only moves when the extremes of the last N ba
FREE
Know before you take the trade how much of today's move is already gone. ADR Levels MTF prints the two prices a normal day can still reach, marks the bar where the range was fully spent, and puts the per cent already used on the panel, so a late entry stops looking like a fresh one. It builds its days from the bars of the chart you are on, which means the same numbers on M5 and on H4 and no second data feed to wait for. It is free: no trial, no locked features, no upgrade page. The average daily
FREE
Nadaraya Watson Envelope MTF draws a smooth centre line through price and an envelope around it, then marks the bars where price came back inside that envelope after having traded outside it. The question it answers is narrow and it is the only one it claims to answer: price has stretched away from its own recent centre, and it has just stopped stretching. Whether you treat that as a mean-reversion entry, as a place to take profit on a trend position, or as nothing at all is your decision. The i
FREE
UT Bot MTF
Evgenii Sutulov
UT Bot MTF is an ATR trailing stop and the flip signals it produces. The stop follows price at a distance of a chosen multiple of ATR, ratchets in the direction of the move and never gives ground back. When price closes through it, the stop flips to the other side and the indicator marks a BUY or a SELL. That is the whole engine, and it is deliberately simple. What this product adds around it is the part that decides whether you can actually use it: four independent filters, an honest account of
FREE
A fear index for instruments that do not have one. Williams Vix Fix MTF measures how far below the recent highest close a bar's low fell, which is the thing a VIX gives an index, and opens a panic zone when that reading clears its own Bollinger band or comes close to its own recent high. Larry Williams built it to find capitulation, and this port adds the mirrored side so a board can show both. It is free: no trial, no locked features, no upgrade page. The gauge is one subtraction: how far below
FREE
One line, six weighted averages deep, that changes direction instead of crossing something. Cascade WMA Trend MTF chains six weighted moving averages whose periods grow the way a Fibonacci sequence does, which smooths the result far past what a single average of the same length would do, and takes its signal from the finished line turning. Any higher timeframe can be drawn on any chart, closed senior bars only. It is free: no trial, no locked features, no upgrade page. Six weighted moving averag
FREE
The average price everyone who entered after the last swing is holding, drawn without you having to click an anchor. Anchored VWAP MTF finds the last confirmed swing itself, runs the volume weighted average from there, and puts deviation bands around it so a retest can be told from a breakaway. There is no calendar in it anywhere, so it behaves the same on any symbol and any broker session. It is free: no trial, no locked features, no upgrade page. The volume weighted average price is accumulate
FREE
A trend line that refuses to wander. Half Trend MTF holds its level while the market pushes at it and flips only when the extremes of the last N bars actually take it out, so it sits still through the chop that makes a moving average look like a signal generator. Around it an ATR channel shows how much room today's volatility gives price before that flip is likely to matter. Free, no trial, no locked features. The decision it supports is a simple one, and it is stated plainly: the line says whic
FREE
A trailing stop that never gives ground, and the exact bar it turns. UT Bot MTF draws the ATR stop on your chart, marks every BUY and SELL flip, and then does the part almost no version of it does: it tells you how many signals its filters threw away and which filter threw them, and it warns you, in colour, while the arrow on the current bar can still disappear. Free, no trial, no locked features. The engine is deliberately simple. The stop follows price at a chosen multiple of ATR, ratchets in
FREE
Wave Trend Oscillator MTF is a two-line momentum oscillator in its own sub-window. The fast line measures how far the typical price has run from its own smoothed centre, relative to its recent average deviation, and a slower average of that fast line is drawn beside it. The event is a cross between the two lines inside a zone the market has actually reached. Crosses in the middle of the range are not signals, and that single rule is what separates this product from a plain oscillator. Three thin
FREE
QQE Mod MTF
Evgenii Sutulov
QQE Mod MTF is a momentum oscillator in its own sub-window. It runs two independent QQE blocks over RSI and turns them into one readable histogram. QQE, which stands for Qualitative Quantitative Estimation, smooths RSI and then builds a trailing band around it from the smoothed average of the RSI's own absolute changes. The band does not move against the trend, which is what makes a QQE cross slower and less noisy than an RSI cross. This product runs two of those blocks at once and publishes wha
FREE
A kernel regression that does not repaint, which is the whole point. Nadaraya Watson Envelope MTF draws a smooth centre line through price and an error envelope around it, marks the bars where price came back inside after stretching out, and computes every bar from the bars behind it only, so a closed bar never moves. The usual charting-site version of this line is fitted two-sided and rewrites itself under your feet; this one is causal by construction. Free, no trial, no locked functions. The q
FREE
Currency Strength Pro ranks the eight major currencies by relative strength, read from up to 28 pairs, on a multi-timeframe composite, then ranks the basket's own pairs into a graded scanner. Closed bars only, never on a tick. The idea is simple: trade a strong currency against a weak one, instead of the chart that happens to look nice today. The strength table answers "which currency". The scanner and its A/B/C grade answer "which pair, and how clean is the setup". What it does The panel ranks
Momentum you can read at a glance, and a product that tells you when it is not sure. QQE Mod MTF runs two independent QQE blocks over RSI and prints one histogram: bright when both blocks agree on a direction, grey when they do not. That grey is the point. Most oscillators give you a colour on every bar and leave you to guess how much it is worth; this one says out loud when there is no confirmation. Free, no trial, no locked features. QQE, which stands for Qualitative Quantitative Estimation, s
FREE
An oscillator that ignores every cross in the middle of the range. Wave Trend Oscillator MTF publishes a cross only when it happens inside a zone the market has actually reached, grades it by how deep that zone was, finds divergences on the fast line and can draw them on the price chart where you trade, and it can compute all of this on a higher timeframe while you watch your own. Free, no trial, no locked functions. The fast line measures how far the typical price has run from its own smoothed
FREE
Squeeze Momentum MTF answers two questions at once, in one sub-window. The first is whether the market is compressed. Bollinger Bands are compared with a Keltner Channel: when the Bollinger Bands sit entirely inside the Keltner Channel, volatility has contracted and the market is in a squeeze. When they push back outside it, the squeeze has released. The second is which way the compressed energy is pointing. A detrended price series is fitted by linear regression and the endpoint of that fit is
FREE
Nine closes, thirteen counts, and the discipline most implementations quietly drop. Exhaustion Count MTF runs the classic setup and countdown pair with the full cancellation and recycling rules, marks the perfected nines, leaves the Setup Barrier levels on the chart, and never prints a number on a bar that has not closed, so nothing here repaints, ever. Free, no trial, no locked functions. It counts. It does not predict direction and it does not tell you which way to trade. It answers one questi
FREE
The market goes quiet before it moves, and this window shows both halves of that sentence. Squeeze Momentum MTF marks the bars where Bollinger Bands sit entirely inside the Keltner Channel, prints the exact bar where that compression releases, and colours a momentum histogram so you see which side the stored energy was on when it let go, on this timeframe or a higher one drawn right here. Free, no trial, no locked functions. The first question it answers is whether the market is compressed. Boll
FREE
Exhaustion Count MTF counts. It does not predict direction and it does not tell you which way to trade. It answers one question: has this move been going on long enough that it is running out of participants. Two independent phases run on the chart, a setup and a countdown, each with its own rules, its own cancellation conditions and its own place in the buffers an Expert Advisor can read. The setup Nine consecutive closes on one side of the close four bars back, started by a price flip. A bar t
FREE
QQE Mod Scanner is two products in one file. The first is the QQE Mod oscillator itself, in this chart's own sub-window: two independent QQE blocks over RSI, reduced to one histogram, a trailing line drawn around zero and a Bollinger filter on that line. The state it publishes is the combination of the two, bright when both blocks agree on a direction and grey when they do not. The second is a board that runs the same calculation across a list of symbols on several timeframes at once. The board
Squeeze Momentum Scanner is two products in one file. The first is Squeeze Momentum MTF itself, in this chart's own sub-window: the momentum histogram coloured by expansion and fading, and the row of squeeze dots that says whether the Bollinger Bands are inside the Keltner Channel, outside it, or have just come out. The second is a board that runs the same calculation across a list of symbols on several timeframes at once. A squeeze release is a short-lived event and it happens on different inst
An arrow tells you to buy. Obsidian Scalper Pro tells you where to buy, where the stop goes, where the three targets are, how big the position should be for your risk, and how good the setup is out of 100. Every signal arrives as a finished trade plan drawn on the chart, and a built in statistics window shows the honest result of the last hundred of them, win rate with a confidence interval and all. Every decision is made on a closed bar, so the history you are looking at is the history you woul
A nine or a thirteen is rare on any one chart, and that is precisely why a watch list beats chart-hopping. Exhaustion Count Scanner runs the full setup and countdown method, cancellation and recycling rules included, across your symbol list on up to eight timeframes at once, prints every running count with the count it is heading for, and marks the rows where the timeframes agree. Out of the box it scans fifteen pairs; one setting raises that to twenty-eight. The counts also draw on the chart in
Twenty-eight symbols, four timeframes, one screen, and the trade already on the chart under it. Half Trend Scanner runs the stepped trend line across your whole watchlist, sorts the board by what flipped most recently, and tells you in one column how many timeframes agree on each symbol. Every cell it could not measure explains itself in words instead of going blank, so an empty board is never a mystery. The price increases by $10 every 10 purchases. It is two products in one file. The first is
Mean reversion is a numbers game, and the numbers live on more charts than you can watch. Nadaraya Watson Envelope Scanner runs a causal, non-repainting kernel regression envelope across your symbol list on up to four timeframes at once, prints every re-entry with its age, and marks the rows where the timeframes agree. Out of the box it scans fifteen pairs; one setting raises that to twenty-eight. The envelope itself draws on the chart in front of you, so you act on what the table found without
Twenty-eight symbols on four timeframes at once, and a board that admits when momentum is not confirmed. QQE Mod Scanner runs two independent QQE blocks over RSI across your whole watchlist, prints in every cell which way momentum turned and how many bars ago, and writes flat where the two blocks do not agree instead of colouring the cell anyway. The AGREE column tells you how many timeframes stand on the same side, and the oscillator itself is drawn in the sub-window under the table, so the mom
A squeeze release lasts a few bars and never waits for you to cycle through charts. Squeeze Momentum Scanner watches your symbol list on up to four timeframes at once, prints the exact bar each compression let go and which side the momentum was on, and marks the rows where the timeframes agree. Out of the box it scans fifteen pairs; one setting raises that to twenty-eight. The oscillator itself draws in this chart's sub-window, so you act on what the table found without attaching a second indica
Filter:
No reviews
Reply to review