
Currency Strength Flux
- Indicators
-
Evgenii Sutulov
 I build trading indicators, strategies, and dashboards that don't repaint.
Seven years doing this. MetaTrader 4, MetaTrader 5, TradingView.
Closed bars only. What you see is what happened.
The bar being formed never changes a published value. - Version: 1.4
- Updated: 13 September 2026
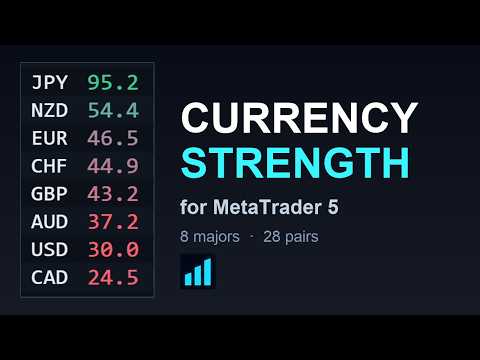
Currency Strength Flux ranks the eight major currencies by relative strength, read from up to 28 pairs, on a four-timeframe composite that only ever uses closed bars.
The idea is simple: trade a strong currency against a weak one, instead of the chart that happens to look nice today. Everything on the panel serves that one decision.
What it does
The panel ranks EUR, GBP, AUD, NZD, USD, CAD, CHF and JPY from strongest to weakest. Every reading is built from the pairs your broker actually quotes. Each pair adds to one side and subtracts from the other, so the eight scores always centre on 50 and the basket is zero-sum by construction.
50 is the basket average, not a fixed level. A score of 70 does not mean the currency is strong in absolute terms; it means it is strong relative to the other seven right now.
Closed bars only
A number printed on the panel cannot change afterwards.
Rates are read from position 1, so the bar being formed is never part of a published value, and the buffer slot for the current bar is left empty. The panel recomputes when the fastest weighted timeframe closes a bar, plus a slow safety interval. Never on a tick.
The footer names the exact bar the numbers came from, in server time, so you can check any reading against your own chart at any moment.
The four-timeframe composite
Four timeframes are averaged with fixed weights: M15 at 15 percent, H1 at 35 percent, H4 at 35 percent and D1 at 15 percent. A currency that is strong on one timeframe and weak on three does not reach the top of the table.
The history behind the panel is anchored to time, not to bar number. Each point is tied to a closed bar of the fastest timeframe, and every other timeframe contributes the last bar that had closed by that moment. This is why the lines in the subwindow stop moving once they are drawn.
Volatility normalisation
Raw returns are divided by ATR before they enter the basket. A 40 point move in a yen cross and a 40 point move in EURCHF are not the same event, and without normalisation the yen crosses would dominate the ranking on volatility alone.
What the columns mean
- SCORE - relative strength, where 50 is the basket average. 30 to 70 is the usual range.
- BREADTH - the share of the basket this currency gained against, over the same timeframes as SCORE.
- SLOPE - the score now minus the score N closed bars ago, so you can see whether strength is building or fading.
- TREND - per timeframe, the direction most of that currency's pairs point. A filter, not a strength reading.
- HISTORY - a sparkline of the recent closed bars, at its own fixed reach, so the column stays readable however deep the subwindow history is set.
Pair scanner
Under the table sit the pairs with the widest strength gaps, each with a direction and a SETUP value: the gap discounted by how much the four timeframes disagree about it. A pair that every timeframe agrees on keeps most of its gap; a pair the timeframes argue about loses much of it.
A marker flags a pair whose price keeps extending while the strength gap behind it is already closing.
Click a pair to open that symbol on the chart. Click a currency to list its own pairs, widest gap first.
The eight strength lines
The same eight scores plotted over time in the subwindow, on a fixed 0 to 100 scale, so the same height always means the same reading on any chart and on any day. Two hundred closed bars by default, which is a little over two days of session time on the standard settings.
The two currencies of the chart symbol are lit automatically: open GBPJPY and the panel shows GBP and JPY. Click a currency chip under the subwindow to show or hide any line by hand, and that choice stays with the symbol you made it on. Move to another instrument and it lights that instrument's own two currencies again.
Broker symbols
Suffixes and prefixes are detected from the chart symbol, and a broker suffix input overrides the detection when needed. Candidate symbols are checked against the base and profit currency the broker declares, so a decorated look-alike is never mistaken for the real pair.
If your broker does not quote a cross at all, it is priced through its USD legs and the row is marked accordingly. Only the symbols the chosen basket actually reads are switched on in Market Watch.
The basket is yours
Any of the eight currencies can be switched off. The basket shrinks to N*(N-1)/2 pairs and every count on the panel is measured against that number, not against a fixed 28. Four currencies enabled means six pairs, and the header says six.
Interface
Drag the panel from anywhere, including the rows that are themselves clickable: what decides is whether the hand moved, not what sat under it. Dark and light themes. Two layouts, the full board or the strength table on its own. English and Russian, following the terminal language.
Clicking a scanner row switches the chart symbol, and the panel comes back exactly as you left it. Position, theme and layout all survive the switch, per chart.
Alerts
Eight events on the strength meter itself: a currency entering or leaving the strong or weak band, a currency crossing the basket midline, a new strongest or weakest currency, both ends flipping at once, momentum turning, the chart symbol's own side flipping, the basket spreading out or collapsing, and coverage breaking or coming back. Every one of them is an edge, a change between two states, so nothing rings on every bar of a move that has already been announced.
Popup, sound, push and email, any combination. A cooldown is kept per event, so one currency crossing a band does not silence an unrelated one for the same five minutes. The first pass after attaching only records what it sees; it never greets a chart opened mid-session with an alert about a setup that has been sitting there for hours.
Settings live on their own screen behind the bell icon, with a SAVE button and a file that outlives the chart, so the same alerts follow you from one chart to the next.
Inputs
The names below are exactly as they appear in the Inputs tab.
Main
- History depth - how many closed bars the subwindow lines carry, from 8 to 512. Default 200.
- Panel size - percent of the default size. Default 120, raise it to 150 on a 4K screen.
Engine: how strength is measured
- Lookback - closed bars compared when measuring a move. Default 5.
- ATR period - period of the volatility normaliser. Default 14.
- ATR floor - lower bound on ATR as a fraction of price, which keeps a dead market from producing huge normalised moves. Default 0.0005.
- Score spread - lower values give more contrast between currencies. Default 1.0.
- Slope - closed bars looked back for the SLOPE column, counted on the heaviest timeframe. Default 3.
- Slope dead zone - score points below which SLOPE is treated as flat. Default 1.5.
- Min basket pairs - how many pairs a currency needs before it is scored at all. Default 5.
- Strong from this score and Weak below this score - where a currency starts being shown as strong or weak. Defaults 62 and 38.
TREND column
- TREND column: fast EMA and slow EMA - the pair of averages behind the per-timeframe trend filter. Defaults 20 and 50.
- TREND flat zone - the EMA gap, in ATR units, below which a timeframe counts as flat rather than trending. Default 0.15.
Pair scanner
- Minimum strength gap for a scanner row - how wide the gap must be before a pair is listed. Default 10.
- A timeframe agrees from this gap - the gap at which a timeframe counts as agreeing with the setup. Default 2.
Symbols and basket
- Broker suffix - leave blank to detect it from the chart symbol.
- Include EUR ... in the basket - one switch per currency, all eight on by default. Switching one off removes it from the basket and from every count.
Interface and performance
- Interface language - Auto, English or Russian. Auto follows the terminal.
- Start layout - Full, or the strength table on its own. Also the panel buttons 1 and 2.
- Draw the 8 strength lines in the subwindow - turn the lines off to keep the panel alone.
- Timer tick, Pairs processed per timer tick and Safety rescan - how the workload is spread out. The defaults suit a normal terminal and rarely need changing.
What it is not
This is an instrument and direction filter. It is not an entry signal and it is not a forecast. It tells you which currency is being bought and which is being sold, and leaves the entry, the stop and the target to your own method.
Requirements
Works on any broker that quotes the majors, on any chart symbol and any chart timeframe. The eight strength values are published as indicator buffers, so an Expert Advisor can read them through iCustom.










































This may be a very useful CS indicator, very comprehensive, seems to be well thought through. It is now weekend, so I cannot test it live. I noticed two issues 1) Cannot change the colours of the strength lines and also no option to display all the strength lines together, it only displays the two currency pairs. Well done, it looks very promising. It is too early to rate reliability and support. couldn't rate. The latest update (version 1.4) makes it possible to change the strength line colours - thank you Evgenii! So I would rate the CS as high quality, it does exactly what the author claims it would do and developer feedback is fast. I have not had the need to ask for user support because the indicator works as described by the developer. In my opinion, one of the better currency strength meters available for MT5. It helps keeping my charts clutter free and the setting options are excellent. I also like the logic of the algorithms used by the developer. I suggest pair it with any reversal indicator on a shorter time frame and trade in the direction of the trend.