Ehlers Instantaneous Trend MT5
- Indicators
- Libertas LLC
- Version: 1.0
- Activations: 20
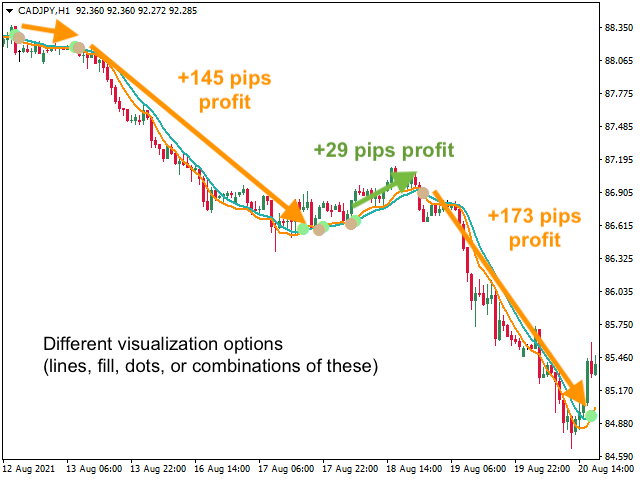
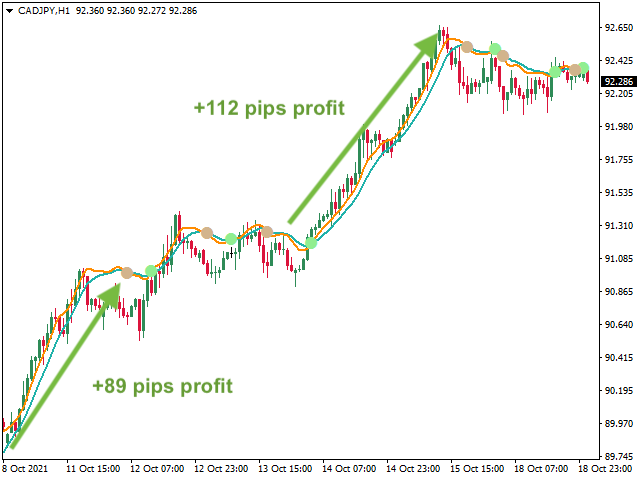
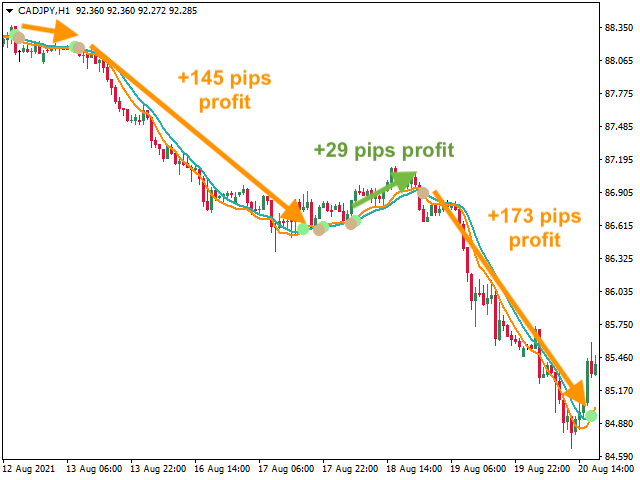
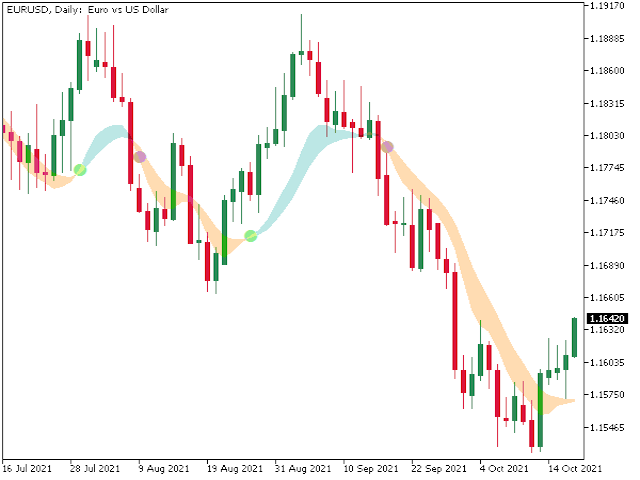
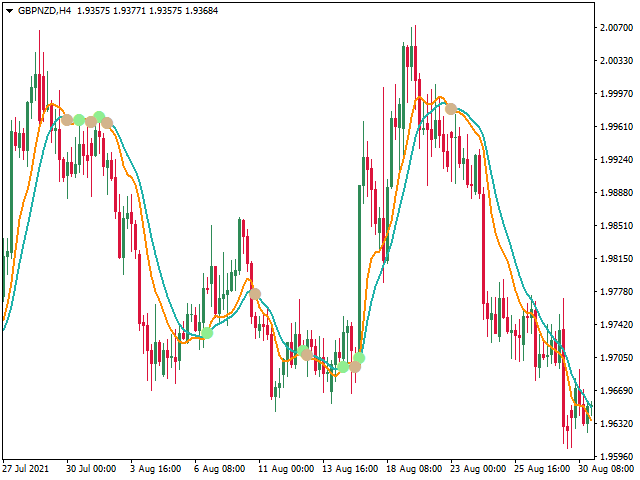
Catch major price movements, early in the trend. Alerts you to enter at the likely beginning of a trend, and if it's incorrect, quickly alerts you to exit to limit any loss. Designed to capture large, profitable price movements, with early entrance to maximize your returns.
As shown in screenshots, typical behavior is several quick entrance/exists with small loss, and then capture of a large trend with high profits.
The Instantaneous Trend indicator is a lag-reduced method to detect price trends. It was originally described by John F. Ehlers [Ehlers JF (2002) The Instantaneous Trendline, Stocks & Commodities 20:2 (28-32)]. Mathematically, this treats the market as having 2 overlapping activities: trends, and cycles. Trendiness and cyclic activities combine to form overall price action. For a trend trader though, cyclic activity can be "noisy" and dangerous.
The Instantaneous Trend equation isolates and removes cyclic activity (market dominant cycle) from price action. By removing this cyclic noise, it aims to quickly show underlying price trends.
This includes a few calculation variants, and using alerts will help the trend-conscious trader monitor multiple assets throughout the day
Typical behavior is several quick entrance/exists with small loss, and then capture of a large trend with high profits.
Alerts
Message, sound, and email alerts can be activated when the trend moves upward or downward. Optional circles can be drawn (turned on/off in Parameters) which correspond to alert onset.
Parameters
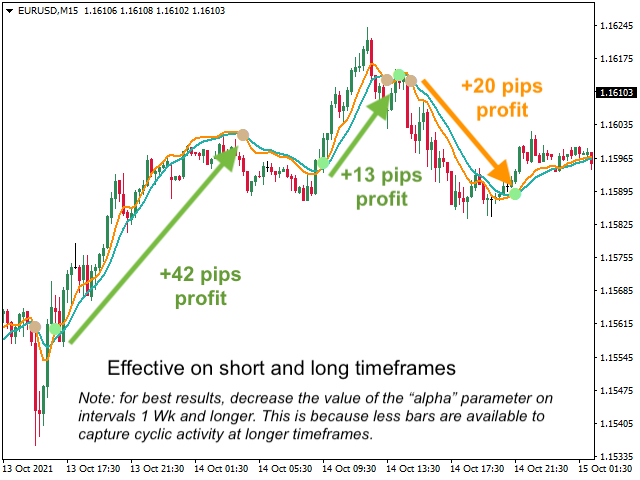
- Alpha (0.07 by default): Sensitivity constant, higher values are more sensitive to shorter-duration trends. For best results, decrease the value of alpha for very long intervals (weekly or monthly). This is because less bars are available to calculate cyclic activity at these long intervals, and alpha should be tuned for longer-duration trends.
- Fill trend region: Color fill region between indicator and control lines
- Enable bar color: Change bar colors to be green/red (or custom color) according to when Instantaneous Trend is in an uptrend or downtrend. Note, you may want to also adjust bar line colors
- Hide lines: Hide the indicator and control lines (used if you want to only show dots or fill)
- Draw dot on cross: Draws a circle at the points where the indicator line crosses control, indicating a new trend direction
- Turn on alerts message: If true, turns on message box alerts (when indicator line crosses control)
- Turn on alerts sound: If true, turns on alerts sound (when indicator line crosses control)
- Turn on alerts email: If true, turns on alerts email (when indicator line crosses control)
- Alert on candle opening: If true, waits for the opening of the next candle to trigger an alert (not immediately when crossover happens) to reduce false triggers
- Colors: Options to specify custom colors for different components of the indicator (indicator line, control line, dots, etc)