NewYork Range
- Indicators
-
Thushara Dissanayake
 I’ve always loved exploring new trading strategies, testing them with indicators, and automating them with expert advisors (EAs). Welcome to my world of Forex Trading Robots, Indicators, and Trading Tools, all specially built for the MetaTrader platform.
 - Version: 1.0
- Activations: 5
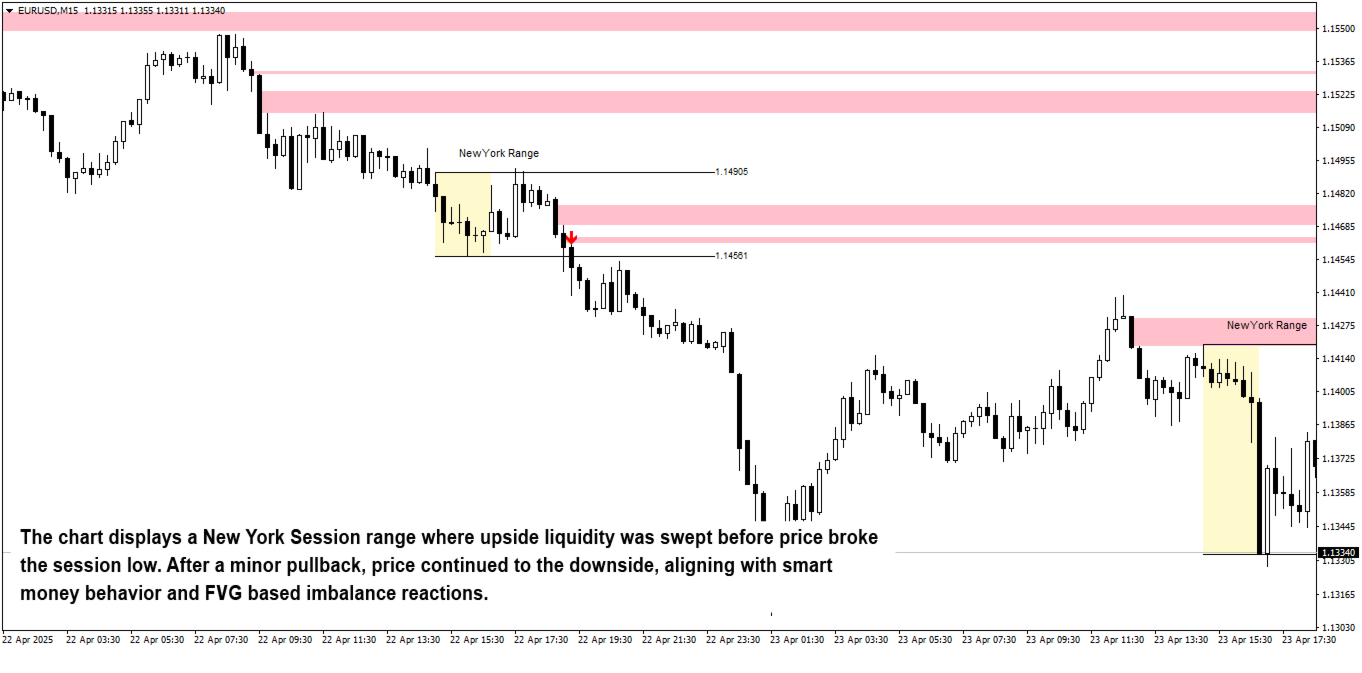
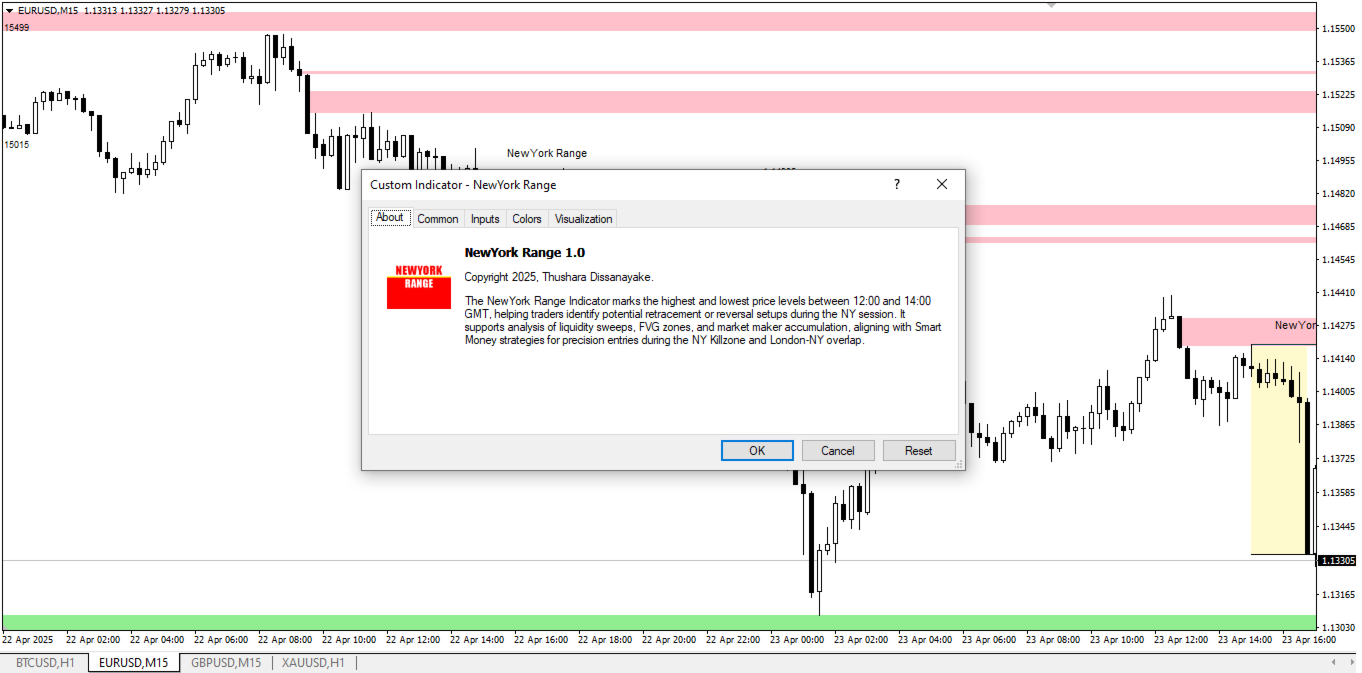
The New York Range Indicator is a session based analysis tool developed for traders applying ICT (Inner Circle Trader) concepts, Smart Money trading, and institutional price action methods. Designed specifically for the New York session, this indicator captures the price range between 12:00 and 14:00 GMT, a critical period that overlaps with the London Close and New York Open. It identifies session highs and lows, detects Fair Value Gaps (FVGs), and highlights potential liquidity sweep zones, helping traders analyze market maker behavior, session range breaks, and retracement opportunities with precision.
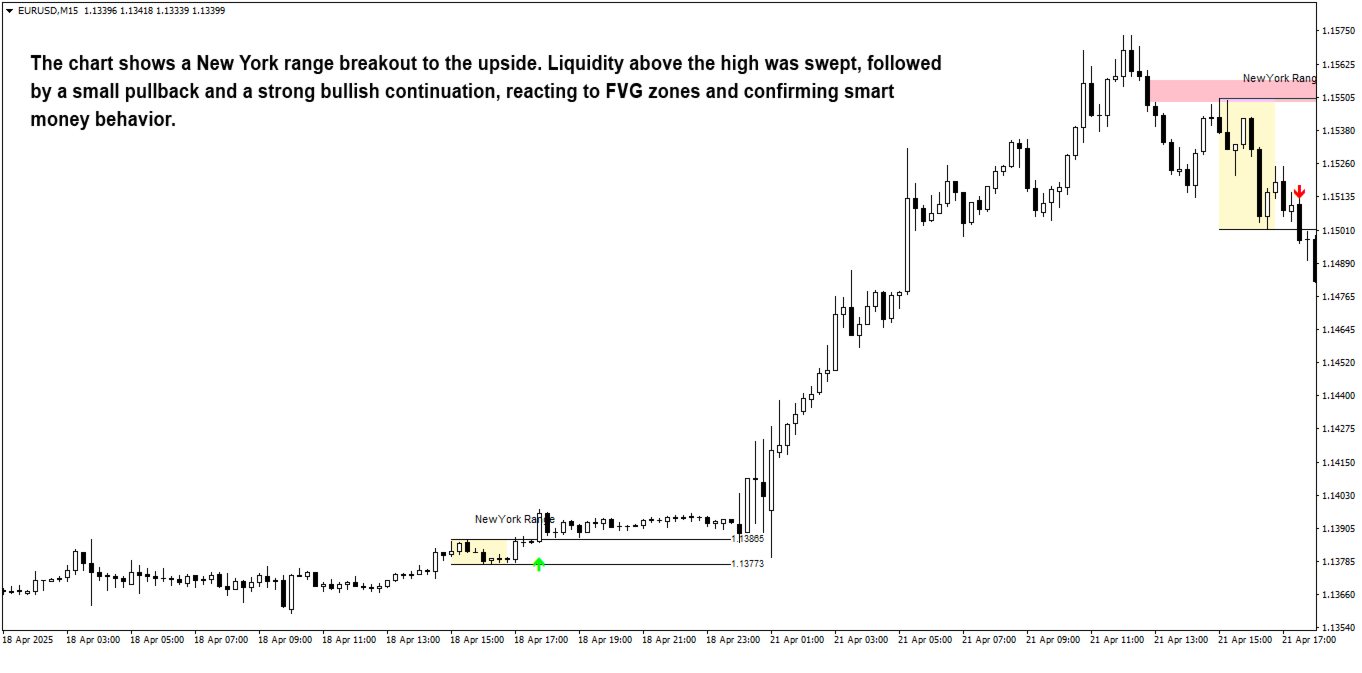
This strategy focuses on understanding the market structure shift and accumulation or distribution patterns that occur during the New York Killzone and the London New York session overlap. The indicator offers a structured visual framework for reading the chart using Smart Money Concepts, such as break of structure (BOS), market structure shift (MSS), displacement candles, imbalance zones, and liquidity voids. The tool allows traders to analyze session ranges, wait for liquidity grabs, and monitor FVG fill reactions, making it highly suitable for retracement entries, late breakouts, and reversal setups.
This indicator suits traders who want to take advantage of the high volatility and institutional volume often seen during the New York session. It supports analysis of price action within the Forex session cycle, especially when price reaches or breaks through liquidity pools, order blocks, or inefficiency zones created in earlier sessions.
This tool is ideal for:
- Traders using ICT, SMC, and liquidity based strategies
- Traders who focus on the New York session or London-New York overlap
- Traders watching for retracements, reversals, or session continuation moves
- Day traders and scalpers seeking high probability trade setups
- Those trading EURUSD, GBPUSD, USDJPY, USDCHF, and USDCAD, which are actively influenced by the New York session
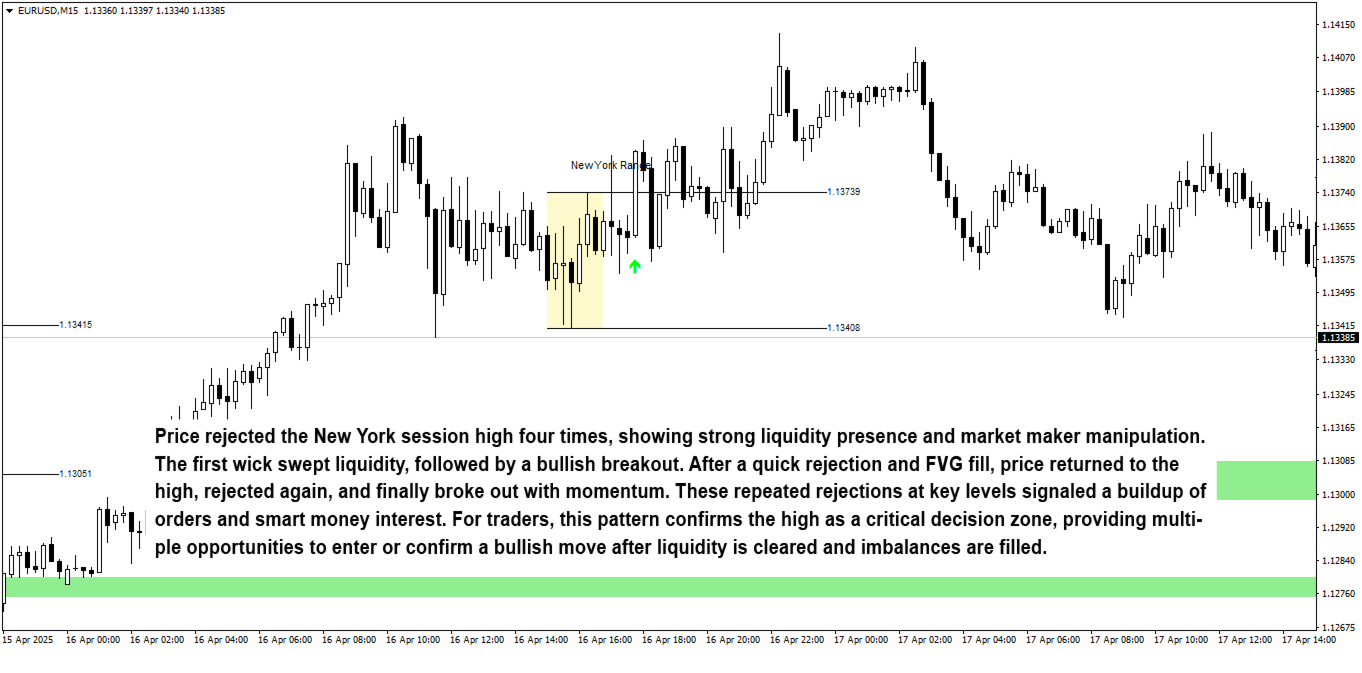
The indicator works by tracking price action during the 12:00–14:00 GMT period and marking the session high/low range. Traders can then wait for liquidity sweeps, FVG reactions, or breakouts, aligning trades with Smart Money principles such as:
- Identifying liquidity hunts on one side of the session range
- Waiting for break of structure (BOS) after a sweep or inducement
- Using displacement and FVG fill alignment for confirming direction
- Watching for retracement into an FVG for entry
- Managing exits using session highs/lows, FVG completions, or external liquidity zones
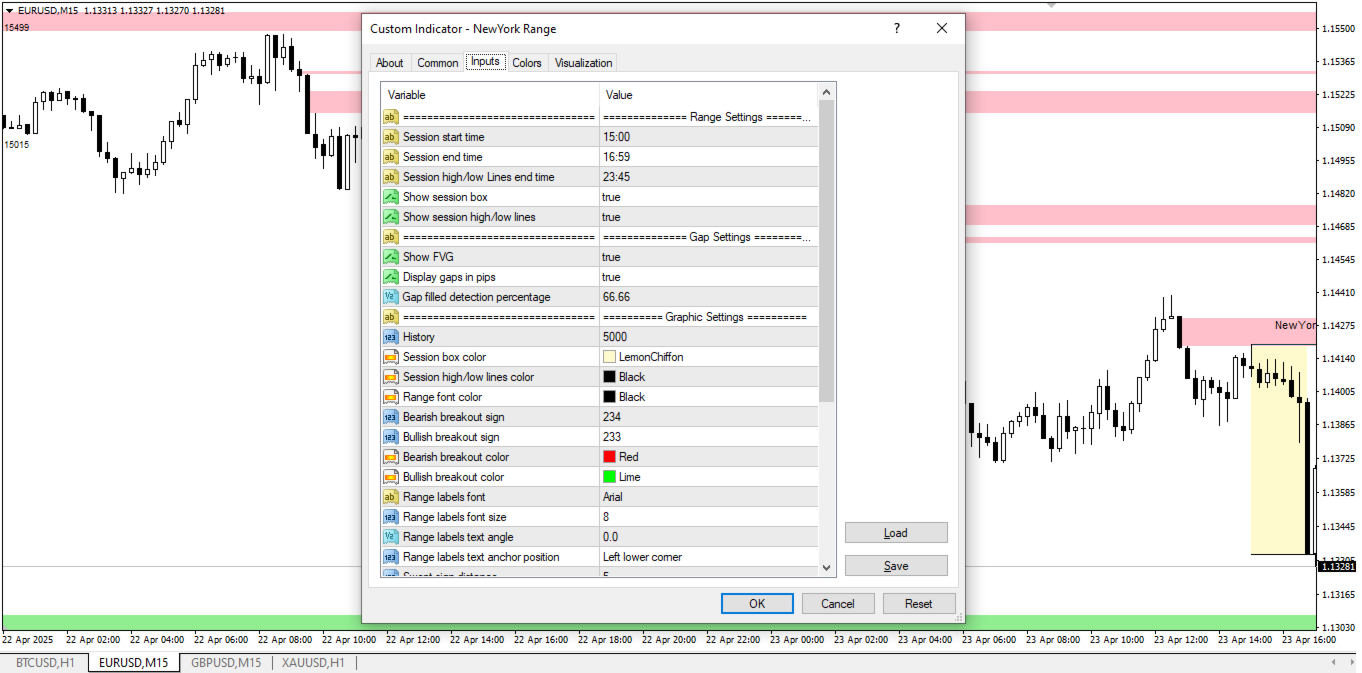
The session box provides a visual structure, while session highs and lows serve as reference points for planning entries and exits. The indicator also displays bullish and bearish FVGs, showing whether price has filled these imbalances or if they remain open.
Key Features:
- Defines the New York session range from 12:00 to 14:00 GMT
- Draws a session box and high/low reference lines
- Detects Fair Value Gaps and shows fill progress in pips
- Highlights potential breakout direction with configurable signs and visuals
- Displays liquidity sweep zones and reaction levels
- Supports mobile, popup, and email alerts
- Fully customizable color schemes, time settings, and label styles
This indicator is designed for structured Forex trading strategies rooted in price action, session analysis, and institutional order flow. Whether you're looking to spot a liquidity grab, enter on a FVG reaction, or confirm a session based continuation, this tool provides the visual context to plan and manage trades effectively.
Pairs that respond well to this strategy include EURUSD, GBPUSD, USDJPY, and USDCHF, especially when aligned with session volatility and market structure shifts. Cross pairs like EURGBP, AUDUSD, and USDCAD may also offer valid setups when monitored within this session range.
By integrating core concepts of SMC, session timing, and liquidity theory, the NewYork Range Indicator offers a disciplined framework for planning trades and managing risk. It is most effective when used in conjunction with a solid understanding of liquidity inducements, imbalances, and Smart Money flow rather than relying solely on lagging indicators.