Chart AI Assistant
- Experts
- Version: 1.1
- Activations: 5

Chart AI Assistant – AI analysis of your live chart, in one click
The AI looks at the picture of your chart, the same way you look at it. It sees the candles, the levels and the indicators on your screen, reads them, and tells you what is happening.
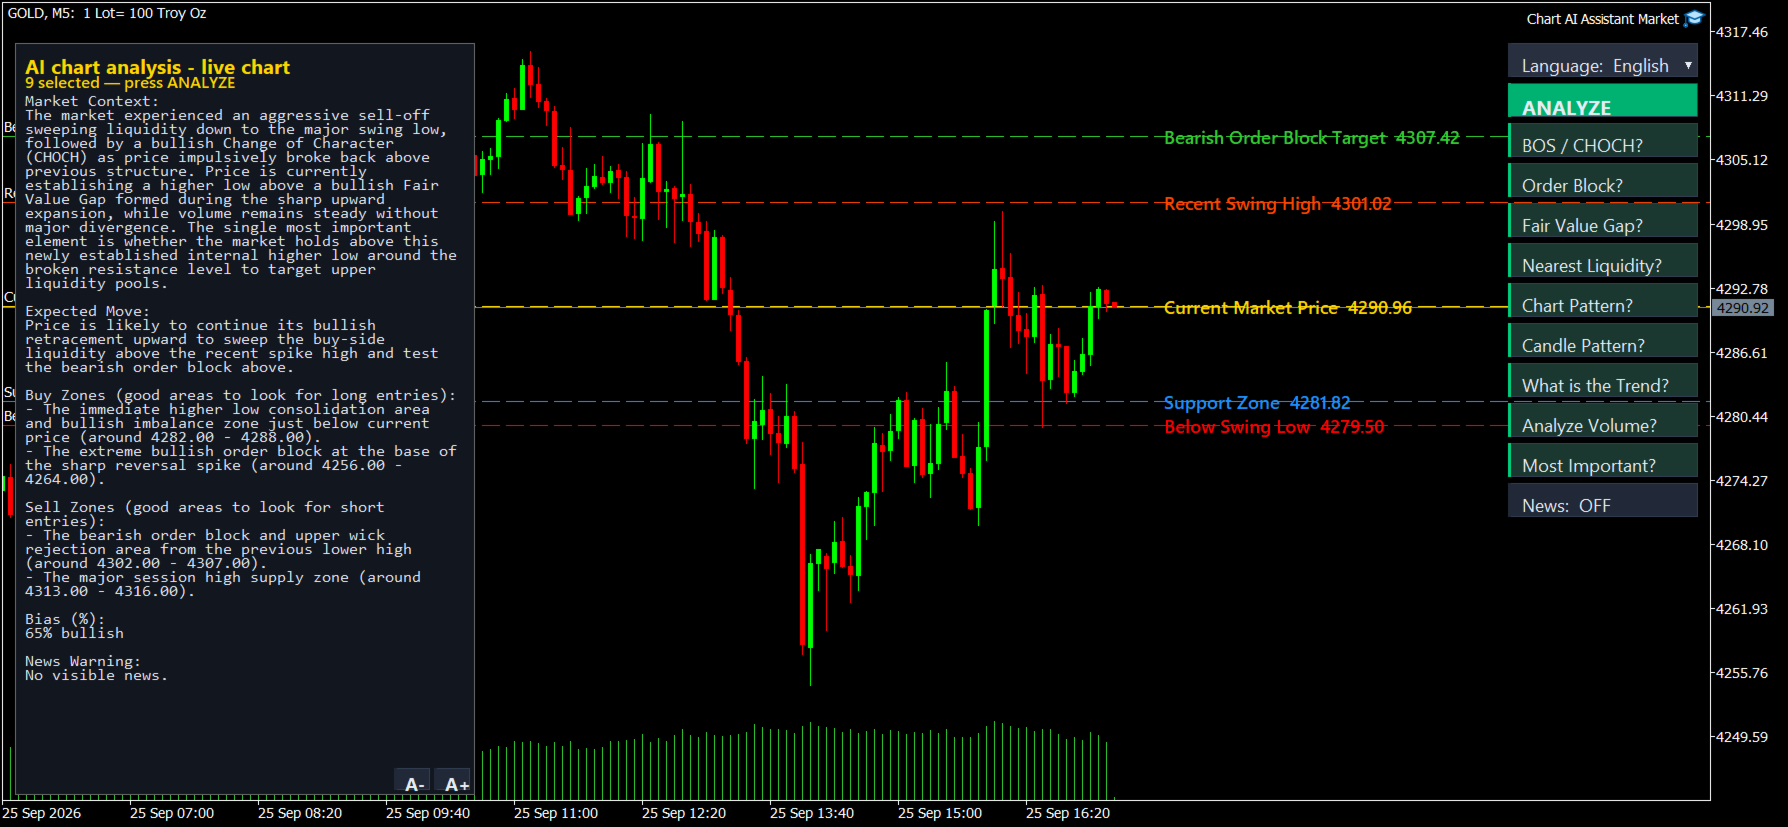
Chart AI Assistant analyses your chart the way an experienced trader would and tells you what it sees: structure, zones, liquidity, patterns, volume and the likely next move. It works on any symbol and any timeframe. Press ANALYZE and the answer appears on the chart, in your own language.
The assistant does not trade and does not open or close positions. It gives you a second opinion, and every decision stays yours.
How it works
- Attach the Expert Advisor to any chart.
- Tick the questions you care about.
- Press ANALYZE.
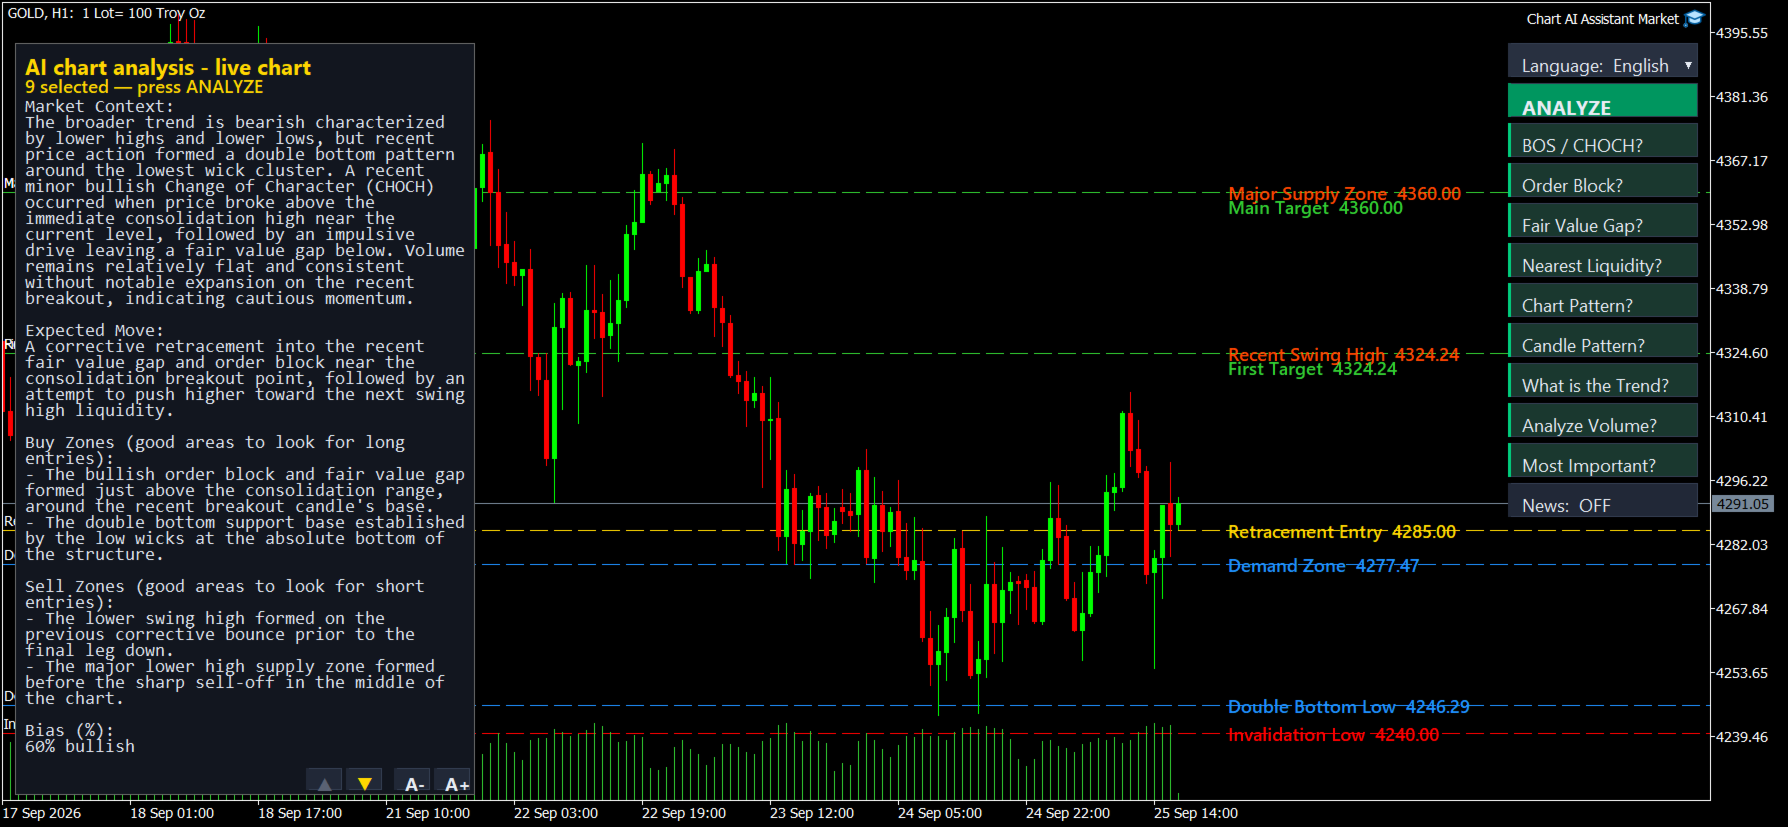
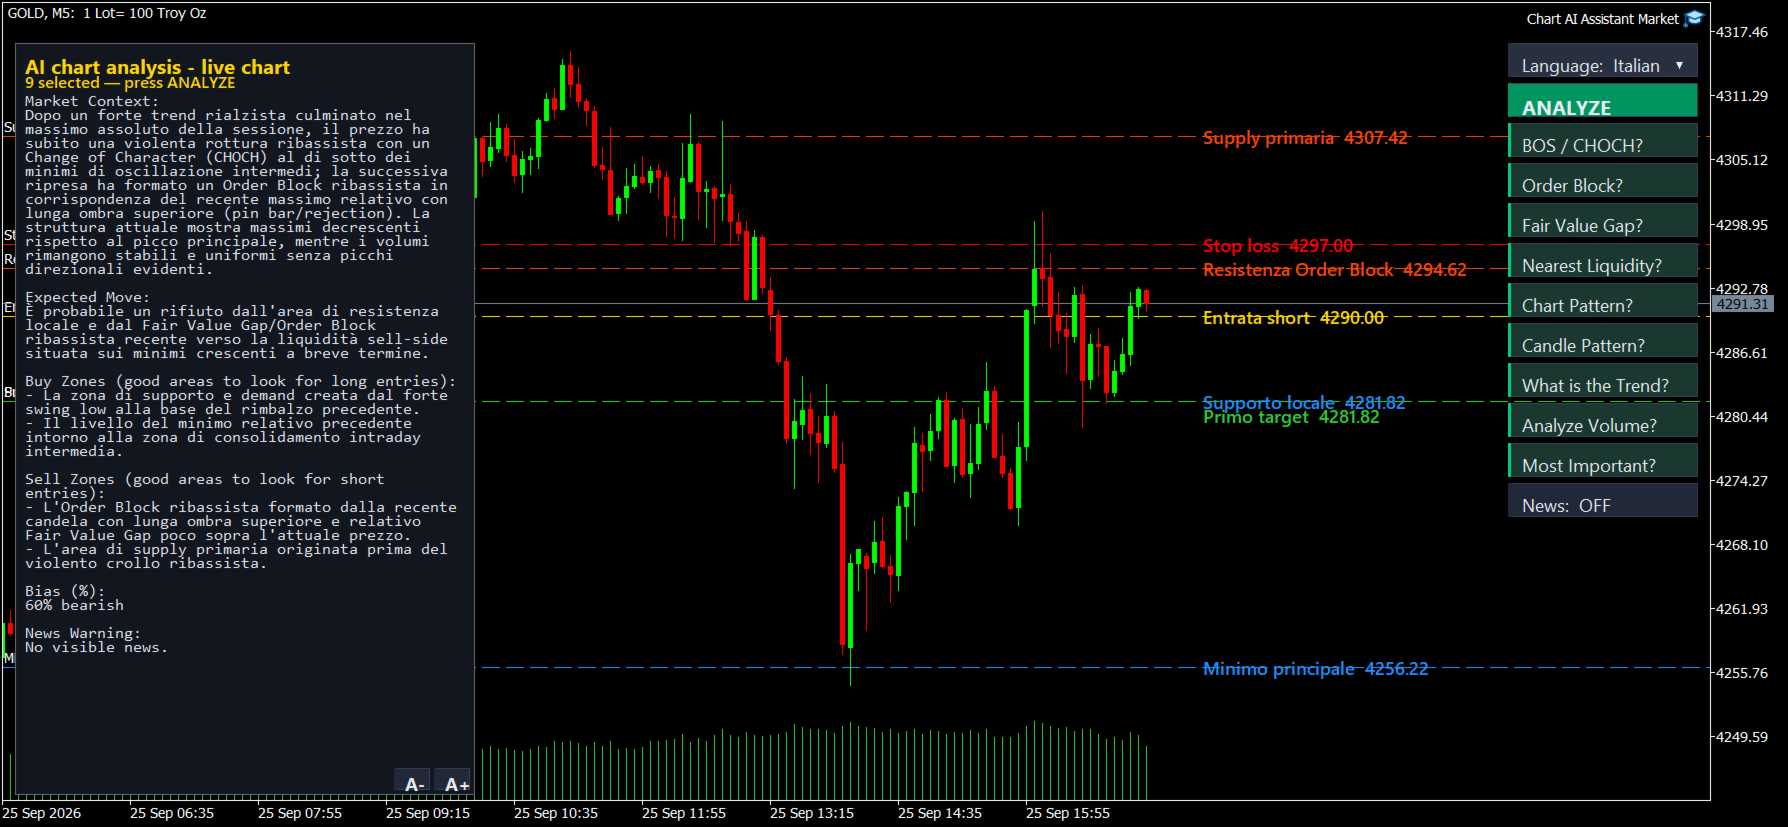
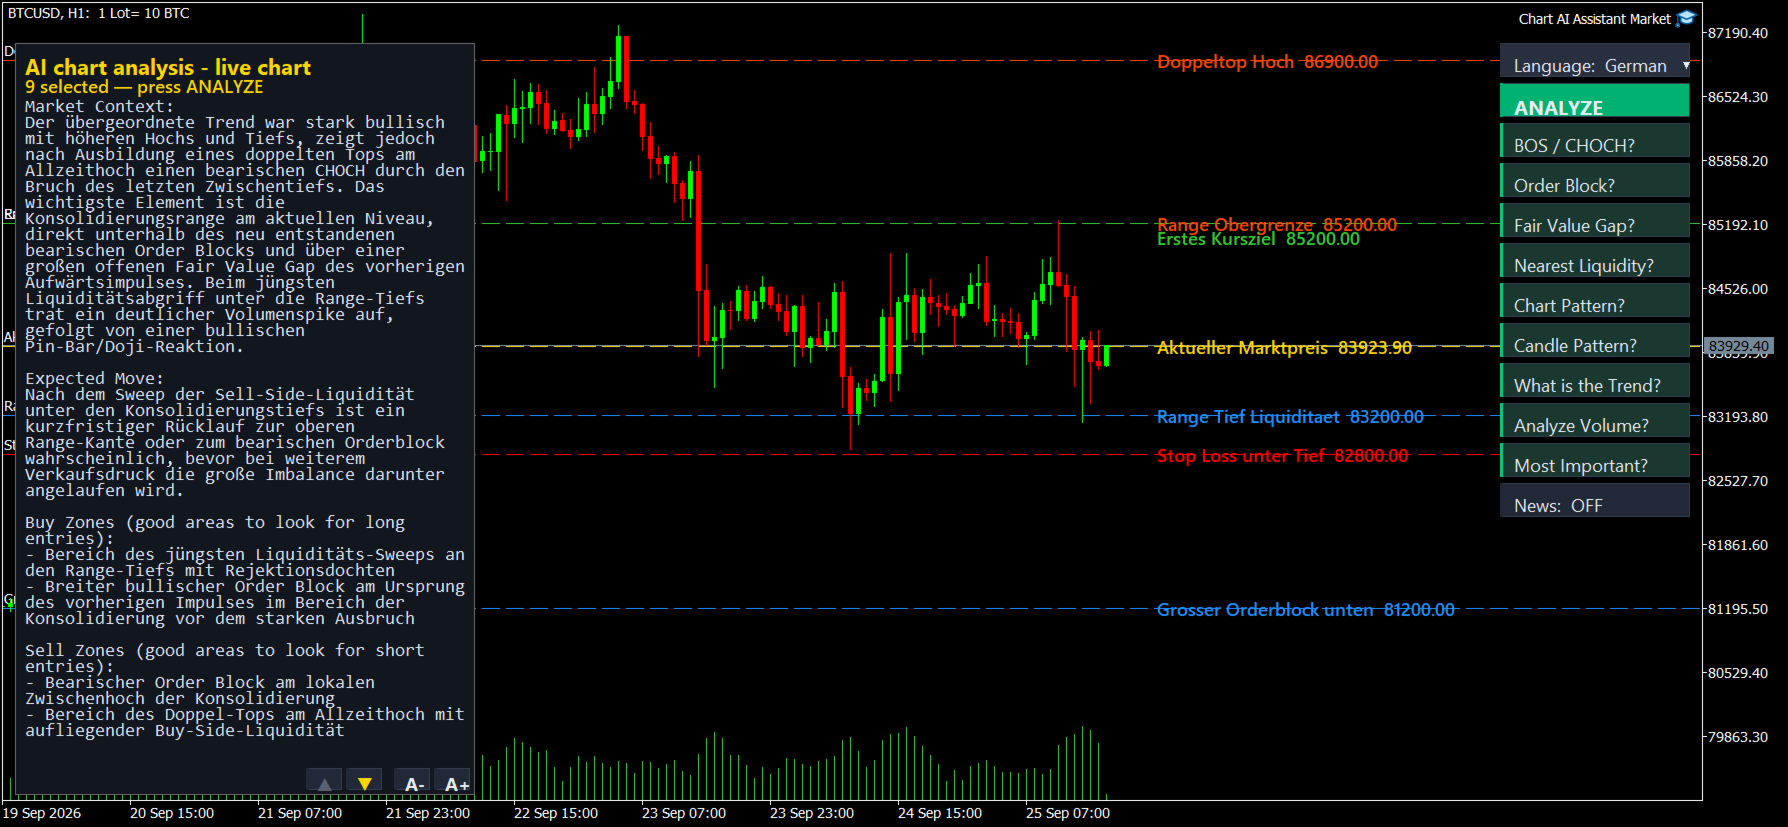
- The answer appears on a panel beside the chart, and the key price levels are drawn on the chart.
Ask exactly what you want
There are nine question buttons. Combine them any way you like:
- BOS / CHOCH
- Order Block
- Fair Value Gap
- Nearest Liquidity
- Chart Pattern
- Candle Pattern
- What is the Trend?
- Analyze Volume
- Most Important
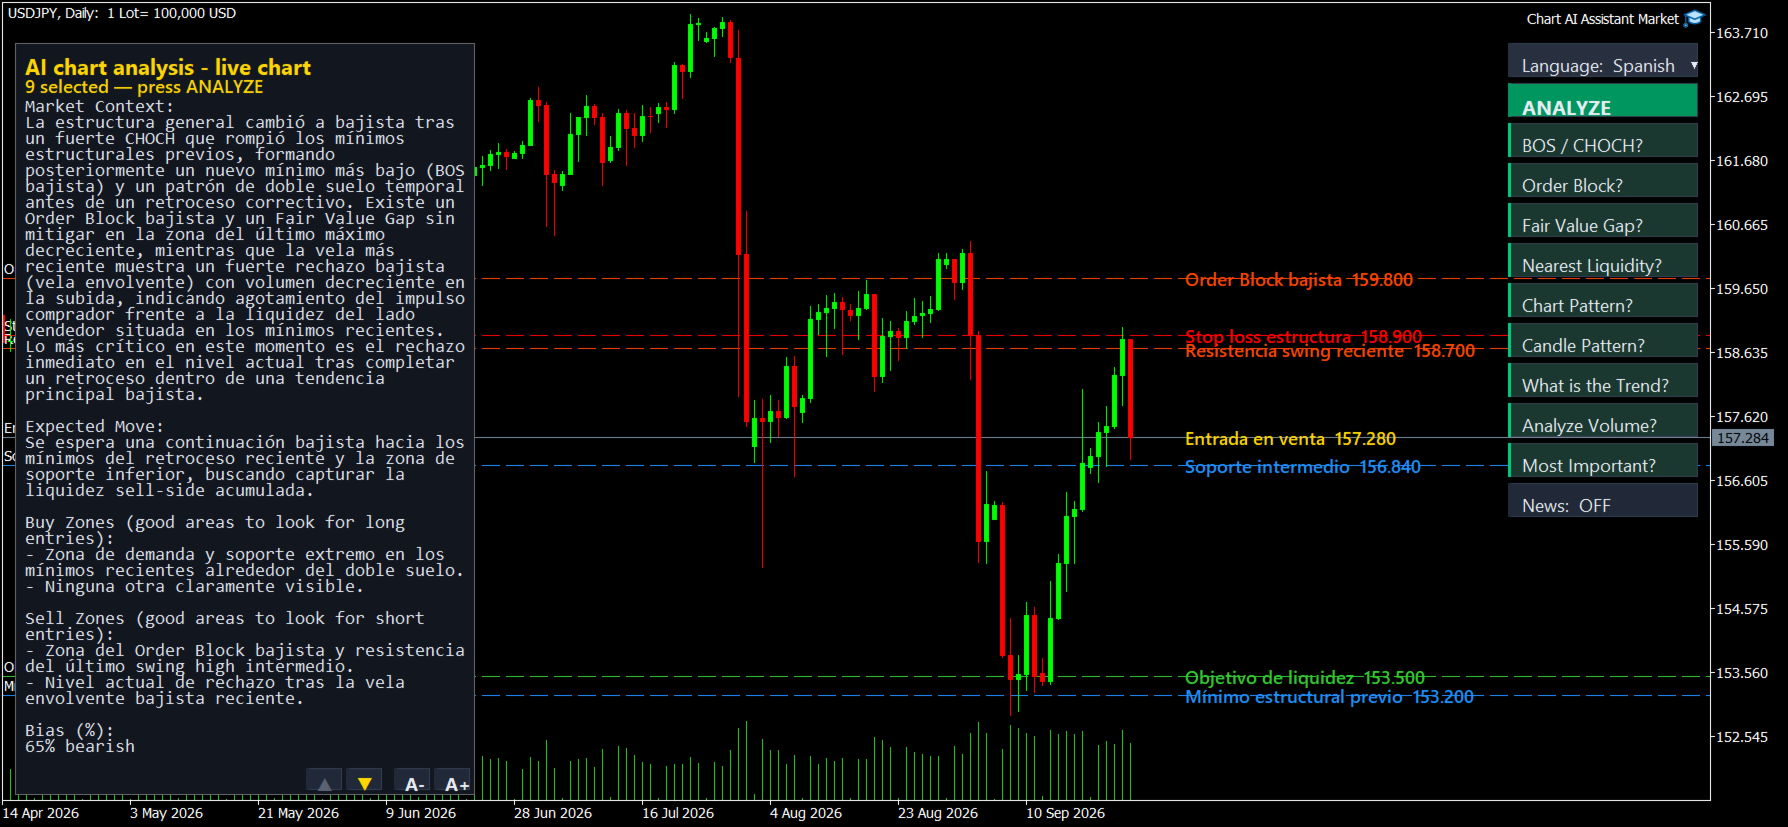
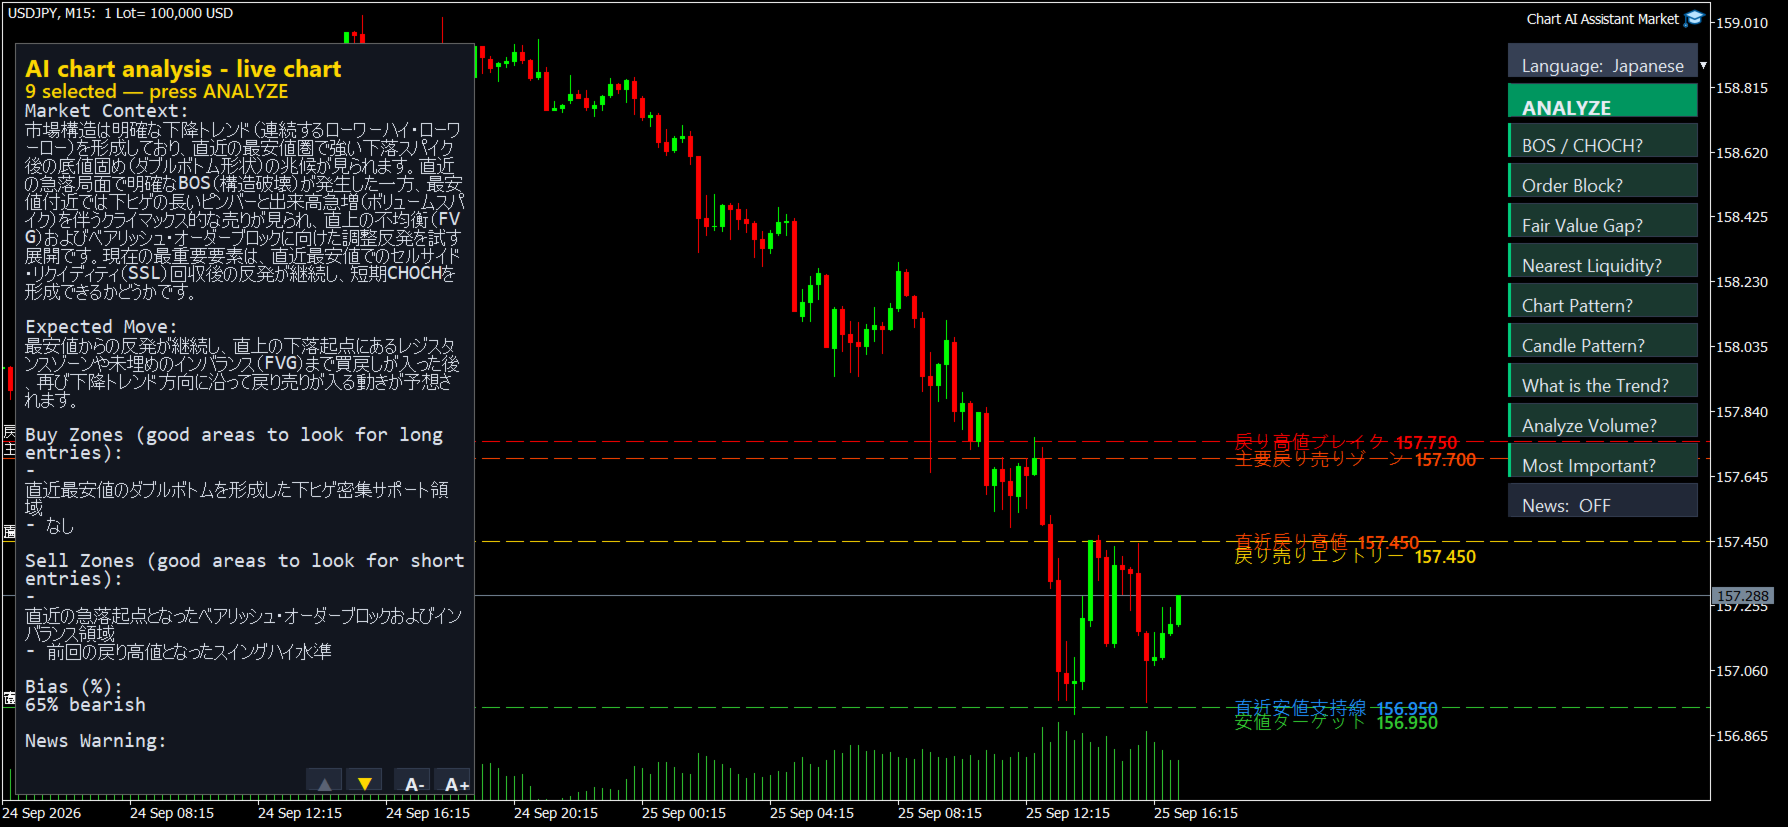
With all nine ticked, you get a full analysis: market context, expected move, buy zones, sell zones, a bias in percent and a news warning. With only some ticked, you get a short answer to just those questions. Ask about volume and you get a volume analysis, nothing else.
Economic news on the chart
High- and medium-impact calendar events for the chart's currencies are marked as vertical lines, from one hour ago to 24 hours ahead. The analysis takes them into account and warns you when news is near. Switch them on or off with the News button.
Comfortable to read
- 18 answer languages: English, Chinese, Hindi, Spanish, Arabic, French, Portuguese, Russian, Indonesian, German, Japanese, Turkish, Korean, Italian, Thai, Malay, Romanian, Bulgarian.
- A- / A+ buttons change the text size, and your choice is remembered.
- A long answer scrolls with the mouse wheel or the arrow buttons.
- The whole visible chart is analysed, even on very large monitors.
Before you start (required)
The analysis runs on our server, so the terminal must be allowed to reach it: Tools > Options > Expert Advisors > tick "Allow WebRequest for listed URL" and add: https://enigmera.com/vision/analyze If the address is not allowed, the Expert Advisor tells you exactly what to add.
Strategy Tester
The assistant analyses the live chart, so it cannot work inside the Strategy Tester. There the panel and buttons load normally so you can see the interface, but ANALYZE shows a message instead of an analysis. To use it, attach it to a normal chart.
Good to know
- Internet connection required. No DLLs. No settings to fill in.
- Only what is visible on the chart is analysed. Zoom and scroll to the period you want before pressing ANALYZE.
- The analysis is an aid to your own judgement, not a trading signal or financial advice. Trading involves risk.
Questions?