Currency Strength Anchor
- Indicators
- Version: 1.23
- Updated: 17 September 2026
- Activations: 10

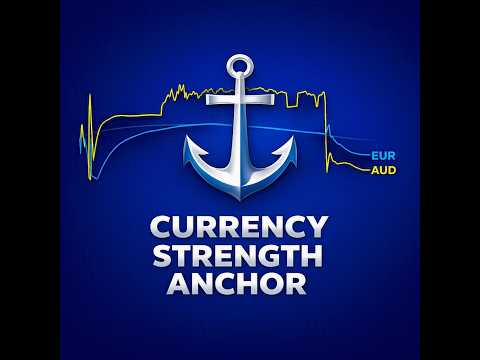
Currency Strength Anchor - session-adaptive relative strength, anchored to the daily, weekly and monthly open. Non-repainting.
Most strength meters compare instruments over a fixed lookback period. The result changes meaning as the trading day moves from one session to the next: a ranking built on Asian-session data says little once London and New York are trading.
Currency Strength Anchor takes a different reference. It measures every instrument against three fixed anchor points - the Daily Open, the Weekly Open and the Monthly Open - and adapts the scope of its calculation to the part of the day in which you are trading.
The context switches automatically between:
the Asian session only the European and Asian sessions the Asian, European and American sessions the American session only
The values are derived from completed price data. They do not repaint.
HOW TO READ IT
The indicator plots one line per component of the symbol on your chart, so you always compare two lines against each other.
Example 1 - Gold. You see two lines, one for XAU and one for USD. If the XAU line is above the USD line, gold is stronger than the dollar, and you look for buy opportunities on XAUUSD.
Example 2 - EURUSD. If the EUR line is below the USD line, the euro is weaker than the dollar, and you look for sell opportunities on EURUSD.
The rule is the same for every instrument: trade in the direction of the stronger component against the weaker one.
THE TWO SCANNERS
Left scanner - alignment. It lists the instruments in which all three anchors, Daily, Weekly and Monthly, point in the same direction. These are the instruments in which the short-, medium- and long-term reference all agree.
Right scanner - ranking. It sorts the instruments by strength, displaying the strongest first together with its coefficient, and marks the strongest against the weakest of the set.
Click any instrument in either scanner and your chart switches to that symbol immediately. The scanners work in real time and are enabled by default.
WHAT YOU SEE ON THE CHART
Strength lines for the two components of the current symbol. The active context, shown on the chart, so you always know which sessions the current calculation covers. The left and right scanner panels, which can be switched off individually if you prefer a clean chart.
RECOMMENDED USE
Instruments: major and cross currency pairs, metals and indices - any symbol composed of two comparable components.
Timeframes: the calculation is anchored to the daily, weekly and monthly open and is therefore independent of the chart timeframe. Use the timeframe on which you execute.
Trading style: manual intraday and swing trading. Currency Strength Anchor is an analytical tool - it does not open, modify or close positions.
INPUTS
Symbols
Symbol source - scan the Market Watch list, or use a custom list of symbols. Custom symbol list - the instruments to scan when the custom source is selected. Symbol prefix / Symbol suffix - the prefix and suffix your broker adds to symbol names, for example ".m" or "_ecn". Set these once and the scanners will resolve your broker's symbols correctly.
Scanners
Show left scanner - display the alignment scanner. Show right scanner - display the ranking scanner. Scanner position - the chart corner in which the panels are placed. Number of rows - how many instruments each scanner lists.
Display
Line colours and width for the strength lines. Font size for the scanner panels.
REQUIREMENTS
MetaTrader 5. Any broker and any account type. If your broker adds a prefix or suffix to symbol names, enter it in the corresponding input. The symbols you want to scan must be present in Market Watch, so that the terminal can download their history. No additional indicators, libraries or DLLs required.
WHAT MAKES IT DIFFERENT
Fixed anchors instead of a rolling window. Daily, Weekly and Monthly Open are objective reference points. They do not shift as new bars arrive, so a reading taken at 10:00 and a reading taken at 16:00 refer to the same origin.
Session-aware context. The scope of the calculation follows the trading day rather than ignoring it.
Alignment and ranking side by side. One scanner tells you where the three horizons agree, the other tells you what is leading and what is lagging. The combination is what identifies a pair, rather than a single currency.
Non-repainting. The values are derived from completed price data and are not revised afterwards.
One click to the chart. Selecting an instrument in a scanner loads it on the chart, so moving from the ranking to the analysis takes no manual symbol switching.
AFTER PURCHASE
Send me a private message after purchase and I will send you the setup guide, including the prefix and suffix settings for the common broker naming schemes, and the chart template used in the screenshots.
Questions before buying are welcome. I answer every message personally.
A NOTE ON THE STRATEGY TESTER
The demo version of any Market indicator runs only in the visual mode of the Strategy Tester, where the terminal provides the history of the tested symbol. The strength lines for the chart symbol are calculated normally there. The scanners require the history of the other instruments and will indicate this on the chart during a test.
To see the scanners populated across the whole instrument set, use the indicator on a live chart.