• Overview
  • Reviews (11)
  • Comments (294)
  • What's new

Price Breakout Pattern Scanner MT4

3.55

Price Breakout pattern Scanner is the automatic scanner for traders and investors. It can detect following patterns automatically from your chart.

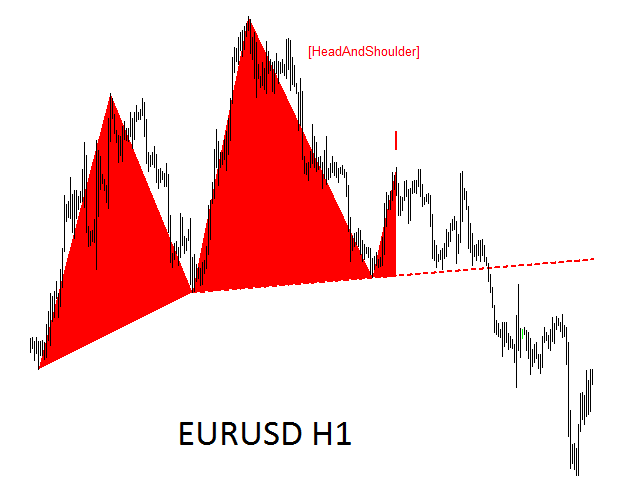
  • Head and Shoulder - Common tradable pattern.
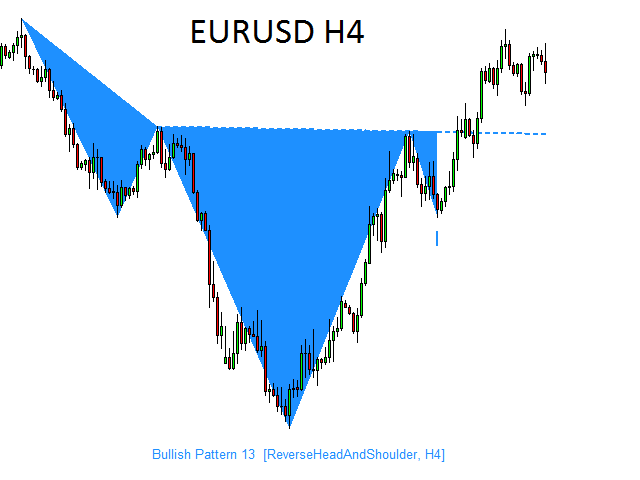
  • Reverse Head and Shoulder - This pattern is the reverse formation of the Head and Shoulder.
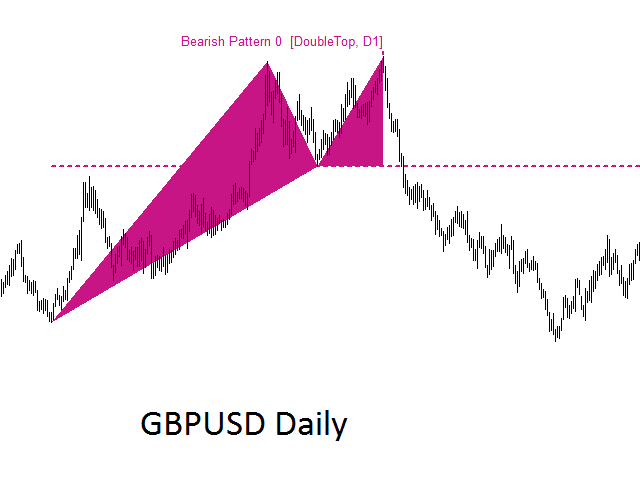
  • Double Top - When the price hits resistance level twice and decline toward the support level, the trader can anticipate sudden bearish breakout through the support level.
  • Double Bottom - The double bottom pattern is the reverse shape of the Double Top.
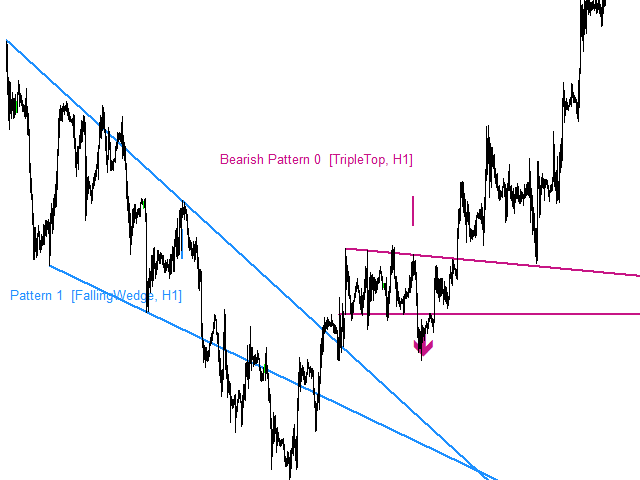
  • Triple Top - When the price hits resistance level three times and decline toward the support level, the trader can anticipate sudden bearish breakout through the support level.
  • Triple Bottom - The triple top pattern is the reverse pattern of the triple top.
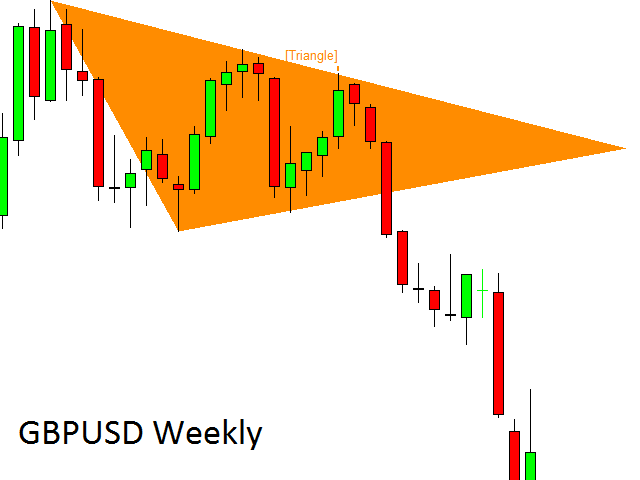
  • Triangle - Several different types of triangle pattern include symmetric Triangle, Ascending Triangle and Descending Triangle.
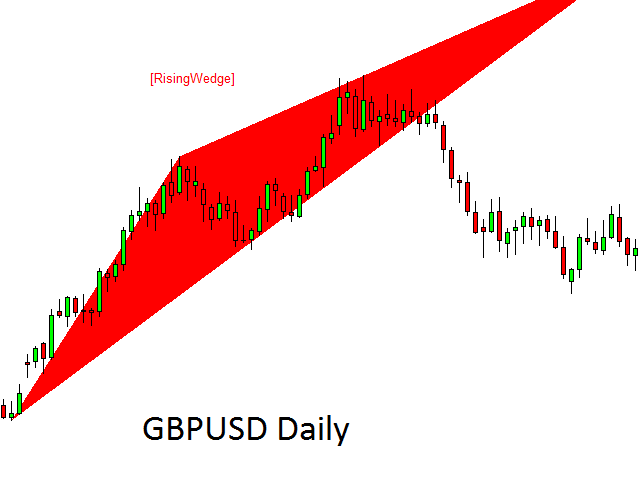
  • Rising wedge - This pattern is similar to triangle. However, their angle is stiffer than standard triangle.
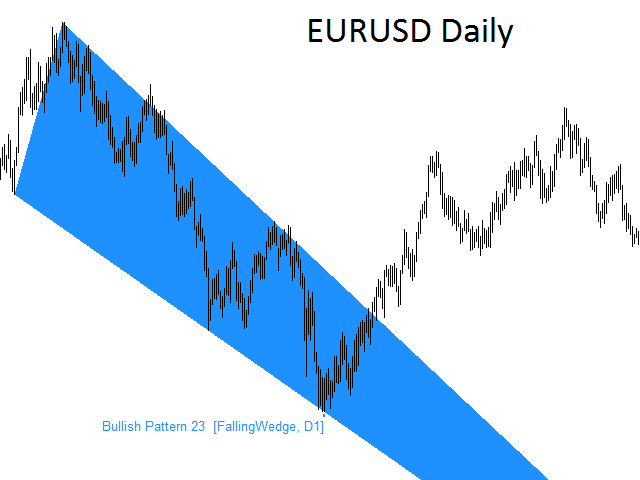
  • Falling wedge -This pattern has similar look to triangle too. However, their angle is stiffer than standard triangle.
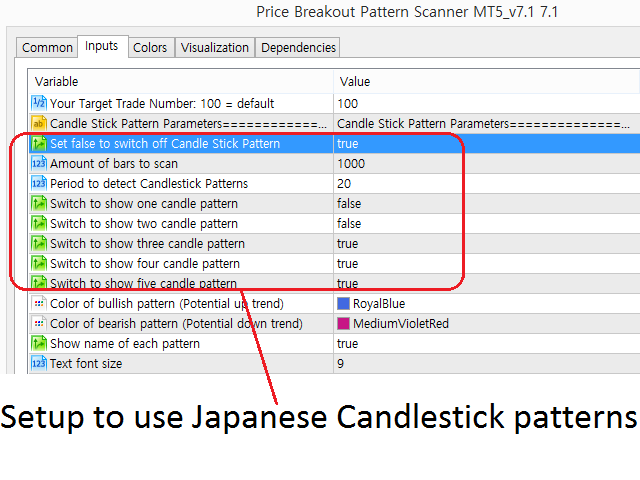
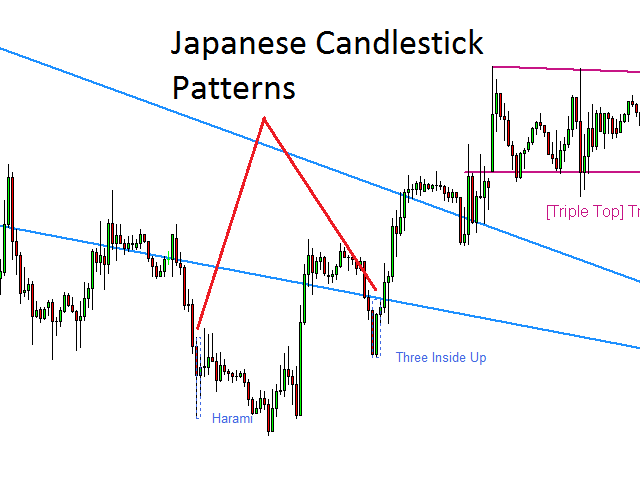
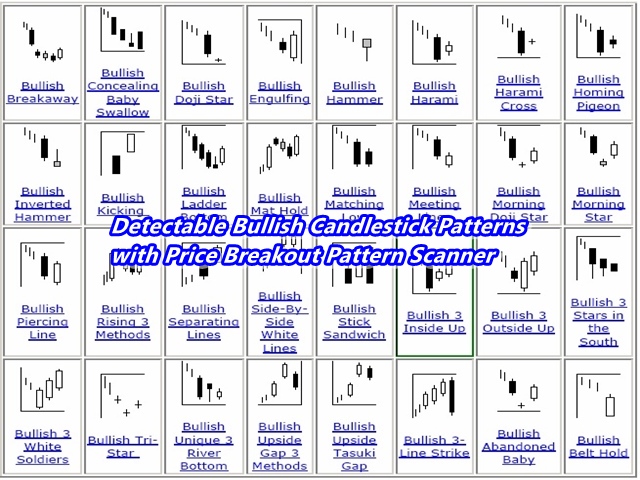
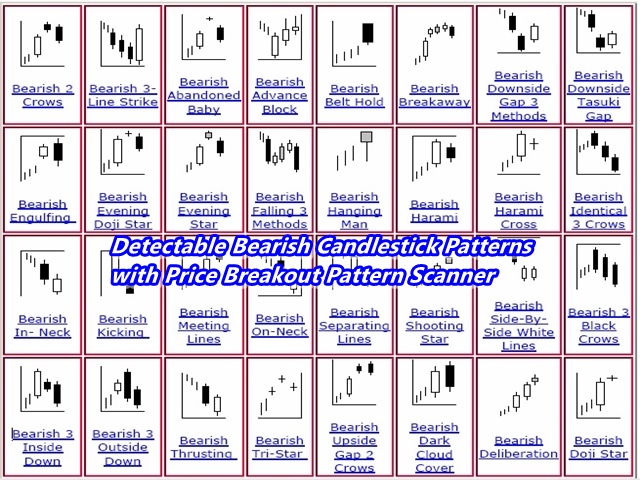
  • 52 Candlestick patterns – the Price Breakout Pattern Scanner can detect 52 different bearish and bullish candlestick patterns include hanging man, shooting star, engulfing, doji, Harami, etc.

Beside this pattern detection, you can use full feature of Smart Renko indicator, automatic round number detection and guided trading instruction feature.


Main Parameter


You can use Price Breakout Pattern Scanner for many different mode. If support and resistance are important for your trading, then you can run the Price Breakout Pattern scanner in Support Resistance mode. For that, set “Display As Support Resistance” = true. If you set “Display As Support Resistance” = false, then Price Breakout pattern scanner will show patterns drawn in triangles. With Price Breakout pattern scanner, it is possible to apply them in custom timeframe. This means that you can apply several price breakout pattern scanner in one chart. To apply price breakout pattern scanner in custom timeframe, set “Timeframe to detect Price Breakout Patterns” to your preferred one including H1, H4, D1, W1 or MN1, etc.

  • Set false to switch off Price Breakout Pattern Scanning:
  • Use Renko Filter for Pattern detection : true or false only
  • Timeframe to detect Price Breakout Patterns
  • Display As Support Resistance (true = support resistance, false = triangle)
  • Max number of patterns to display: Control this input if you want to see more than one pattern simultaneously. For example, set this to 3, then price breakout pattern scanner will show 3 latest patterns at the same time.
  • Pattern Index from which to display: 0 = default
  • Enable sound alert: set to true to get sound alert
  • Send email if pattern is found: set to true to receive email alert
  • Send notification if pattern is found: set to true to receive push notification. Push notification is recommended over email notification.


How to apply Price Breakout pattern Scanner on multiple timeframe


You can apply Price Breakout Pattern Scanner on multiple timeframe in single chart. This will allow you to perform total geometric analysis in fully automatic manner. You can get short, medium, long terms analysis in one single chart. To apply multiple Price Breakout Pattern Scanner in one chart, you need to change the “Timeframe to detect Pattern” and “Button Coordinate Y”. If you do not change “Button Coordinate Y”, then you will not be able to control all price Breakout Pattern Scanner since some buttons will be hidden under the other buttons. For a general guidance, set Button Coordinate Y to 80 for second Price Breakout Pattern Scanner. Likewise, you can set button coordinate Y to 100 for third Price Breakout Pattern Scanner assuming that your button height is 20.


Trading Strategy Guide

Using Wedge, Triangle, Double Top, Double Bottom, Head and Shoulder and Cup with Handle patterns are documented in the link below.

https://www.mql5.com/en/blogs/post/750388


Important Note

This is the off the shelf product. Therefore, we do not accept any modification or customization request on this product. In addition, we do not provide any code library or any support for your coding for this product.


Reviews 11
nguyenphanduc
199
nguyenphanduc 2016.11.20 17:10 
 

Best indicator I ever buy :)

mpantogi
322
mpantogi 2016.10.25 03:06 
 

I bought your system and help me very much to improve my trading skills.Make an excellent work.

CapitalPig
76
CapitalPig 2015.11.29 21:19 
 

Lots of bang for your buck in this indicator. It's really three systems in one: Smart Renko, Candlestick pattern recognition, and the price breakout patterns. These could all be used as individual trading systems if combined with support/resistance study. I personally turn on the candlestick patterns, but leave out smart renko (I prefer trading the raw candles).

Recommended products
Mean Reversion Supply Demand Indicator Mean Reversion Supply Demand is the indicator to detect the important supply demand zone in your chart. The concept of supply demand trading relies on the quantity mismatching between buying and selling volumes in the financial market. Typically, supply demand zone serves to predict the turning point. The wave pattern, for any supply demand zone to work as an successful trade, looks like the price must touch the base zone, move away and then return to zone
Introduction to Chart Pattern MT Chart Pattern MT is a chart pattern scanner to detect the triangle pattern, falling wedge pattern, rising wedge pattern, channel pattern and so on. Chart Pattern MT uses highly sophisticated chart pattern detection algorithm. However, we have designed it in the easy to use with intuitive user interface. Chart Pattern MT will show all the patterns in your chart in the most efficient format for your trading. You do not have to do tedious manual pattern detection an
Introduction Excessive Momentum Indicator is the momentum indicator to measure the excessive momentum directly from raw price series. Hence, this is an extended price action and pattern trading. Excessive Momentum Indicator was originally developed by Young Ho Seo. This indicator demonstrates the concept of Equilibrium Fractal Wave and Practical Application at the same time. Excessive Momentum detects the market anomaly. Excessive momentum will give us a lot of clue about potential reversal and
Awesome Oscillator by Bill Williams with the ability to fine-tune and replace the averaging algorithms of the indicator, which significantly expands the possibilities of using this oscillator in algorithmic trading and brings it closer in its properties to such an indicator as the MACD. To reduce price noise, the final indicator is processed with an additional Smooth averaging. The indicator has the ability to give alerts, send mail messages and push signals when the direction of movement of th
Forex Gump
Andrey Kozak
2.4 (5)
Forex Gump is a fully finished semi-automatic trading system. In the form of arrows, signals are displayed on the screen for opening and closing deals. All you need is to follow the instructions of the indicator. When the indicator shows a blue arrow, you need to open a buy order. When the indicator shows a red arrow, you need to open a sell order. Close orders when the indicator draws a yellow cross. In order to get the most effective result, we recommend using the timeframes H1, H4, D1. There
Antabod Gamechanger
Rev Anthony Olusegun Aboderin
*Antabod GameChanger Indicator – Transform Your Trading!*   Are you tired of chasing trends too late or second-guessing your trades? The *Antabod GameChanger Indicator* is here to *revolutionize your trading strategy* and give you the edge you need in the markets!   Why Choose GameChanger? *Accurate Trend Detection* – GameChanger identifies trend reversals with *pinpoint accuracy*, ensuring you enter and exit trades at the optimal time.   *Clear Buy & Sell Signals* – No more guesswork! T
KEYPAD SUPPORT & RESISTANCE A High-Precision Multi-Filter Market Scanner with Smart Entry Logic The Keypad Support & Resistance is a powerful multi-filter MT4 tool designed to detect high-confidence trend signals using a proprietary blend of advanced market filters and dynamic price action techniques. Built for professional traders, this tool delivers real-time entry signals, trend direction status, and live trade tracking — all in an intuitive and non-repainting visual interface. WHAT'S NEW:
FREE
PZ Harmonacci Patterns
PZ TRADING SLU
3.17 (6)
Trade smarter, not harder: Empower your trading with Harmonacci Patterns This is arguably the most complete harmonic price formation auto-recognition indicator you can find for the MetaTrader Platform. It detects 19 different patterns, takes fibonacci projections as seriously as you do, displays the Potential Reversal Zone (PRZ) and finds suitable stop-loss and take-profit levels. [ Installation Guide | Update Guide | Troubleshooting | FAQ | All Products ] It detects 19 different harmonic pric
M W Pattern Pro
Noiros Tech
4.14 (7)
M & W Pattern Pro is an advanced scanner for M and W patters , it uses extra filters to ensure scanned patterns are profitable. The indicator can be used with all symbols and time frames. The indicator is a non repaint indicator with accurate statistics calculations. To use , simply scan the most profitable pair using the statistics dashboard accuracy , then enter trades on signal arrow and exit at the TP and SL levels. STATISTICS : Accuracy 1 : This is the percentage of the times price hits TP
Reversal Pattern Pro
Boonyapagorn Rodvattanajinda
Reversal Patterns Pro Reversal Patterns Pro is a Price Action (PA) analytical tool that scans the reversal patterns.  - Finds and marks the most dependable Japanese candlestick patterns in real-time. - Supports all time frames (Best for Scalping) - Doesn't repaint making it an exceptional indicator for Expert Advisors. Input parameters : - Support & Resistance Mode ( true or false ) for enabling advanced filtering - Donchian Period - RSI Period - RSI Oversold Level - RSI Overbought Level - Al
Elliott Wave Trend was designed for the scientific wave counting. This tool focuses to get rid of the vagueness of the classic Elliott Wave Counting using the guideline from the template and pattern approach. In doing so, firstly Elliott Wave Trend offers the template for your wave counting. Secondly, it offers Wave Structural Score to assist to identify accurate wave formation. It offers both impulse wave Structural Score and corrective wave Structure Score. Structural Score is the rating to sh
Monster Harmonic Indicator
Paul Geirnaerdt
4.59 (29)
Monster Harmonics Indicator is a harmonic pattern indicator. It recognizes Gartley, Bat, Crab, Butterfly, Cypher, White Swan, Black Swan, Shark and several other patterns. Projected patterns that are not yet completed are recognized, too. Monster even shows the PRZ (Potential Reversal Zone). Users can add their own user defined patterns to Monster. Besides the current pattern, Monster also shows all patterns in the symbols history. Monster will provide alerts for developing patterns. Introduced
Infinity Trend Pro
Yaroslav Varankin
1 (1)
This is a trend indicator without redrawing Developed instead of the binary options strategy (by the color of the Martingale candlestick) Also works well in forex trading When to open trades (binary options) A signal will appear in the place with a candle signaling the current candle It is recommended to open a deal for one candle of the current timeframe M1 and M5 When a blue dot appears, open a deal up When a red dot appears, open a trade down. How to open trades on Forex. When a signal is rec
This indicator is another variant of the famous powerful indicator Fibonacci-SS https://www.mql5.com/en/market/product/10136 but has different behaviour in placing Pending Order and TP Line. Automatically places Fibonacci retracement lines from the last highest and lowest visible bars on the chart with: An auto Pending Order (Buy/Sell). Taking Profit 1, Taking Profit 2 is pivot point and Taking Profit 3 for extended reward opportunity. The best risk and reward ratio. Simple and powerful indicat
CyberZingFx Volume Plus
Afsal Meerankutty
4.93 (15)
Advanced version of CyberZingFx Volume Plus, the ultimate MT4 indicator for traders seeking highly accurate buy and sell signals. With an additional strategy and price action dot signals that enhances its effectiveness, this indicator offers a superior trading experience for professionals and beginners alike. The CyberZingFx Volume Plus Advanced version combines the power of volume analysis and historical price data with an additional strategy, resulting in even more precise and reliable signals
Stochastic Divergen MT4
Komang Putra Riswanjaya
Overview The Stochastic Divergence Indicator is a tool designed to help identify potential market turning points by analyzing divergences between price and the Stochastic Oscillator. It highlights divergence signals visually on the chart, assisting traders in observing possible trend changes. Key Features No Repaint: Once a signal is formed, it remains on the chart. Adjustable Parameters: Settings can be modified to fit different trading preferences and timeframes. Visual Display: Arrows are pl
Chart Patterns Detect 15 patterns (Ascending Triangle, Descending Triangle, Rising Wedge, Falling Wedge, Bullish Flag, Bearish Flag, Bullish Rectangle, Bearish Rectangle Symmetrical triangle, Head and Shoulders, Inverted Head and Shoulders, Triple top, Triple Bottom, Double Top, Double Bottom) Use historical data to calculate the probability of each pattern to succeed (possibility to filter notification according to the chance of success) gives graphic indication about the invalidation level and
CityScape summarizes prices into an easy to read pattern that oscillates between 0 and 1. Repetition of CityScape pattern may indicate that the price pattern will also be repeated. CityScape pattern can be used as a quick reference to predict what the price may do by looking for a similar CityScape Pattern in the recent past. Cross currency pairs and cross timescale pattern comparisons may also provide insight into what the price will do. Inputs Local Max period: Controls the width of the CityS
True SnD
Indra Lukmana
5 (1)
This Supply & Demand indicator uses a unique price action detection to calculate and measures the supply & demand area. The indicator will ensure the area are fresh and have a significant low risk zone. Our Supply Demand indicator delivers functionality previously unavailable on any trading platform. Trading idea You may set pending orders along the supply & demand area. You may enter a trade directly upon price hit the specific area (after a rejection confirmed). Input parameters Signal - Set
Pivots Dashboard
Noiros Tech
5 (1)
Pivots Dashboard is the single most complete instruments set for Pivot Points trading currently available in the market. We have done a comprehensive research prior to the product design to make sure that this product meets every need of Pivot Point trading. Pivots Points are significant levels technical analysts can use to determine directional movement and potential support/resistance levels. Pivot Points are thus predictive or leading indicators. While the points were originally used by floor
The SMC Venom Model BPR indicator is a professional tool for traders working within the Smart Money (SMC) concept. It automatically identifies two key patterns on the price chart: FVG (Fair Value Gap) is a combination of three candles, in which there is a gap between the first and third candles. It forms a zone between levels where there is no volume support, which often leads to a price correction. BPR (Balanced Price Range) is a combination of two FVG patterns that form a “bridge” - a zone of
MetaTrend M4
Vahidreza Heidar Gholami
Meta Trend Indicator is an efficient way to forecast and detect the trend in any market. It reveals the trend, support and resistance levels, volatility and the maximum potential target, all in one indicator. To adapt to the price and to decrease consecutive trend failures, the internal trend detector algorithm studies the market and dynamically chooses the right values for the internal parameters. This indicator is a perfect trend filter for any strategy or expert advisor. Features Super Adapti
How to use Pair Trading Station Pair Trading Station is recommended for H1 time frame and you can use it for any currency pairs. To generate buy and sell signal, follow few steps below to apply Pair Trading Station to your MetaTrader terminal. When you load Pair Trading Station on your chart, Pair Trading station will assess available historical data in your MetaTrader platforms for each currency pair. On your chart, the amount of historical data available will be displayed for each currency pai
Fibonacci Magic Pivot Levels
Savia Forex Software Solutions
Fibonacci Magic Pivot Levels The  Fibonacci Magic Pivot Levels  is a  powerful yet easy to use indicator . It   continuously monitor s intra-day  price action  and uses complex algorithms to calculate and detect key support, resistance and pivot levels, using the D1 timeframe as a filter.  The    Fibonacci Magic Pivot Levels is optimized for H4, H1, M30, M15, M5 & M1 timeframes and  can be used on ALL Currencies, Indices, Commodities, and Cryptocurrency pairs . Trade with improved confidence an
Fourteen plus nine TD Sequential
MOHAMMED IMAD HUSSEIN BASSEE
Fourteen plus nine What is it for? Applying Tom DeMark’s TD Sequential serves the purpose of identifying a price point where an uptrend or a downtrend exhausts itself and reverses. . What are the main components of TD Sequential? TD Sequential has two parts – TD Setup and TD Countdown. The first phase of TD Sequential starts with a TD Setup and is completed with a 9 count. When the 9 count is completed, it is at that point, a price pause, price pullback, or reversal is likely. It is also at tha
Quantum Heiken Ashi PRO MT4
Bogdan Ion Puscasu
4.33 (6)
Introducing the   Quantum Heiken Ashi PRO charts with alerts Designed to provide clear insights into market trends, the Heiken Ashi candles are renowned for their ability to filter out noise and eliminate false signals. Say goodbye to confusing price fluctuations and hello to a smoother, more reliable chart. What makes the Quantum Heiken Ashi PRO truly unique is its innovative formula, which transforms traditional candlestick data into easy-to-read colored bars. Red and green bars elegantly high
PZ Divergence Trading
PZ TRADING SLU
5 (2)
Unlock hidden profits: accurate divergence trading for all markets Tricky to find and scarce in frequency, divergences are one of the most reliable trading scenarios. This indicator finds and scans for regular and hidden divergences automatically using your favourite oscillator. [ Installation Guide | Update Guide | Troubleshooting | FAQ | All Products ] Easy to trade Finds regular and hidden divergences Supports many well known oscillators Implements trading signals based on breakouts Display
Advance Currency Meter is a currency meter that detects strong market trends. This indicator is good for scalping, intraday trading and swing trading. The indicator will detect short term to long term market trends. This will give you good insight which currencies are best to trade as of the moment. Note : Kindly contact me before you make any purchases. This won't work on your account without my permission. Note :   Works well with my MACD Currency Strength Meter
Intraday Levels shows intraday levels grid for intraday trading Shows a grid for the day levels, gives you a guide to know the trend and to measure intraday trades (stop-loss and take-profit). Parameters are: Levels Mode: Basic mode: Shows highest, lowest and middle levels. Advanced mode: Shows highest, lowest, middle and intermediate levels. Fibonacci mode: Shows session Fibonacci retracements levels. Momentum mode: Shows delayed Advanced levels to identify momentum. Smooth Period (Momentum m
All Symbols   AND  All Time frames Scan                                                                                                                 Document Introduction   The ABCD is a basic harmonic pattern. The ABCD pattern is a visual, geometric chart pattern comprised of three consecutive price swings. It looks like a diagonal lightning bolt and can indicate an upcoming trading opportu
Buyers of this product also purchase
Algo Pumping MT4
Ihor Otkydach
4.92 (13)
PUMPING STATION – Your Personal All-inclusive strategy Introducing PUMPING STATION — a revolutionary Forex indicator that will transform your trading into an exciting and effective activity! This indicator is not just an assistant but a full-fledged trading system with powerful algorithms that will help you start trading more stable! When you purchase this product, you also get FOR FREE: Exclusive Set Files: For automatic setup and maximum performance. Step-by-step video manual: Learn how to tra
The "Binary Smart Eye" MT4 indicator is designed to provide trading signals for both binary options and forex markets, operating across a wide range of timeframes from M1 to W1. It employs a proprietary strategy that combines trend levels, an intelligent moving average, and optimized trading periods to identify potential entry points. Here's a breakdown of its key features: Multi-Timeframe Analysis: The indicator's versatility allows traders to utilize it on various timeframes, catering to diffe
Dynamic Forex28 Navigator
Bernhard Schweigert
5 (5)
Specials Discount now. The Next Generation Forex Trading Tool. Dynamic Forex28 Navigator is the evolution of our long-time, popular indicators, combining the power of three into one: Advanced Currency Strength28 Indicator (695 reviews) + Advanced Currency IMPULSE with ALERT (520 reviews) + CS28 Combo Signals (recent Bonus) Details about the indicator  https://www.mql5.com/en/blogs/post/758844 What Does The Next-Generation Strength Indicator Offer? Everything you loved about the originals, now
Cycle Maestro
Stefano Frisetti
1 (1)
If a new green  NOTE: CYCLEMAESTRO is distributed only on this website, there are no other distributors. Demo version is for reference only and is not supported. Full versione is perfectly functional and it is supported CYCLEMAESTRO , the first and only indicator of Cyclic Analysis, useful for giving signals of TRADING, BUY, SELL, STOP LOSS, ADDING. Created on the logic of  Serghei Istrati  and programmed by  Stefano Frisetti ;  CYCLEMAESTRO  is not an indicator like the others, the challenge wa
ACB Breakout Arrows
KEENBASE SOFTWARE SOLUTIONS
4.15 (34)
The ACB Breakout Arrows indicator provides a crucial entry signal in the market by detecting a special breakout pattern. The indicator constantly scans the chart for a settling momentum in one direction and provide the accurate entry signal right before the major move.  Get multi-symbol and multi-timeframe scanner from here - Scanner for ACB Breakout Arrows MT4 Key features Stoploss and Take Profit levels are provided by the indicator. Comes with a MTF Scanner dashboard which tracks the breako
PZ Trend Trading
PZ TRADING SLU
4.8 (5)
Capture every opportunity: your go-to indicator for profitable trend trading Trend Trading is an indicator designed to profit as much as possible from trends taking place in the market, by timing pullbacks and breakouts. It finds trading opportunities by analyzing what the price is doing during established trends. [ Installation Guide | Update Guide | Troubleshooting | FAQ | All Products ] Trade financial markets with confidence and efficiency Profit from established trends without getting whip
Scalper Inside PRO
Alexey Minkov
4.74 (66)
An exclusive indicator that utilizes an innovative algorithm to swiftly and accurately determine the market trend. The indicator automatically calculates opening, closing, and profit levels, providing detailed trading statistics. With these features, you can choose the most appropriate trading instrument for the current market conditions. Additionally, you can easily integrate your own arrow indicators into Scalper Inside Pro to quickly evaluate their statistics and profitability. Scalper Inside
The AT Forex Indicator MT4 is a sophisticated trading tool designed to provide traders with a comprehensive analysis of multiple currency pairs. This   powerful indicator   simplifies the complex nature of the forex market, making it accessible for both novice and experienced traders. AT Forex Indicator uses   advanced algorithms   to detect trends, patterns and is an essential tool for traders aiming to enhance their forex trading performance. With its robust features, ease of use, and reliabl
PZ Mean Reversion MT4
PZ TRADING SLU
3 (4)
Outperform traditional strategies: effective mean reversion for savvy traders Unique indicator that implements a professional and quantitative approach to mean reversion trading. It capitalizes on the fact that the price diverts and returns to the mean in a predictable and measurable fashion, which allows for clear entry and exit rules that vastly outperform non-quantitative trading strategies. [ Installation Guide | Update Guide | Troubleshooting | FAQ | All Products ] Clear trading signals Am
Beast Super Signal
Dustin Vlok
4.73 (89)
Limited special now on!  BUY 1 GET 1 FREE!! Purchase the indicator for only $199, and get the Beast Super Signal EA valued at $399 for FREE!!! The Beast Super Signal indicator is a straightforward, trend-based indicator that's easy to use. It continuously monitors current market conditions, looking for new trends or opportunities to join existing ones. When all of its internal strategies align perfectly, the indicator provides a buy or sell signal. Just act on the signal arrow alert; no additi
All in One Trade
Alexey Minkov
4.48 (27)
The All-in-One Trade Indicator (AOTI) determines daily targets for EURUSD, EURJPY, GBPUSD, USDCHF, EURGBP, EURCAD, EURAUD, AUDJPY, GBPAUD, GBPCAD, GBPCHF, GBPJPY, AUDUSD, and USDJPY. All other modules work with any trading instruments. The indicator includes various features, such as Double Channel trend direction, Price channel, MA Bands, Fibo levels, Climax Bar detection, and others. The AOTI indicator is based on several trading strategies, and created to simplify market analysis. All-in-One
MTF Supply Demand Zones
Georgios Kalomoiropoulos
4.82 (22)
Next Generation Of Automated Supply And Demand Zones. New and Innovative Algorithm that Works At Any Chart. All Zones Are Being Created Dynamically According To Price Action Of The Market. AMAZING OFFER --> Activations from 5 to 20 for "MTF Supply Demand Zones" and "Automated Trendlines" If you get the MTF Supply Demand Zones you can join the " Trade Like Me " Video Series. It contains 14 Live Sessions where  i am placing trades on Forex, Stocks, Indices and Metals. You will be able to see ho
TPSproTREND PrO
Roman Podpora
4.68 (25)
Entry points at the bar close,  without redrawing .  Trend scanner  across all assets,  MTF - mode  and much more in one tool. We recommend using it together with   RFI LEVELS. ИНСТРУКЦИЯ RUS   /   INSTRUCTIONS  ENG         /        VERSION MT5 Main functions: Accurate entry signals WITHOUT REPAINTING! Once a signal appears, it remains valid! This is a significant distinction from repainting indicators that might provide a signal and then alter it, potentially leading to deposit losses. Now, you
RelicusRoad Pro
Relicus LLC
4.63 (105)
How many times have you bought a trading indicator with great back-tests, live account performance proof with fantastic numbers and stats all over the place but after using it, you end up blowing your account? You shouldn't trust a signal by itself, you need to know why it appeared in the first place, and that's what RelicusRoad Pro does best! User Manual + Strategies + Training Videos + Private Group with VIP Access + Mobile Version Available A New Way To Look At The Market RelicusRoad is th
The " Dynamic Scalper System " indicator is designed for the scalping method of trading within trend waves. Tested on major currency pairs and gold, compatibility with other trading instruments is possible. Provides signals for short-term opening of positions along the trend with additional price movement support. The principle of the indicator. Large arrows determine the trend direction. An algorithm for generating signals for scalping in the form of small arrows operates within trend waves.
Unlimited use version is available at $180 sale. Sale will last for first few months. (actual price $210 after that)  Detailed blog post with screenshots here: https://www.mql5.com/en/blogs/post/762513 Features: This scanner will show: NRTR Basket Trading Trend direction Last NRTR Switch (breakout) - number of bars and if it was a high volume bar How many bars has the SR stayed steady for When price last entered an NRTR shadow When price bounced off the NRTR shadow back inside NRTR Explained:
Currently 20% OFF ! Best Solution for any Newbie or Expert Trader! This dashboard software is working on 28 currency pairs plus one. It is based on 2 of our main indicators (Advanced Currency Strength 28 and Advanced Currency Impulse). It gives a great overview of the entire Forex market plus Gold or 1 indices. It shows Advanced Currency Strength values, currency speed of movement and signals for 28 Forex pairs in all (9) timeframes. Imagine how your trading will improve when you can watch the e
Blahtech Supply Demand
Blahtech Limited
4.58 (36)
Was: $299  Now: $149   Supply Demand uses previous price action to identify potential imbalances between buyers and sellers. The key is to identify the better odds zones, not just the untouched ones. Blahtech Supply Demand indicator delivers functionality previously unavailable on any trading platform. This 4-in-1 indicator not only highlights the higher probability zones using a multi-criteria strength engine, but also combines it with multi-timeframe trend analysis, previously confirmed swings
Linear Trend Predictor - A trend indicator that combines entry points and direction support lines. It works on the principle of breaking through the High/Low price channel. The indicator algorithm filters market noise, takes into account volatility and market dynamics. Indicator capabilities Using smoothing methods, it shows the market trend and entry points for opening BUY or SELL orders. Suitable for determining short-term and long-term market movements by analyzing charts on any timeframes.
Enigmera
Ivan Stefanov
5 (8)
ENIGMERA: The core of the market The indicator’s code has been completely rewritten. Version 3.0 adds new functionalities and removes bugs that had accumulated since the indicator’s inception. Introduction This indicator and trading system is a remarkable approach to the financial markets . ENIGMERA uses the fractal cycles to accurately calculate support and resistance levels. It shows the authentic accumulation phase and gives direction and targets.  A system that works whether we are in a tre
PZ Day Trading
PZ TRADING SLU
3.67 (3)
Effortless trading: non-repainting indicator for accurate price reversals This indicator detects price reversals in a zig-zag fashion, using only price action analysis and a donchian channel. It has been specifically designed for short-term trading, without repainting or backpainting at all. It is a fantastic tool for shrewd traders aiming to increase the timing of their operations. [ Installation Guide | Update Guide | Troubleshooting | FAQ | All Products ] Amazingly easy to trade It provides
Cycle Sniper
Elmira Memish
4.39 (36)
NEW YEAR SALE PRICE FOR LIMITED TIME!!! Please contact us after your purchase and we will send you the complimentary indicators to complete the system Cycle Sniper is not a holy grail but when you use it in a system which is explained in the videos, you will feel the difference. If you are not willing to focus on the charts designed with Cycle Sniper and other free tools we provide, we recommend not buying this indicator. We recommend watching the videos about the indiactor and system before pu
Supply and Demand Dashboard PRO
Bernhard Schweigert
4.8 (20)
Currently 20% OFF ! This dashboard is a very powerful piece of software working on multiple symbols and up to 9 timeframes. It is based on our main indicator (Best reviews:   Advanced Supply Demand ). The dashboard gives a great overview. It shows: Filtered Supply and Demand values including zone strength rating, Pips distances to/and within zones, It highlights nested zones, It gives 4 kind of alerts for the chosen symbols in all (9) time-frames. It is highly configurable for your personal n
Grabber System
Ihor Otkydach
5 (1)
Let me introduce you to an excellent technical indicator – Grabber, which works as a ready-to-use "All-Inclusive" trading strategy. Within a single code, it integrates powerful tools for technical market analysis, trading signals (arrows), alert functions, and push notifications. Every buyer of this indicator also receives the following for free: Grabber Utility for automatic management of open orders Step-by-step video guide: how to install, configure, and trade with the indicator Custom set fi
Volatility Trend System - a trading system that gives signals for entries. The volatility system gives linear and point signals in the direction of the trend, as well as signals to exit it, without redrawing and delays. The trend indicator monitors the direction of the medium-term trend, shows the direction and its change. The signal indicator is based on changes in volatility and shows market entries. The indicator is equipped with several types of alerts. Can be applied to various trading ins
"The Squeeze indicator attempts to identify periods of consolidation in a market. In general the market is either in a period of quiet consolidation or vertical price discovery. By identifying these calm periods, we have a better opportunity of getting into trades with the potential for larger moves. Once a market enters into a "squeeze," we watch the overall market momentum to help forecast the market direction and await a release of market energy." Modified TTM Squeeze Indicator is a modifica
NAM Order Blocks
NAM TECH GROUP, CORP.
3.67 (3)
MT4 Multi-timeframe Order Blocks detection indicator. Features - Fully customizable on chart control panel, provides complete interaction. - Hide and show control panel wherever you want. - Detect OBs on multiple timeframes. - Select OBs quantity to display. - Different OBs user interface. - Different filters on OBs. - OB proximity alert. - ADR High and Low lines. - Notification service (Screen alerts | Push notifications). Summary Order block is a market behavior that indicates order collection
Supreme Commander
Ramon Sobrevals Arce
4.13 (8)
The indicator of the indicators. The Most Powerful Technique to Determine Forex Trend Strength in 2023. We have perfected Supreme Commander that it calculates an average of the selected indicators (up to 16) and the selected timeframe (all) with the result of a single trend that indicates the potential of buying and selling.  It includes the following indicators: Accelerator/Decelerator oscillator Average Directional Movement Index Awesome oscillator; Bulls and Bears  Commodity Channel Index; De
Hello, I am Ayman from Egypt, I want to present an interesting indicator to you. It depends on Ichimoku Kinko Hyo, but there is a secret that i use in it. By using my indicator, you will be able to know a lot of important information in the market such as: Live Signal : https://www.mql5.com/en/signals/821024 Features You can avoid entry during market turbulence You can enter orders on the general trend only You will know if the trend is strong or weak If you entered an any orders by the help of
Currency Strength Exotics
Bernhard Schweigert
4.88 (32)
CURRENTLY 20% OFF ! Best Solution for any Newbie or Expert Trader! This Indicator is specialized to show currency strength for any symbols like Exotic Pairs Commodities, Indexes or Futures. Is first of its kind, any symbol can be added to the 9th line to show true currency strength of Gold, Silver, Oil, DAX, US30, MXN, TRY, CNH etc. This is a unique, high quality and affordable trading tool because we have incorporated a number of proprietary features and a new formula. Imagine how your trading
More from author
Elliott Wave Trend was designed for the scientific wave counting. This tool focuses to get rid of the vagueness of the classic Elliott Wave Counting using the guideline from the template and pattern approach. In doing so, firstly Elliott Wave Trend offers the template for your wave counting. Secondly, it offers Wave Structural Score to assist to identify accurate wave formation. It offers both impulse wave Structural Score and corrective wave Structure Score. Structural Score is the rating to sh
Introduction to Fractal Pattern Scanner Fractal Indicator refers to the technical indicator that makes use of the fractal geometry found in the financial market. Fractal Pattern Scanner is the advanced Fractal Indicator that brings the latest trading technology after the extensive research and development work in the fractal geometry in the financial market. The most important feature in Fractal Pattern Scanner is the ability to measure the turning point probability as well as the trend probabi
Introduction to Sideways Market Analyzer Notable period of Low volatility and non-trending movements in the financial market is considered as Sideways Market. Sooner or later, the low volatility will increase and the price will pick up a trend after Sideways Market. In terms of trading point of view, Sideways Market can serve as the very good entry timing for traders. Sideways Market is also quite often the representation of accumulation of large orders from big investors. Therefore, knowing the
Introduction to Harmonic Pattern Scenario Planner The present state of Forex market can go through many different possible price paths to reach its future destination. Future is dynamic. Therefore, planning your trade with possible future scenario is an important step for your success. To meet such a powerful concept, we introduce the Harmonic Pattern Scenario Planner, the first predictive Harmonic Pattern Tool in the world among its kind. Main Features Predicting future patterns for scenario
Mean Reversion Supply Demand Indicator Mean Reversion Supply Demand is the indicator to detect the important supply demand zone in your chart. The concept of supply demand trading relies on the quantity mismatching between buying and selling volumes in the financial market. Typically, supply demand zone serves to predict the turning point. The wave pattern, for any supply demand zone to work as an successful trade, looks like the price must touch the base zone, move away and then return to zone
Peak Trough Analysis is the great tool to detect peaks and troughs in your chart. Peak Trough Analysis tool can use three different peaks and troughs detection algorithm. The three algorithm include the orignal Fractals Indicator by Bill Williams, the Modified Fractals indicator and ZigZag indicator. You can use this peak and trough analysis tool to detect the price pattern made up from Equilibrium Fractal-Wave process. For further usage, there are good guide line on how to use this peak trough
FREE
Introduction to Fractal Pattern Scanner Fractal Indicator refers to the technical indicator that makes use of the fractal geometry found in the financial market. Fractal Pattern Scanner is the advanced Fractal Indicator that brings the latest trading technology after the extensive research and development work in the fractal geometry in the financial market. The most important feature in Fractal Pattern Scanner is the ability to measure the turning point probability as well as the trend probabil
Introduction This indicator detects volume spread patterns for buy and sell opportunity. The patterns include demand and supply patterns. You might use each pattern for trading. However, these patterns are best used to detect the demand zone (=accumulation area) and supply zone (=distribution area). Demand pattern indicates generally potential buying opportunity. Supply pattern indicates generally potential selling opportunity. These are the underlying patterns rather than direct price action. T
FREE
Introduction to X3 Chart Pattern Scanner X3 Cherart Pattern Scanner is the non-repainting and non-lagging indicator detecting X3 chart patterns including Harmonic pattern, Elliott Wave pattern, X3 patterns, and Japanese Candlestick patterns. Historical patterns match with signal patterns. Hence, you can readily develop the solid trading strategy in your chart. More importantly, this superb pattern scanner can detect the optimal pattern of its kind. In addition, you can switch on and off individu
Introduction to Chart Pattern MT Chart Pattern MT is a chart pattern scanner to detect the triangle pattern, falling wedge pattern, rising wedge pattern, channel pattern and so on. Chart Pattern MT uses highly sophisticated chart pattern detection algorithm. However, we have designed it in the easy to use with intuitive user interface. Chart Pattern MT will show all the patterns in your chart in the most efficient format for your trading. You do not have to do tedious manual pattern detection an
Introduction This indicator detects volume spread patterns for buy and sell opportunity. The patterns include demand and supply patterns. You might use each pattern for trading. However, these patterns are best used to detect the demand zone (=accumulation area) and supply zone (=distribution area). Demand pattern indicates generally potential buying opportunity. Supply pattern indicates generally potential selling opportunity. These are the underlying patterns rather than direct price action. T
Introduction to Harmonic Pattern Scenario Planner The present state of Forex market can go through many different possible price paths to reach its future destination. Future is dynamic. Therefore, planning your trade with possible future scenario is an important step for your success. To meet such a powerful concept, we introduce the Harmonic Pattern Scenario Planner, the first predictive Harmonic Pattern Tool in the world among its kind. Main Features Predicting future patterns for scenario
Ace Supply Demand Zone Indicator The concept of supply demand relies on the quantity mismatching between buying and selling volumes in the financial market. Supply and demand zone can provide the good entry and exit. A zone is easier to trade than a line. The supply demand zone can provide the detailed trading plan and the risk management. Its ability to predict market direction is high. There are two distinctive points about Ace Supply Demand Zone Indicator. Ace Supply Demand Zone indicator was
Introduction to Fractal Moving Average Fractal Moving Average indicator was designed as part of Fractal Pattern Scanner. Inside Fractal Pattern Scanner, Fractal Moving Average Indicator was implemented as multiple of chart objects. With over thousands of chart object, we find that it was not the best and efficient ways to operate the indicator. It was computationally too heavy for the indicator. Hence, we decide to implement the indicator version of Fractal Moving Average indicator to benefit ou
FREE
Auto Chart Alert MT5
Young Ho Seo
3.83 (6)
Introduction Auto Chart Alert is a convenient tool to set alert for your trading in your chart. With Auto Chart Alert, you can set the alert line in one click in your desired location in your chart. You can even set alert over the sloped lines in your chart. Auto Chart Alert is a great tool when you have to watch out importnat support and resistance levels for your trading. You can receive the sound alert, email and push notification when the price hit the alert line at you desired location. Au
FREE
Time Box Indicator MT5
Young Ho Seo
4.67 (3)
Introduction To Time Box Indicator Time Box Indicator is a must have indicator for any trader. It will display daily, weekly and Monthly box according to your preferences. Yet, you can extend any important price levels in your chart automatically. You can use them as the significant support and resistance levels. It is very simple but effective tool for your trading. Graphic Setting Use White Chart Line Style for Current Open price Daily Setting Update Timeframe for daily box Number of days to
FREE
Ace Supply Demand Zone Indicator The concept of supply demand relies on the quantity mismatching between buying and selling volumes in the financial market. Supply and demand zone can provide the good entry and exit. A zone is easier to trade than a line. The supply demand zone can provide the detailed trading plan and the risk management. Its ability to predict market direction is high. There are two distinctive points about Ace Supply Demand Zone Indicator. Ace Supply Demand Zone indicator was
Introduction to Fibonacci Volatility Indicator Volatility indicator can help you to detect any statistical advantage for your trading. Especially, if you are trading with Price Action and Price Patterns, then we recommend to use the Volatility indicator together with your strategy. Especically, Fibonacci Volatility indicator combines the market volatiltiy with Fibonacci Analysis to provide you more advanced volatiltiy indicator. Main Features Fibonacci Volatility in Z score Configuration Mode Fi
Introduction This indicator detects volume spread patterns for buy and sell opportunity. The patterns include demand and supply patterns. You might use each pattern for trading. However, these patterns are best used to detect the demand zone (=accumulation area) and supply zone (=distribution area). Demand pattern indicates generally potential buying opportunity. Supply pattern indicates generally potential selling opportunity. These are the underlying patterns rather than direct price action. T
FREE
Introduction To Turning Point Indicator The trajectories of Financial Market movement are very much like the polynomial curvatures with the presence of random fluctuations. It is quite common to read that scientist can decompose the financial data into many different cyclic components. If or any if the financial market possess at least one cycle, then the turning point must be present for that financial market data. With this assumption, most of financial market data should possesses the multipl
Peak Trough Analysis is the great tool to detect peaks and troughs in your chart. Peak Trough Analysis tool can use three different peaks and troughs detection algorithm. The three algorithm include the orignal Fractals Indicator by Bill Williams, the Modified Fractals indicator and ZigZag indicator. You can use this peak and trough analysis tool to detect the price pattern made up from Equilibrium Fractal-Wave process. For further usage, there are good guide line on how to use this peak trough
FREE
Introduction to Sideways Market Analyzer Notable period of Low volatility and non-trending movements in the financial market is considered as Sideways Market. Sooner or later, the low volatility will increase and the price will pick up a trend after Sideways Market. In terms of trading point of view, Sideways Market can serve as the very good entry timing for traders. Sideways Market is also quite often the representation of accumulation of large orders from big investors. Therefore, knowing the
Introduction Harmonic Patterns are best used to predict potential turning point. Traditionally, Harmonic Pattern was identified manually connecting peaks and troughs points in the chart. Manual harmonic pattern detection is painfully tedious and not suitable for everyone. You are often exposed under subjective pattern identification with manual pattern detection. To avoid these limitations, Harmonic Pattern Plus was designed to automate your harmonic pattern detection process. The functionality
Introduction to Order Risk Management EA ORM EA is specially designed for fast and accurate market order execution to be used with our Price Action and Econometric Trading strategies listed below. ORM EA is fully automatic and ORM EA is also very easy to use. ORM EA is totally free of charge. You can also use this robust order execution feature of this ORM EA for any other your own trading strategy. Trading Strategy Guide Order Risk Management EA provides the guide for the risk management for y
FREE
Introduction to Support Resistance Risk Management Support Resistance is the most trusted technical analysis. However, the risk management for the support and resistance is not practiced often. Hence we provide one effective risk managment method for the support and resistance trader. In the book: Scientific Guide To Price Action and Pattern Trading (Wisdom of Trend, Cycle, and Fractal Wave), how to use Support Resistance is described as well as Fibonacci Analysis, Harmonic Pattern, Elliott Wave
Introduction Auto Chart Alert is a convenient tool to set alert for your trading in your chart. With Auto Chart Alert, you can set the alert line in one click in your desired location in your chart. You can even set alert over the sloped lines in your chart. Auto Chart Alert is a great tool when you have to watch out importnat support and resistance levels for your trading. You can receive the sound alert, email and push notification when the price hit the alert line at you desired location. Au
FREE
Time Box Indicator MT4
Young Ho Seo
4.71 (7)
Introduction To Time Box Indicator Time Box Indicator is a must have indicator for any trader. It will display daily, weekly and Monthly box according to your preferences. Yet, you can extend any important price levels in your chart automatically. You can use them as the significant support and resistance levels. It is very simple but effective tool for your trading. Graphic Setting Use White Chart Line Style for Current Open price Daily Setting Update Timeframe for daily box Number of days to
FREE
Introduction to Fractal Moving Average Fractal Moving Average indicator was designed as part of Fractal Pattern Scanner. Inside Fractal Pattern Scanner, Fractal Moving Average Indicator was implemented as multiple of chart objects. With over thousands of chart object, we find that it was not the best and efficient ways to operate the indicator. It was computationally too heavy for the indicator. Hence, we decide to implement the indicator version of Fractal Moving Average indicator to benefit o
FREE
Introduction to GARCH Indicator GARCH is the short initial for Generalized Autoregressive Conditional Heteroskedasticity and it is the volatility prediction model commonly used in financial industry. GARCH model was first appeared in the work by Danish Economist, Tim Peter Bollerslev in 1986. The 2003 Nobel Prize winner, Robert F Engle also added much contribution for the refinement of GARCH model with Tim’s work. Our GARCH INM predictor took the original method of Nelder Mead for GARCH model bu
FREE
Introduction to X3 Chart Pattern Scanner X3 Cherart Pattern Scanner is the non-repainting and non-lagging indicator detecting X3 chart patterns including Harmonic pattern, Elliott Wave pattern, X3 patterns, and Japanese Candlestick patterns. Historical patterns match with signal patterns. Hence, you can readily develop the solid trading strategy in your chart. More importantly, this superb pattern scanner can detect the optimal pattern of its kind. In addition, you can switch on and off individu
Filter:
Nasruddin Naser
82
Nasruddin Naser 2019.09.07 01:17 
 

Hi

I just purchased the indicator. But I am not able to install it to my second laptop even though the activation shows 9 out 10. Please look into this problem

bullish15
850
bullish15 2017.12.19 17:43 
 

User didn't leave any comment to the rating

ioricool
613
ioricool 2017.09.09 15:52 
 

Spent 600 dollars to buy Young Ho Seo several indicators, before finding the problem, to find Young, Ho, Seo communication, he will send a lot of PPT to you, I seriously spent 1 months to read, and the problem is still unsolved! I think a lot of websites, $1-20, can do that. I think it's a waste of money. The reason for the loss of confidence in the Young Ho Seo is the greater the signal he sees. The index would not have made such a bad EA signal if it were really helpful!https://www.mql5.com/zh/signals/103405

Bradley Bosworth
335
Bradley Bosworth 2017.07.28 19:06 
 

THIS REDRAWS, I REPEAT THIS REDRAWS. WHICH HE DOES NOT DESCRIBE IN THE PRODUCT DETAILS

- BACKTESTING IS WORTHLESS

- FORWARD TESTING IS DANGEROUS AS PATTERNS APPEAR, THEN DISAPPEAR

- ONLY PATTERNS THAT SUCCEED REMAIN, THE FAILED PATTERNS DISAPPEAR

When I asked the creator if it did (to make sure it wasn't just my mt4) his response was "learn to trade, read our book, buy more indicators". When all I wanted to know is if it repainted.

Apparently I am "wrong" for trading the breakout of the patterns with this system. That's not what you're supposed to do. And be careful, when the price breaks the pattern and you enter the trade, and the price doesn't actually move in that direction, the pattern will just repaint as if the original pattern never existed.

Awesome design, wish it didn't repaint, but also wish the seller wasn't so derogatory and negative towards me as a customer who just paid 250$ for this.

Alfredo Sabatini
387
Alfredo Sabatini 2017.01.07 20:21 
 

User didn't leave any comment to the rating

nguyenphanduc
199
nguyenphanduc 2016.11.20 17:10 
 

Best indicator I ever buy :)

mpantogi
322
mpantogi 2016.10.25 03:06 
 

I bought your system and help me very much to improve my trading skills.Make an excellent work.

Xamanus
141
Xamanus 2016.04.22 12:47 
 

After using it for many months, i can say its nothing great. Use an auto trendline indicator ( available free on the net) which is 10 times better then this.

CapitalPig
76
CapitalPig 2015.11.29 21:19 
 

Lots of bang for your buck in this indicator. It's really three systems in one: Smart Renko, Candlestick pattern recognition, and the price breakout patterns. These could all be used as individual trading systems if combined with support/resistance study. I personally turn on the candlestick patterns, but leave out smart renko (I prefer trading the raw candles).

Principle Analysis
310
Principle Analysis 2015.07.09 01:05 
 

Nice software, well designed and executed. It helps you easily identify current patterns so you can setup your trades. I don't trade on this independently, I use other indicators and pivots to execute the trades, but this is a great supplement. Well done.

Ziyu Yu
950
Ziyu Yu 2015.04.13 13:19 
 

I bought this product last week, and this is my first day of using this Indicators.

1) easy to set up

2) instant signal once detected

3) great backtest with historical data which gives better confidence to traders

4) service and expertise from the Author is for sure 5 stars

Keep on your excellent work.

regards

Richard Caughell
1580
Richard Caughell 2014.12.12 23:34 
 

This is like having a seasoned trader sitting next to you pointing out the patterns as they form. Very powerful. No trader who trades price action can go wrong with this tool. Any other trader can use this as confirmation with whatever tool they use. So again every trader should have this.

[Deleted] 2014.10.21 10:52 
 

User didn't leave any comment to the rating

Reply to review
Version 7.2 2022.03.03
In version 7.2, we have some minor improvement on Price Breakout Pattern Scanner.

Head and Shoulder - Common tradable pattern.
Reverse Head and Shoulder - This pattern is the reverse formation of the Head and Shoulder.
Double Top - When the price hits resistance level twice and decline toward the support level, the trader can anticipate sudden bearish breakout through the support level.
Double Bottom - The double bottom pattern is the reverse shape of the Double Top.
Triple Top - When the price hits resistance level three times and decline toward the support level, the trader can anticipate sudden bearish breakout through the support level.
Triple Bottom - The triple top pattern is the reverse pattern of the triple top.
Triangle - Several different types of triangle pattern include symmetric Triangle, Ascending Triangle and Descending Triangle.
Rising wedge - This pattern is similar to triangle. However, their angle is stiffer than standard triangle.
Falling wedge -This pattern has similar look to triangle too. However, their angle is stiffer than standard triangle.
52 Candlestick patterns – the Price Breakout Pattern Scanner can detect 52 different bearish and bullish candlestick patterns include hanging man, shooting star, engulfing, doji, Harami, etc.
Version 7.1 2019.05.24
In version 7.1, Candle stick pattern name will be prinited as tooltip in your chart for easy readibility. Just move your mouse over the candle stick pattern.

In MetaTrader 4, tooltip is less responsive than MetaTrader 5. But you can just click the text and move your mouse over the object to see the tooltip (=name of candlestick pattern).

All just minor update though.
Version 7.0 2018.10.03
In version 7.0, user can enable alert, email and push notification for candlestick patterns.
Version 6.9 2018.03.08
In version 6.9, you can copy the lines from Smart Renko indicator window to main window automatically.
Version 6.8 2017.06.22
In Version 6.8, Now multiple pattern locking is allowed. This means that trader can lock as many pattern as he want in the chart. This feature not only protects traders from the repainting and redrawing issues of the classic Pattern trading but also trader can enhance his trading performance by incorporating multiple timeframe patterns analysis at ease.
Version 6.6 2016.09.15
In version 6.6, we have allowed buttons for each time frame usable when users apply the Price Breakout Pattern Scanner for multiple time frame in single chart. Features and functionality remaining the same as version 6.5.
Version 6.5 2016.09.05
In version 6.5, user can choose calculation timeframe for Price Breakout Pattern Scanner. This means that user can detect and display Patterns in multiple timeframe in single chart. For example, user can apply the Price Breakout Pattern Scanner four times with different time frame of calculation. For example, you can load Price Breakout Pattern Scanner for M15, H1, H4, D1 and W1 timeframe in one chart (note that this might be heavy for your computer). To make it bit lighter for your computer, you can load price breakout Pattern scanner for H1, H4 and D1 timeframe. As a results, user can have a convenient total geometric analysis in fully automatic manner. Most of features remains the same. As before, Pattern Button locks or unlocks the pattern of your interest. When you have the multiple Price Breakout Pattern Scanner loaded on your chart, the pattern button will lock all the patterns from each time frame. Likewise, Symbol button will recalculate all Price Breakout Pattern Scanner in your chart. However, you can only forward or backward play the patterns for one time frame only. Five more Price Breakout Pattern Scanner means that 5 more computation. Therefore, make sure that you know how much you are loading for your cpu and memory. Really looking forward to deliver this powerful feature to our customers.
Version 6.3 2016.07.28
We have implemented three new features succesfully for our tools.

Feature 1: Options to switch on and off each pattern type. With this option, you can switch off or switch on any pattern type as you wish. For example, you can turn off Bat pattern from Harmonic Pattern Plus. You can do the same for the price Breakout Pattern Scanner. For example, if you do not want to see Head and Shoulder pattern, then you can just switch it off. This feature is very intuitive. You just need to set the switch on or off in your Indicator Input settings.

Feature 2: Options to filter out small patterns. We will add “Pattern Size Filter” input. With this input, you can filter out small patterns and you can only trade with big patterns. You can use this feature in our Price Breakout Pattern Scanner too as well as with Harmonic Pattern Scenario Planner. Pattern Size Filter is simply done by counting number of candles inside patterns. So Make Pattern Size Filter large, then you will only see large patterns. If you want to see any patterns, then just set Pattern Size Filter = 0.

Feature 3 (only applied to Price Breakout Pattern Scanner): Just like in Harmonic Pattern Plus, you will be able to recalculate and research patterns in Price breakout Patten Scanner by pressing “Symbol” buttons.
Version 6.2 2016.06.22
In the version 6.2, You can draw round number at the background.
Set Round Number Spacing to zero if you don't want to see these round numbers from your chart.
Version 6.0 2016.06.09
Smart Renko version 6.0, Smart Renko can draw the brick the same level on your chart regardless of amount of historical bars and Meta Trader platforms. To do this, you need to choose the brick height which is the factor of 100 pip or factor of 1000 pips with Brick Height Mode = 0.

For example, you can use Brick Height (in pips) = 10, 20, 25, 50, 100, 200, 500, etc, as they are the fact of 100 or 1000 pips. As long as you are using these brick height, the brick will be drawn in the same level regardless of the amount of historical bars and your brokers. This is really good property as traders can develop strategy universally working across different platform.

This improved version of Smart Renko 6.0 is included in the new update for Price Breakout Pattern Scanner. Number of detected patterns can be different according to your brick height and now you can even find that pattern specially formed around psychological number (round number) if this is one of your preferred strategy.
Version 5.7 2016.05.23
In version 5.7, Price Breakout Pattern Scanner can detect pattern using Renko Brick calulation. This is equivalent to detect pattern over the dedicated Renko Chart (Imagine that you have opened Renko Chart and then put this indicator over the Renko Chart). So it is very powerful due to less noise in the Renko Chart. The good news is that you don't need a dedicated Renko Chart as this indicators does renko brick calculation at the background using Smart Renko Indicator.

At the same time, user can choose to detect pattern over normal candle stick too as before. To choose the detection mode, user can use the following variable.

Use Renko Filter for Pattern detection : true or false only

We have currently set the default as Renko Filter Mode.

(Important note, Renko can be calculated sub time frame. For example, Renko brick can be calculated using M5 or M15 time frame when you actually put this indicator on H1 chart. If the data is loaded, then there is not a problem. But sometime, data loading may be issue. But this is the issue present inside Meta Trader terminal. It might be fixed in the future. To avoid this issue, your default calculation time for Renko brick calculation is set to current time frame. But you can always change to experiment. In our experience, there can be small difference when you change the calculation time frame.)

Version 5.5 2016.04.29
In version 5.5, Now you can display Price Breakout Pattern as support and resistance mode.

This feature can help traders to identify important support and resistance for their trading.

To enable support and resistance mode, just set "Display As Support Resistance" = true

Version 5.3 2016.04.26
In version 5.3, Price Breakout Pattern Scanner can use most of the feature of Smart Renko.
Version 5.2 2016.04.12
In the version 5.2, if you set the ButtonTextSize = 0, then you can hide buttons from your chart. Really minor update. Probably, it will be useful in case of a small screen.
Version 5.1 2015.11.18
In version 5.1, minor update only. Graphical objects were drawn in background rather than foreground.
Version 3.9 2015.10.19
- Now users can hide buttons on their charts by clicking "BT" button on a chart.
- Minor updates.
Version 3.8 2015.08.20
In version 3.8, now user can select how many historical bars to scan to detect pattern.

Note that this feature is great so you can study How breakout patterns evolved through historcal data. This is very powerful feature. For example, you can learn how breakout patterns worked in 2005 and compare its appearance on 2015. You can apply this knowledge for your trading. Something like this can't be achieved by manual traders.


However, scanning more bars requires a lot more computation time. So please be careful in using this feature. Also maxium number of patterns indicators can search and store is 1000 patterns. So Know that there is some limitation too.


For average traders, 1500 bars (default setting) is more than fine.


Kind regards.
Version 3.7 2015.06.08
In the version 3.7, Price Breakout Pattern Scanner can call the partial functionality of Smart Renko indicators. However, use of Smart Renko indicator is optional and user can decide not to use this Smart Renko partial functionality (just use Price Breakout Pattern Scanner as in the previous version).


There are some differences between MT5 Price Breakout Pattern Scanner and MT4 Price Breakout Pattern Scanner in calling Smart Renko indicator internally.


MT5 Price Breakout Pattern scanner can call most of functionality of Smart Renko indicator whereas MT4 Price Breakout Pattern Scanner can only use some functionality of Smart Renko indicators. This is caused by the programming structure difference between MT4 and MT5 terminals (i.e. MT4 terminal does not use indicator handle yet). This is beyond my programming ability.


However, the partial functionality of MT4 Price Breakout Pattern Scanner can still offer much more clear entry and exit decisions for traders. This is even more true for MT5 Price Breakout Pattern Scanner.


To control the Smart Renko indicator from Price Breakout Pattern Scanner, users can control the following inputs from Price Breakout Pattern Scanner.


=========================== Input description ==========================

Brick Height Mode: choose between 0 and 1. Brick Height Mode 0 = User specified input for Brick height. Brick height Mode 1 = automatic calculation of Brick height using standard deviation and Z value.


Brick Height value: If Brick Height Mode is 0, this uses specified pip value for brick height. If Brick Height Mode is 1, this is Z value for the standard deviation. Sensible Z value can range from 0.5 to 4. However, mostly Z value of 1.0, 1.68 and 1.96 are used in the industry. If you are already familiar with Renko charting, then you should have some preferences in your brick height. In such a case, just use Brick Height Mode 0.


Bars to scan: Count bars in your current timeframe where indicator is attached. Bricks will be displayed on this bars.


Time Frame used for Brick Calculation: This is a sub-timeframe to be used for brick calculation. Note that Smart Renko uses sub-timeframe to calculate bricks and the bricks are displayed on the current timeframe.


Time Frame used to update Renko Chart: You can also choose different timeframe for updating your chart. If 'Time Frame used to update Renko Chart' = M1, then the chart is updated every 60 seconds.
Version 3.6 2015.04.28
In version 3.6, user can select any pattern to lock on his chart. Of course, user can unlock and delete the locked pattern. This locking and unlocking pattern is done by pressing "Pattern" button on the chart.
Version 3.5 2015.04.16
Fixed a bug occured when sending wrong timing in email and notification. This only happened in MT4 but not in MT5.

Version 3.3 2015.04.13
Version 3.3

1. Added Text Size variable for trade instruction: if Text Size for Trade instruction = 0, then the indicator does not display any instruction. The indicator will only display the name and shape of the patterns.

2. Added push notifications for sending messages to your mobile terminal.

3. Added ability to change button text size (Button Text Size variable).
Version 3.2 2015.03.19
In this version, Button has been redesigned for simpler looking.
Version 3.1 2015.02.11
In version 3.1, huge improvement was made for candlestick pattern detection algorithm by adding intensive statistical pattern matching algorithm.
Version 3.0 2015.01.05
In version 3.0, now you can select different symbols using buttons on charts. Users now need to open fewer charts and their trading operation become quicker.
Version 2.9 2014.11.07
Fixed bug from version 2.8, when user couldn't disable sound alert.
Version 2.8 2014.08.01
In previous version, "Button may already exist" text was printed when the terminal is restarted. In Version 2.8, this bug was fixed.