Fibowave
- Indicators
- Version: 2.0
- Updated: 17 September 2026
- Activations: 20

FIBOWAVE
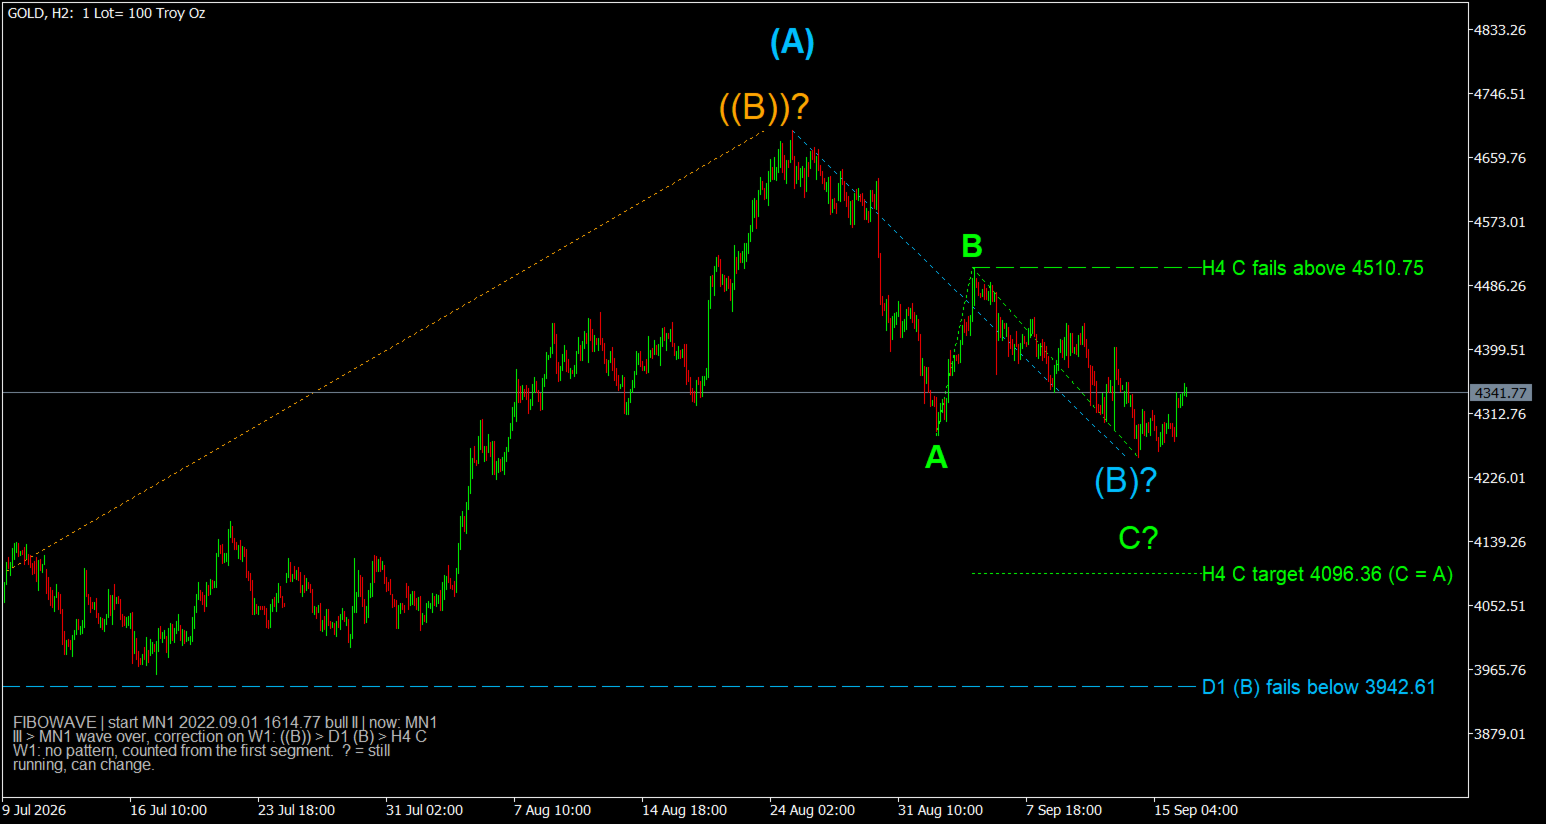
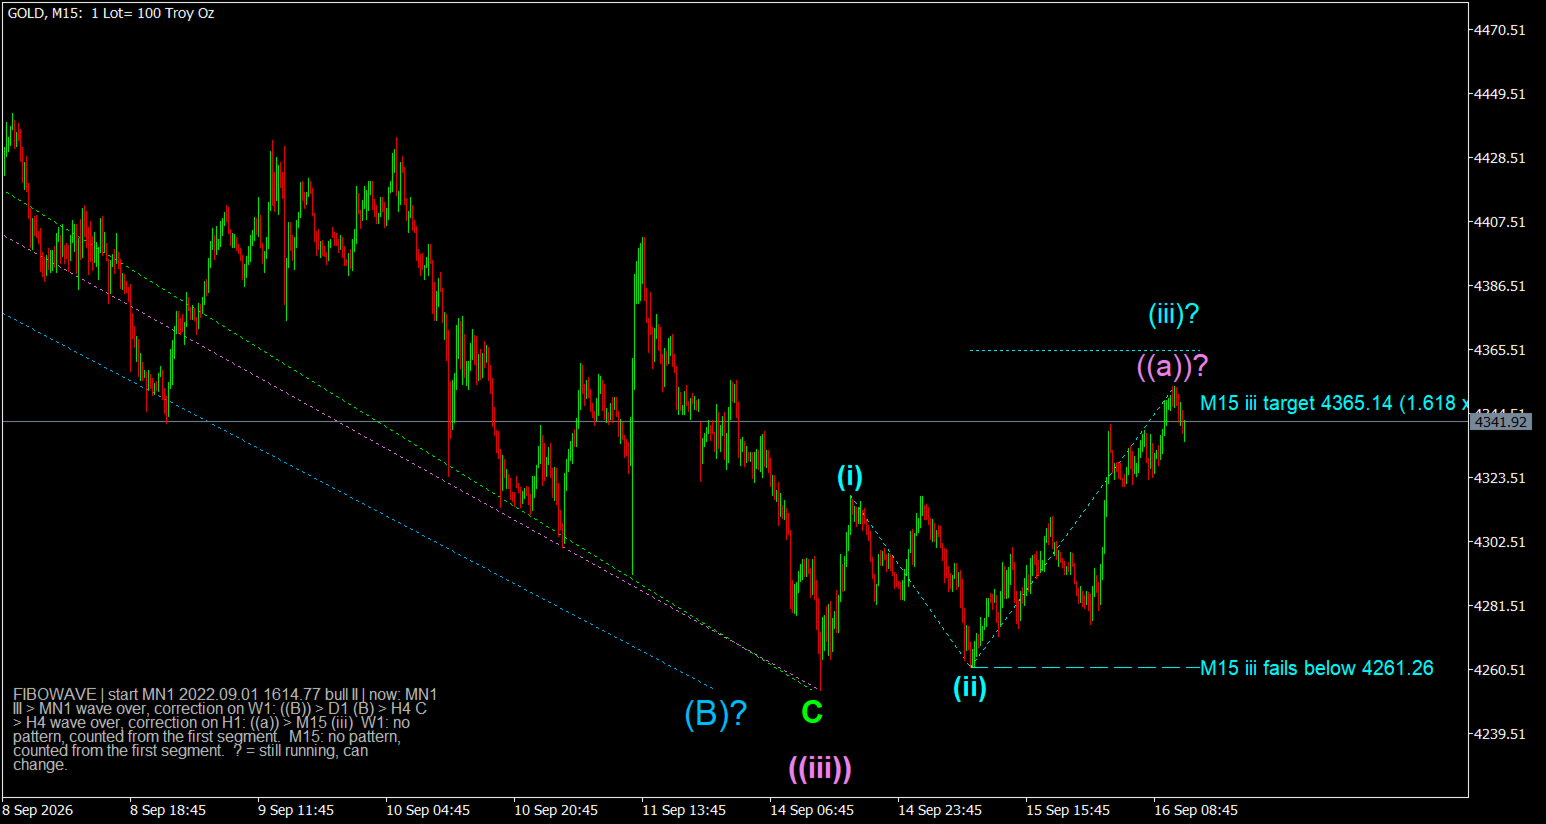
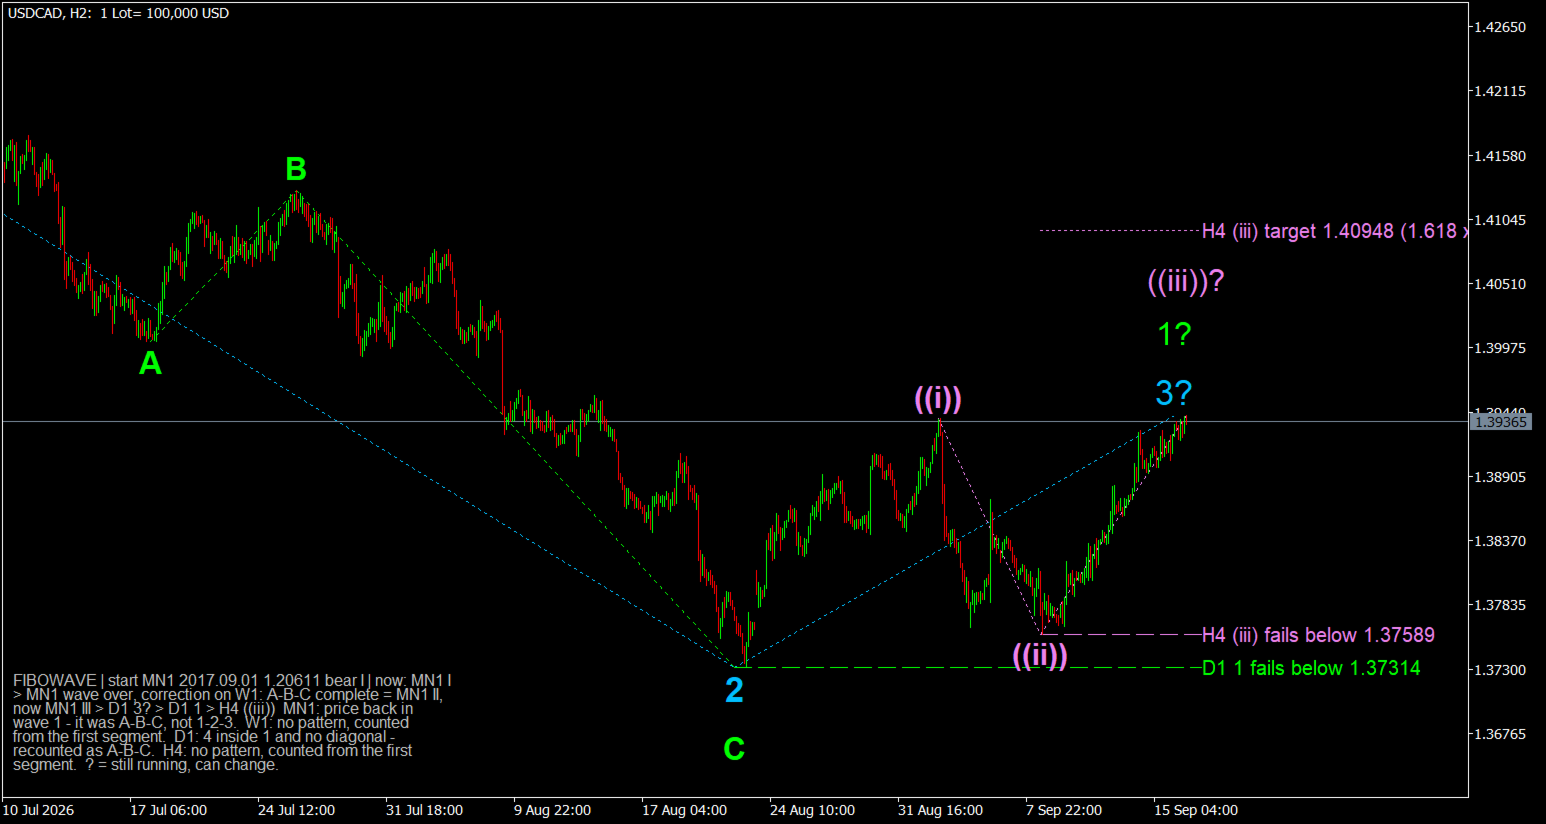
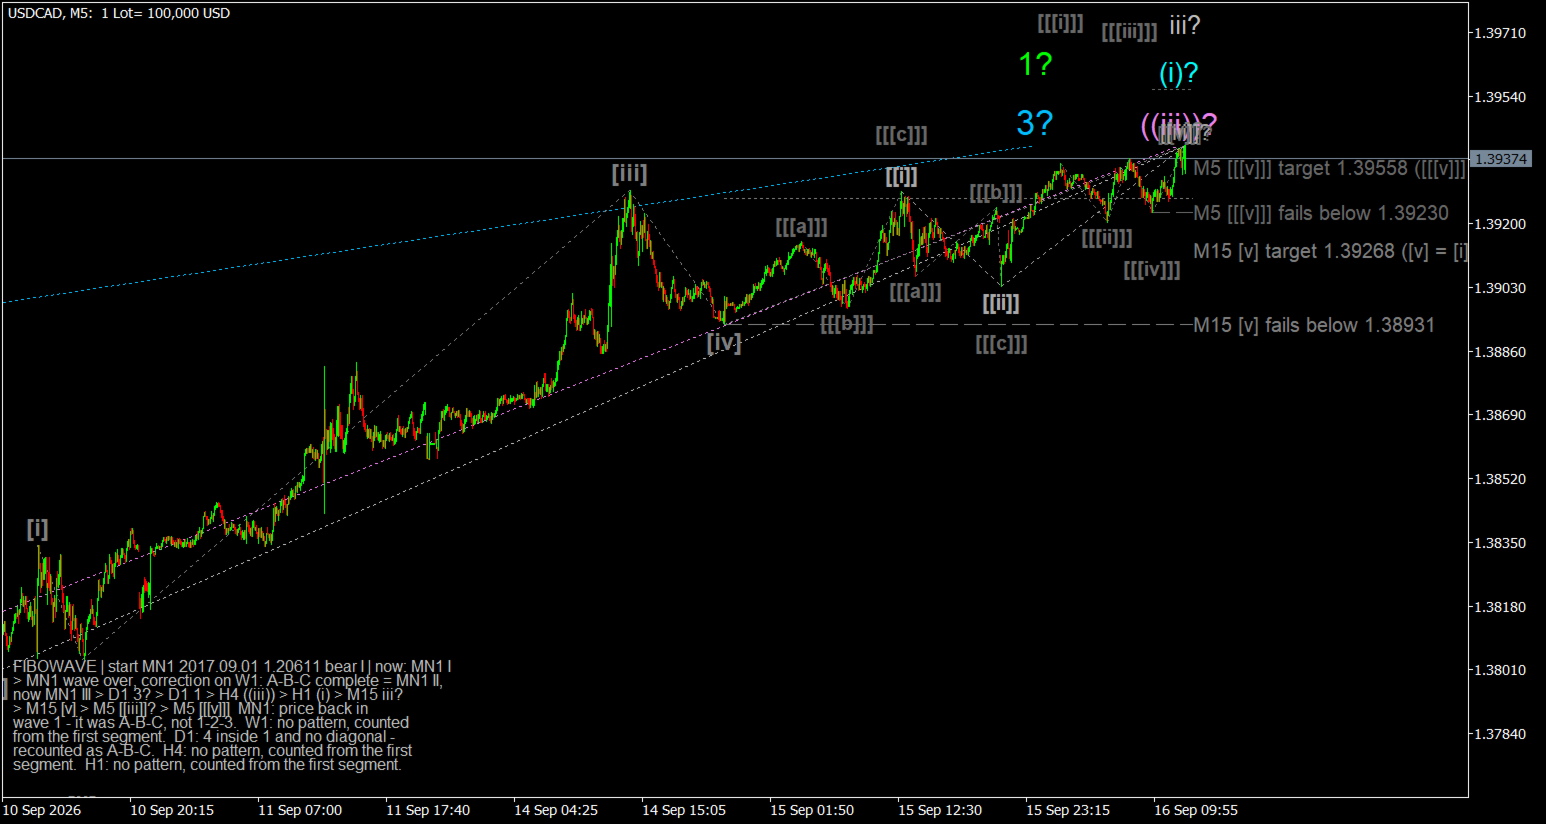
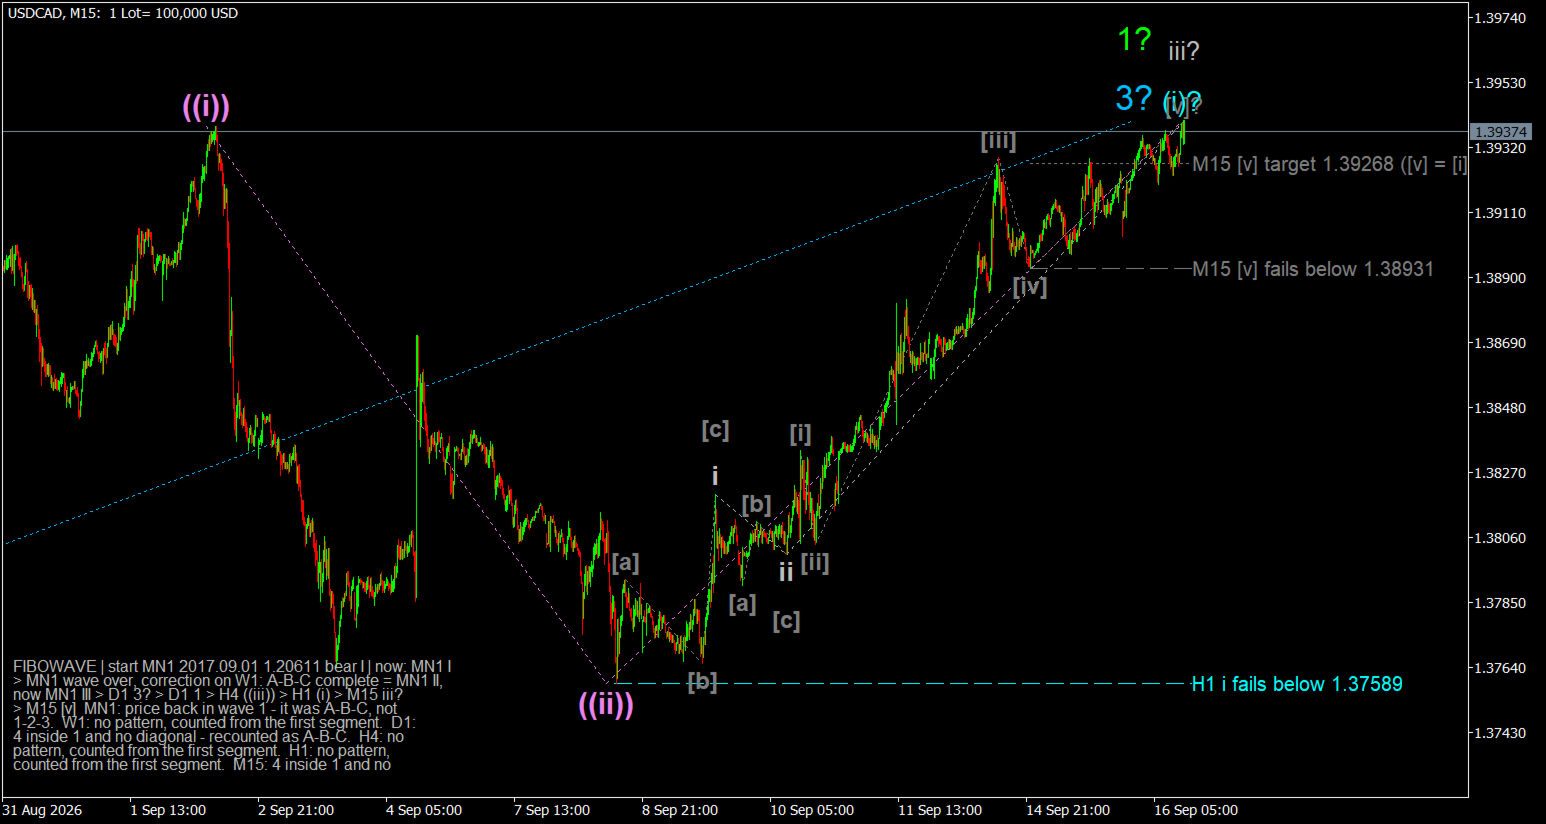
Automatic Elliott wave count on seven timeframes at once, from the monthly chart down to M5, with the Fibonacci retracement of the running correction, the Fibonacci target of waves 3, 5 and C, the price level where the count fails, and an alert when a wave 3 or 5 starts.
Counting Elliott waves by hand is slow, and two analysts rarely arrive at the same count. FIBOWAVE counts by fixed rules, the same way every time, and writes the waves, their sub-waves and their sub-sub-waves on your chart.
WHERE THE COUNT STARTS
You do not pick a starting point and you do not set anything. The indicator looks for the last place where the market showed the beginning of a new move, starting from the monthly chart and working down, and it counts from there.
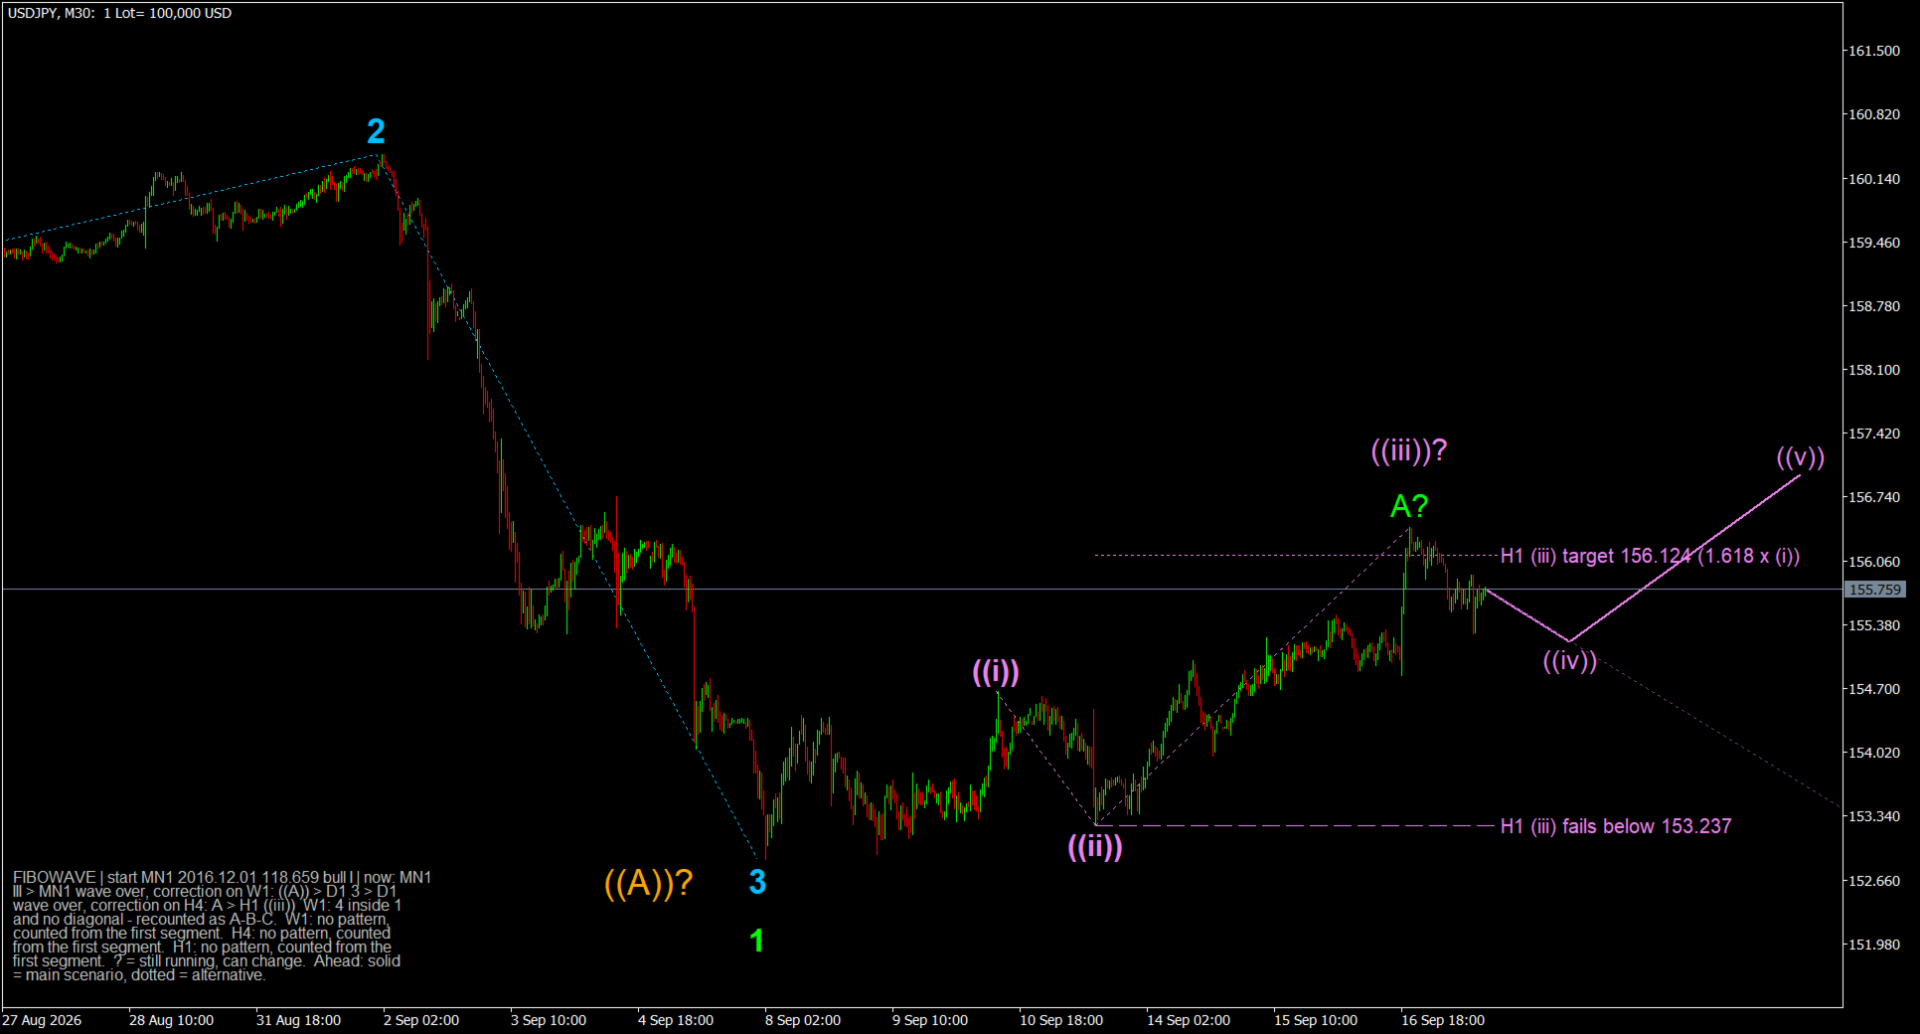
At the start a move can be the first wave of a new trend or the second wave of the old one, and nobody can tell which until price moves again. FIBOWAVE says so: the label reads "1/2?" and the status line tells you what has to happen for each case. Once price settles it, the label becomes a wave 1 or a wave 2 and the count goes on from there. A move that turns out to be a wave B is relabeled as well.
A wave that is still undecided on a high timeframe never stops the analysis. The lower timeframes keep counting the move, and the status line says which reading they assume.
FROM THE MONTHLY CHART DOWN
Every timeframe carries the count up to the last bar. Each lower timeframe counts the sub-waves of the wave that is running on the timeframe above it: 1-2-3-4-5 inside an impulse wave, A-B-C inside a correction. Inside a correction, A and C are divided into 1-5 and B into a-b-c. When the lower timeframe shows that the wave above has already ended, that wave is closed there and what follows is counted as its correction. After a completed 1-2-3-4-5 the next structure is counted as A-B-C, never as a new 1-2-3.
The degree of a label comes from its nesting, not from the timeframe: an impulse or an A-B-C found inside a running wave is that wave's sub-wave, and its own parts are one degree lower again.
THE RULES IT KEEPS
- Wave 2 never passes the start of wave 1
- Wave 3 has to pass the end of wave 1; until then, the correction is still wave 2
- Wave 5 has to pass the end of wave 3; until then, wave 4 is still running
- Wave 4 does not enter the territory of wave 1. When it does, 1-2-3 was a correction and is relabeled A-B-C, unless the structure is a valid diagonal (wave 3 shorter than wave 1, wave 4 not beyond the end of wave 2)
- Alternation: when wave 2 is a single straight move, wave 4 is a three-move zigzag, and the reverse
- Wave 3 extends while its end is passed inside the would-be wave 4
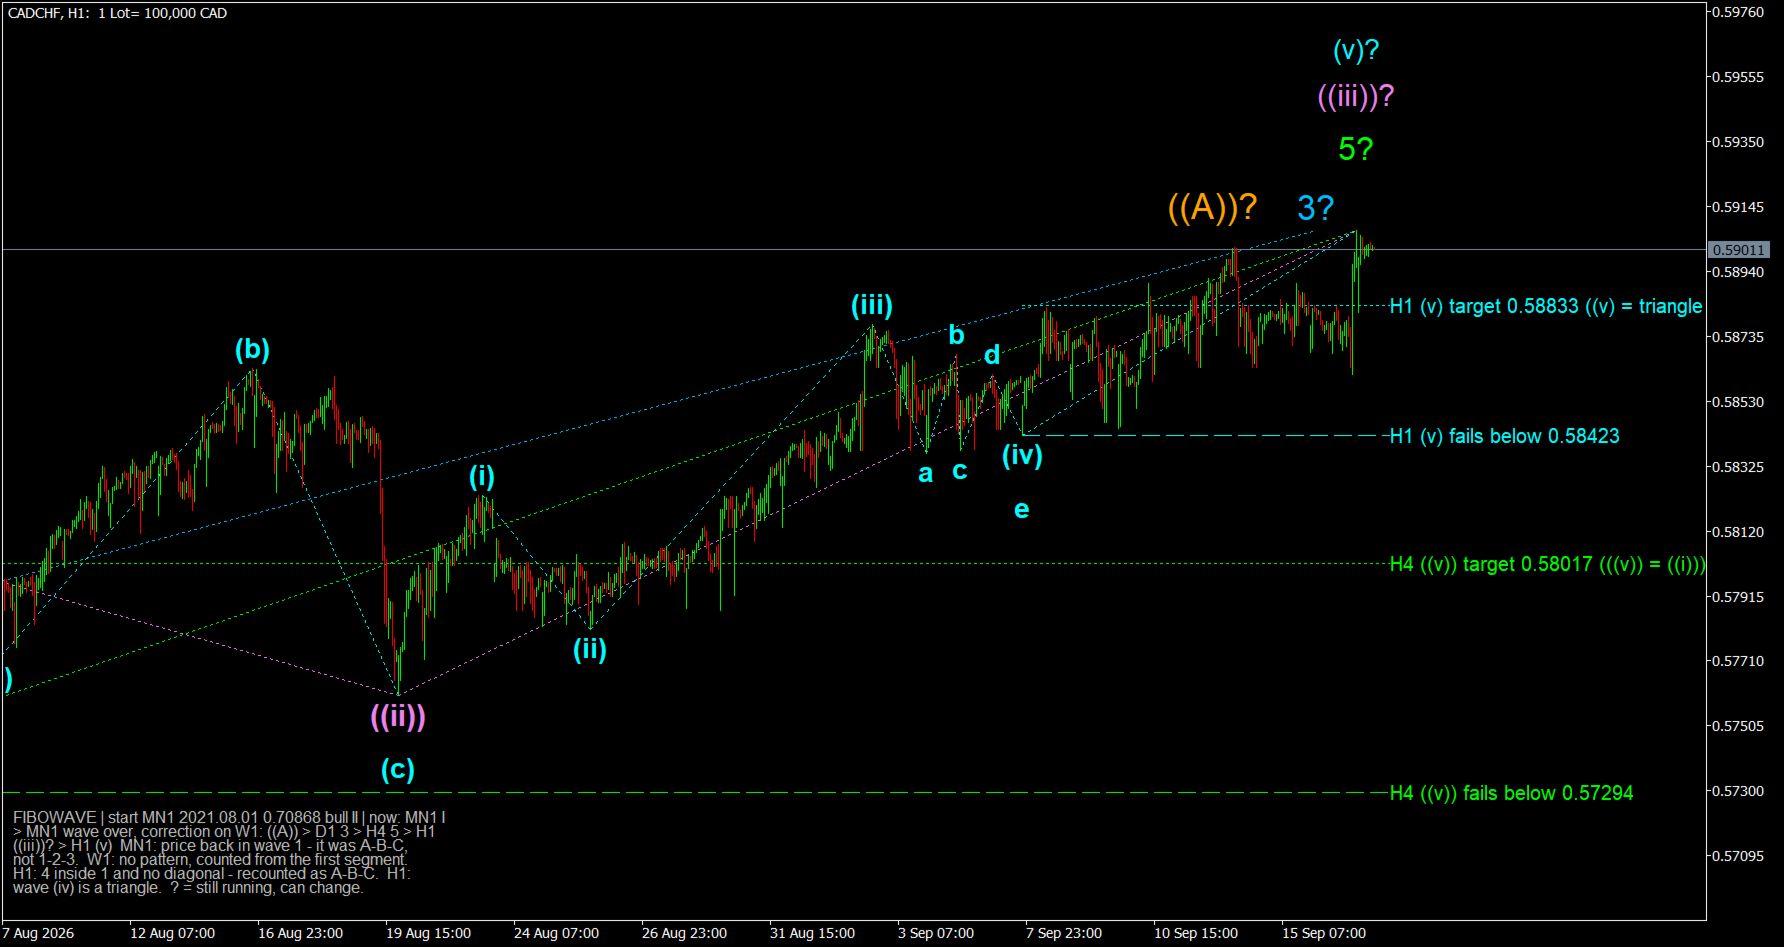
- Triangles: five contracting legs in a wave 4 or a wave B are labeled a-b-c-d-e one degree lower, and the target of the following wave is the width of the triangle. With four legs so far the chart says "may be a triangle, 4 of 5 legs"
When a rule breaks, the count is corrected and the reason is written in the status lines on the chart.
FIBONACCI LEVELS
For the lowest degrees on the chart (how many is an input, default 2):
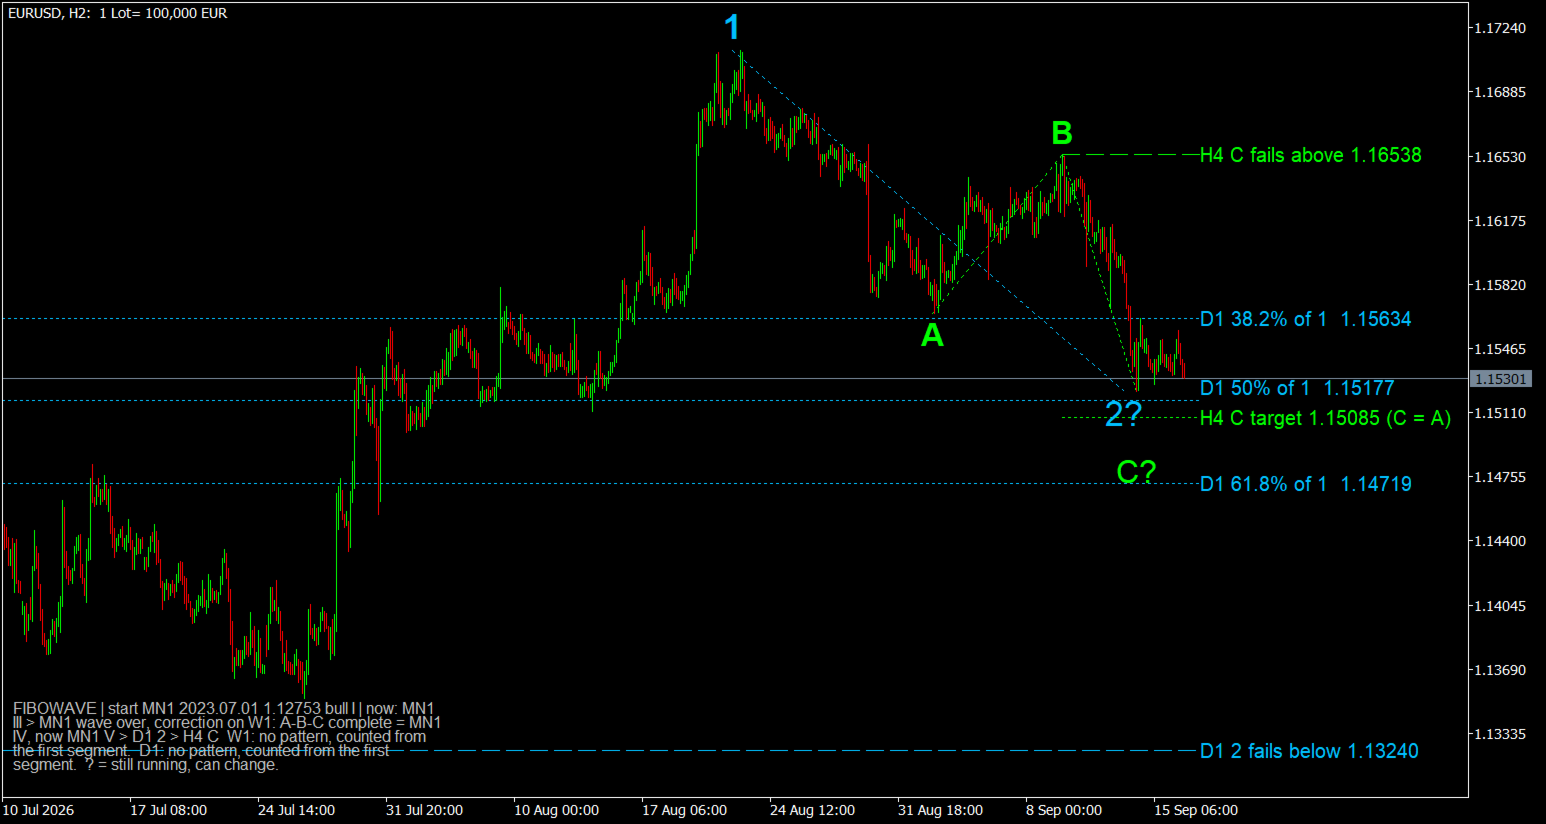
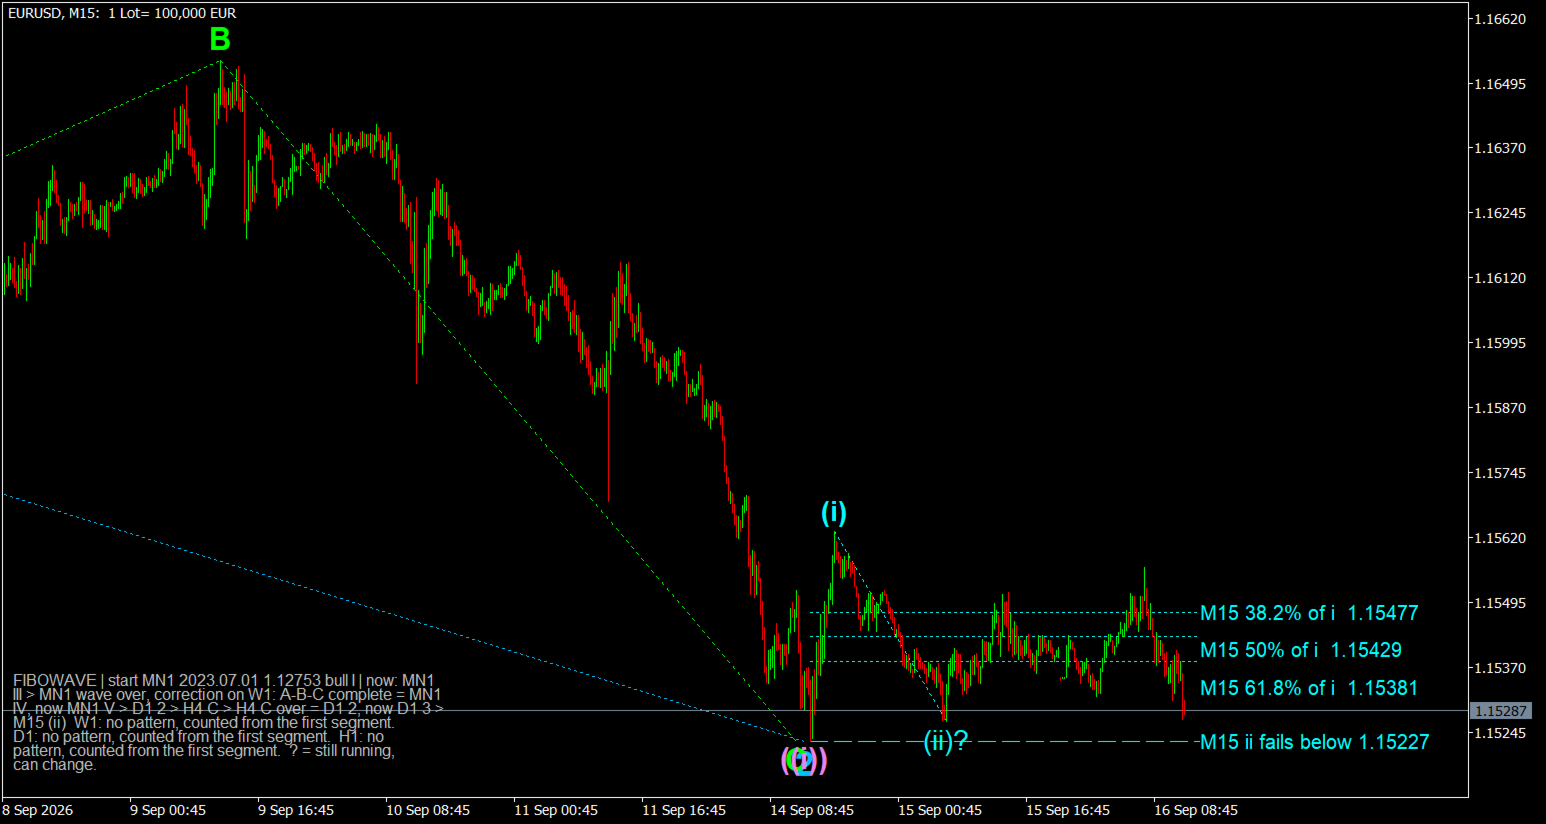
- Retracement of the running correction: 38.2%, 50% and 61.8% of wave 1 for a wave 2, of wave 3 for a wave 4
- Target of the running motive wave: wave 3 = 1.618 x wave 1 measured from the end of wave 2; wave 5 = the length of wave 1; wave C = the length of wave A
- Failure level: the price beyond which the current count is wrong. For wave 1/2 it is the start of wave 1, for wave 3 the end of wave 2, for wave 5 the end of wave 4, for wave B the start of wave A, for wave C the end of wave B. For wave 4 it is the closer of the 61.8% retracement of wave 3 and the end of wave 1, and the text says which one it is
The failure level is a dashed line, the target is a dotted line, the retracements are dotted lines with the percentage written next to them.
ALERTS
An alert, and optionally a push notification, when a wave 3 or a wave 5 starts, once per wave. Nothing fires for history when the indicator is loaded, and nothing fires for the timeframes below the chart.
WAVE DEGREES
Each degree has its own label style, colour and font size:
- I II III IV V
- ((1)) ((2)) ((3)) ((4)) ((5))
- (1) (2) (3) (4) (5)
- 1 2 3 4 5
- ((i)) ((ii)) ((iii)) ((iv)) ((v))
- (i) (ii) (iii) (iv) (v)
- i ii iii iv v
Corrections use A B C in the same styles, triangle legs a b c d e. On a monthly count the top degree is I-V; on a lower starting timeframe the top degree is lower.
WHAT YOU SEE ON THE CHART
- Wave labels at the tops and bottoms; the higher degree in a larger font. Confirmed waves in bold, the running wave with a question mark in a normal font
- Labels never overlap; they are rearranged when you zoom or scroll
- Dotted lines connecting the waves of each count
- Status lines at the bottom of the chart: where the count starts, which wave is running on each timeframe, and why a count ended, for example "now: MN1 III > W1 ((1)) > D1 (3)"
Timeframes lower than the chart are not drawn. Open the M5 chart to see all seven timeframes.
THE COUNT FOLLOWS THE MARKET
The last wave of every degree is still running. It carries a question mark, and its end moves with price until the market turns. Waves that have been closed by the rules do not move and are written in bold. The count is rebuilt on every new bar, so when the market gives a new starting point, the count starts over from it. This is how a wave count behaves on a live market, and it is shown openly rather than hidden.
INPUTS
Nothing has to be set up: put the indicator on the chart and the count is there. The inputs are for the look and for the extras.
- Connect the counted waves of each degree with lines
- Font size of the smallest degree (13)
- Show the failure level and the Fibonacci target, and for how many of the lowest degrees on the chart (2)
- Show the Fibonacci retracement of a running correction
- Alert when wave 3 or 5 starts, and also send a push notification
- Bars per timeframe: how much history is read on each timeframe (1500; more is read automatically when the wave above starts earlier)
- Four advanced settings that decide how sensitive the wave detection is. They are set to the values the rules were built on; change them only if you know why
REQUIREMENTS
- MetaTrader 5, any broker, any symbol
- The history of MN1, W1, D1, H4, H1, M15 and M5, which the terminal downloads on its own
- No additional indicators, libraries or DLLs
- Light on CPU: the count runs once per new bar of the lowest drawn timeframe, not on every tick
A NOTE ON THE DEMO (STRATEGY TESTER)
The demo runs in the visual mode of the Strategy Tester, and the count moves forward bar by bar exactly as it would on a live chart. The monthly count needs about four years of history before the start date, so start the test four to five years back. If the history is shorter, the timeframes without enough history are skipped and a note on the chart says so.
FIBOWAVE is an analytical tool; it does not open, modify or close positions. It does not predict the market and does not guarantee any result. Always combine the count with your own analysis and strict risk management.
Send a private message, questions before buying are welcome.