适用于MetaTrader 5的技术指标 - 4

该仪表盘显示所选符号的最新可用谐波形态,因此您可以节省时间并提高效率 / MT4 版本 。
免费指标: Basic Harmonic Pattern
指标列 Symbol: 显示所选符号 Trend: 看涨或看跌 Pattern: 形态类型(Gartley、蝴蝶、蝙蝠、螃蟹、鲨鱼、Cypher 或 ABCD) Entry: 入口价格 SL: 止损价 TP1: 第一止盈价 TP2: 第二次获利价格 TP3: 第三次获利价格 Current price: 当前价格 Age (in bars): 最后绘制的模式的年龄
主要输入 Symbols : 从 "28 种主要货币对 "或 "选定符号 "中选择。 Selected Symbols : 希望监控的符号,用逗号分隔("EURUSD,GBPUSD,XAUUSD")。如果您的经纪商为货币对设置了后缀或前缀,您必须在以下两个参数中添加(货币对前缀或货币对后缀)。 Max Iteration: 调整模式的最大迭代次数(如果该值越小,则模式越少,性能越快;如果该值越大,则模式越多,性能越慢)

该仪表盘可根据您对所选符号的交易策略,以剥头皮和长期模式在图表上发现并显示供需区。此外,仪表盘的扫描模式可帮助您一目了然地检查所有需要的符号,不错过任何合适的仓位/ MT4 版本
免费指标: Basic Supply Demand
功能 允许您查看多个货币对的交易机会,为您提供所有货币对的清晰简明视图,并根据其与供需区的接近程度进行排序 可定制设置,从颜色到检测参数,满足您的特定需求
主要输入 Indicator mode : 选择指标模式或具有新功能的面板模式 Symbols : 从 "28 种主要货币对 "或 "选定符号 "中进行选择 Selected Symbols : 您希望监控的符号,用逗号分隔("EURUSD,GBPUSD,XAUUSD")。如果您的经纪商对货币对有后缀或前缀,您必须在以下两个参数中添加(货币对前缀或货币对后缀) Trading Style : 选择剥头皮或长期模式 Allowed Deviation : 该参数允许修改需求或供应区域的精确度(数值越小,精确度越高) Zone thickness : 通过该参数可以修改需求和供应区域的厚度。

TW Trend Scalper Indicator:
TW Scalper Shoot 为您提供独特的交易体验,利用最新的交易策略和人工智能技术。该产品满足剥头皮交易者的多样化需求,提供两种不同类别的信号:
今天就测试这个卓越的产品,开始您成为趋势剥头皮交易者的独特体验。
此外,获取价值 37 美元的赠品。
信号类别:
1. 长期和安全信号:这些信号使用价格行为策略(聪明资金规则)、斐波那契水平、支撑和阻力水平以及移动平均线进行识别。该类别中的信号用红色和蓝色箭头及特定目标显示,非常适合寻求长期和可靠交易的交易者。
2. 剥头皮信号(适合专业剥头皮交易者):除了上述策略外,这些信号还利用独特的 Trade Wizards 指标公式和人工智能降噪方法。剥头皮信号以白色箭头添加到第一类信号中,适合外汇剥头皮交易者。
剥头皮指标的独特功能:
1. 信号不变色:信号、SL 和 TP 完全不变且具有高准确性。
2. 精确检测变化趋势:使用两步过滤器高精度识别变化趋势。
3. 视觉和音频警报:警报以闪烁形式显示在图表上,并在图表旁的窗口中显示入场、TP 和 SL 的价格数字
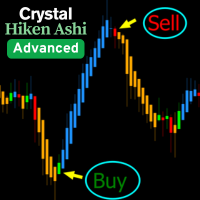
Crystal Heikin Ashi – 高级视觉 Heikin Ashi,支持智能成交量分析
Crystal Heikin Ashi 是一款专业级的 Heikin Ashi 指标,提供丰富的自定义选项、主题控制、趋势/动量逐笔着色,并可与成交量分析无缝结合,实现精准交易决策。 主要功能:
纯正 Heikin Ashi 蜡烛图(非叠加)
完全可定制蜡烛样式:标准多空、趋势强弱、动量实体大小
深色/浅色图表主题 — 支持自动蜡烛淡化或隐藏原始蜡烛
与成交量指标完美配合,用于确认入场信号
针对大型数据集的高性能优化模式
内置可视化清晰度,易于识别强趋势与反转
适用于手动交易者、价格行为剥头皮者及算法信号检测者 推荐使用:结合成交量实现精确交易
配合成交量扩散分析(如 Crystal Volume Pro、Delta Volume Tools)可:
确认强劲多/空趋势
捕捉带成交量分歧的早期反转
过滤低成交量假突破 ️ 参数概览:
蜡烛样式:标准、趋势或动量
图表主题:浅色或深色
显示/隐藏原
FREE

The Market Sessions indicator is a popular tool among forex and stock traders for visually representing global trading sessions on a price chart. It highlights the time periods for major trading sessions — such as the Asian (Tokyo) , European (London) , and American (New York) sessions — directly on the chart. This helps traders identify when markets open and close, allowing for better decision-making based on session-specific trading behavior. - Asian Session (Default: 00:00-09:00) - London Se
FREE

交易员动态指数(TDI) - 概述 交易员动态指数(TDI)是基于RSI振荡器的多功能指标。
它帮助交易者识别市场状况和潜在的反转信号。
TDI 将多个指标结合为一个,提供市场动态的全面视图。 组成部分: 绿色线:RSI 价格线 红色线:交易信号线 蓝色填充:波动带 黄色线:市场基准线 视觉信号: 趋势方向: 短期趋势: 绿线在红线上方:价格上涨。 红线在绿线上方:价格下跌。 总体趋势: 黄色线在32和68之间波动。关注该线的反弹情况,以识别市场反转。 当价格在黄色线上方时做多,在黄色线下方时做空。 市场强度和波动性: 短期分析: 绿线陡峭上升:市场强势。 绿线水平或平缓:市场疲弱,横盘整理。 总体分析: 蓝色填充区域扩大:市场趋势强劲。 蓝色填充区域收缩:市场疲软,波动较小。 蓝色线极度收缩:市场可能因经济公告或其他条件出现剧烈波动。 在EA(智能交易系统)中使用TDI:
要在EA中使用TDI指标,可以使用 iCustom 函数调用它,并获取其缓冲值以生成交易信号。
以下是一个简要示例: // 创建指标句柄 int handle_tdi = iCustom ( Symbol ()

移动平均线 (MA) 指标的多货币和多时间范围修改。 在仪表板上,您可以看到指标的当前状态 - 快速 MA 和慢速 MA 的突破和触及(按价格),以及 MA 线彼此之间的交叉点(移动平均线交叉)。 在参数中,您可以指定任何所需的货币和时间范围。 此外,该指标还可以发送有关价格触及线及其交叉的通知。 通过单击带有句点的单元格,将打开该符号和句点。 这是 MTF 扫描仪。您可以在图表上运行多个仪表板。
该指标在当前图表上显示快速 MA 线和慢速 MA 线。 您可以为图表选择 MA 时间范围并从其他时间范围观察 MA (MTF MA)。 两组MA的热键默认为“1”和“2”。
默认情况下,从图表中隐藏仪表板的键是“D”。
参数 Fast MA — 快速MA Averaging period — 平均周期。 Shift — 转移。 Averaging method — 平均法。 Applied price — 适用价格。
Slow MA — 慢MA Averaging period — 平均周期。 Shift — 转移。 Averaging method — 平均法。 Applied
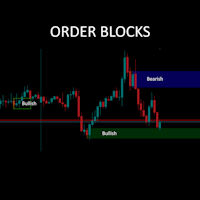
Straight forward keep is simple style Order Block finder. Now with optional higher timeframe overlay, watermark and candle timer all in one! No fancy algorithms but tends to be quite accurate for some symbols to predict bounce, return-to and break-through channels. It is a retrospective indicator (as they all are) and there to help you with better guesses as to where a movement is going towards. For me it works well in 5 and 15 minute periods. Use with out trade manager/visualiser/bracketing uti
FREE

Phi Cubic Fractals Pack1A with FuTuRe PACK 1A é uma melhoria sobre o Pack 1 que inclui a possibilidade de selecionar as linhas LINE 4/8/17/34/72/144/305/610 individualmente. Este produto contém os indicadores do PACK 1A (Lines + LineSAR + Channels + BTL + Ladder) + MODO FUTURO Phi Lines - medias moveis especiais, semelhantes às MIMAs do Phicube, capazes de indicar com muita clareza tanto a tendencia como a consolidação; Phi LineSAR - apaga ou destaca as Phi Lines para mostrar apenas as linha
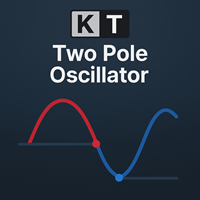
KT Two Pole Oscillator 是一款帮助交易者通过高级平滑算法识别精准市场信号的指标。它结合了基于偏差的计算和独特的双极滤波方法,生成清晰的视觉信号,让交易者更容易理解并及时采取行动。 得益于其自适应特性,双极滤波器在不同的市场环境中都能保持稳定,无论是趋势行情还是震荡行情,都是一个实用的工具。
功能亮点
双极滤波: 平滑震荡器信号,去除市场噪音,清晰显示市场动量和趋势方向。 超买/超卖识别: 当市场达到极端水平时能清晰标识,提示可能的反转或回调。 范围从 1 到 -1: 明确定义的震荡区间,有助于减少尤其在接近零线时出现的虚假信号。 高度可定制: 可以调整震荡器周期、颜色风格及其他参数,灵活适配个人交易风格。 全面提醒功能: 通过 MetaTrader 警报和推送通知实时提醒您信号,即使不在电脑前也不错过交易机会。
如何解读信号 当震荡器线从下向上穿越信号线时,会出现蓝色圆点,表示买入信号;当震荡器线从上向下穿越信号线时,会出现红色圆点,表示卖出信号。这些视觉标记便于快速识别可操作的交易机会。
专业建议
靠近 +1 和 -1 极端值处的信号通常更为可靠,因为它们
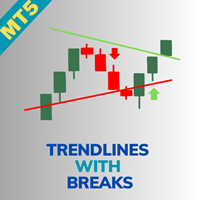
Indicator Name: Trendlines with Breaks [LuxAlgo] Overview: The Trendlines with Breaks [LuxAlgo] indicator provides traders with pivot point-based trendlines that highlight real-time breakouts. This tool is highly customizable, allowing users to adjust the steepness of trendlines, choose different slope calculation methods, and receive alerts on trendline breakouts. Key Features: Pivot Point-Based Trendlines: The indicator automatically generates trendlines based on pivot points, providing a clea
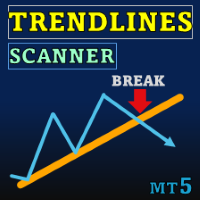
Special offer : ALL TOOLS , just $35 each! New tools will be $30 for the first week or the first 3 purchases ! Trading Tools Channel on MQL5 : Join my MQL5 channel to update the latest news from me Trendlines with Breaks Scanner 是一款先进的交易工具,旨在帮助交易者实时识别关键趋势和突破点。通过基于枢轴点的自动生成趋势线,该指标让交易者能够以精准和自信把握交易机会。 查看 MT4 版本: Trendlines with Breaks Scanner MT4 查看更多产品: All Products 主要功能 1. 实时突破检测 突破警报: 当价格突破趋势线时立即通知您。集成的警报功能确保您不会错过任何关键的市场动作。 无重绘突破: 突破在发生时检测到,提供准确可靠的信号,不会重绘。 2. 自动化和可自定义的趋势线 动态趋势线:

A Heatmap with a Volume Profile is like a thermal imager or x-ray machine. It will help you to estimate the relative distribution of volume during the price movement and to understand the relationship between volume and price. Indicator Volume Profile "Volumos Maxima" is a powerful tool for analyzing this relationship. After simple experimentation with heatmap, you can find that each trading instrument has its own “ characteristic ” way of distributing volume. And this will help you to make a b

Gann 9+ 指标简介 江恩矩阵图( Gann Squares ),又称江恩四方图,或甘氏矩阵,它是江恩理论中最简易明确的技术分析,也是江恩一直致力使用的推算工具,堪称是江恩一生的精华和精髓。Gann 9+指标是使用矩阵图找出股票或期货的未来高点或低点。
指标输入 1 基数和步数可以默认设置为1; 2 倍数为-1时自动获得倍数,当然也可以自行填写;(价格除以倍数就是起算值) 3 多与空表示从起算点往上或往下算目标价; 4 表示要不要显示基准线; 5 价格除以倍数是起算值,是否对起算值进行四舍五入; 6 表示要展示多少个目标价。
交易方法建议: 1、画出来的线会有明显的支撑和压力,甚至是反转;突破后加仓,到达后减仓; 2、配合其它头皮和振荡指标,成功率大大增加; 3、尽量当主/辅助指标使用,但不能只看一个指标。
特别说明:此指标针对对江恩理论有一定了解的人使用。

This indicator shows Fractal Breakout Trendlines and Support and Resistance
The Fractal Ascending Trendline and Fractal Descending Trendline are drawn from the last valid fractals. Breakouts can be taken above or below these trendlines. Horizontal lines are drawn from the Last upper and Last lower fractal to show support and resistance levels. Horizontal Upper and Lower Intersection lines are drawn where a fractal trendline has been last intersected, to show where to place a buy or sell order
FREE
Haven Trend Tracker - 是一款趋势指标,旨在简化市场方向分析。它绘制两条彩色线条,依次显示图表上的当前趋势,并用箭头标记可能的趋势反转点。 其他产品 -> 这里 . 指标的PRO版本 -> 这里 该指标分析指定数量的K线价格动态,识别形成局部高点和低点的关键水平。这些水平用于构建反映价格运动方向的线条。当市场动态发生变化时,会出现箭头信号提示可能的趋势反转,帮助交易者识别潜在的进场或出场点。 参数如振幅可以根据特定交易工具和策略进行调整。这种方法确保了灵活性和适应性,在波动的市场环境中特别重要。 该指标的设计注重简洁和清晰,使其既适用于有经验的交易者,也适用于刚开始学习技术分析方法的交易者。其可视化呈现方式帮助交易者快速评估当前市场状况,无需冗余信息,从而促进及时且明智的交易决策。 此外, Haven Trend Tracker 支持通知系统,可让交易者直接在交易终端或移动设备上接收趋势变化信号。这有助于确保即使交易者不在电脑前,也不会错过重要的进场或出场时机。
如何设置 MetaQuotes ID: 这里
FREE

The indicator automatically identifies the 1-2-3 pattern on the chart. The indicator is able to monitor the formation of pattern in real time. It informs the trader when the pattern is completely formed (when the price breaks the line in point 2) and displays the completed patterns in history. The patterns are never redrawn. The indicator can identify patterns on any instruments (currency pairs, stock market, gold, etc.) without the need to adjust to each instrument. Simple and clear visualizati

Haven Stop Loss Hunter 指标
用于分析关键水平的精确工具。这款指标专为那些渴望更深入理解价格动态,并显著改进其交易决策的交易者量身定制。
其他产品 -> 这里查看更多 主要功能特点: 助力您快速捕捉重要的价格 extremes ,从而把握市场脉搏。
潜在扫盘水平识别 (sweep) 功能
精准识别价格试图突破关键水平但最终未能成功的关键时刻。这预示着市场可能出现重要的反转信号或现有趋势的持续。 关键价格点的直观可视化显示
显著简化了复杂的市场结构分析过程,并直接根据清晰可见的数据辅助您做出更为明智的交易决策。 此指标是您理想的选择,尤其适用于精准捕捉价格测试关键水平但未能有效突破的交易情境。对于寻求高效率和高精度的交易者而言,这是一个至关重要的市场信号工具。 高度灵活的 настройка 选项 允许您根据独特的个人交易策略精细调整此工具,并将其应用于任何您选定的金融交易品种,实现交易策略的高度个性化和工具的广泛适用性。
FREE

Shows whether market is trending or not, to what extent, which direction, and if the trend is increasing. The indicator is very useful for trend following strategies, where it can filter out flat/choppy markets. The indicator can also alert when the market transitions from being flat to trending, which can serve as a great trade entry point. The alert is controllable directly from the chart, via a tick box. Also, the product includes bonus indicators of the current spread and ask/bid prices in l

MAFIA Spikes Mafia is an indicator that is made to detect spikes before they occur , a signal will be given few minutes before a spike. An outstanding Boom & Crash strategy is coded into this indicator system to perfectly give amazing signals for spikes. When using this indicator system you gonna feel like you are a MAFIA of spikes, king of spikes. This indicator is made for trading Boom and Crash indices only, on a 1 minute timeframe only. Mafia Spikes can also sand signals to your smartphon

MT4 Version Wave Trend MT5 Wave Trend is an oscillator, which helps identifing in a extremely accurate manner market reversals. The Oscillator being obove the overbought level and a cross down of the fast into the slow MA usually indicates a good SELL signal. If the oscillators is below the oversold level and the fast MA crosses over the slower MA usually highlights a good BUY signal. The Wave Trend indicator can be also used when divergences appear against the price, indicating the current move

** All Symbols x All Timeframes scan just by pressing scanner button ** ***Contact me to send you instruction and add you in "RSI scanner group" for sharing or seeing experiences with other users. Introduction RSI divergence is a main technique used to determine trend reversing when it’s time to sell or buy because prices are likely to drop or pick in the charts. The RSI Divergence indicator can help you locate the top and bottom of the market. This indicator finds Regular divergence for pullba

This indicator obeys the popular maxim that: "THE TREND IS YOUR FRIEND" It paints a GREEN line for BUY and also paints a RED line for SELL. (you can change the colors). It gives alarms and alerts of all kinds. IT DOES NOT REPAINT and can be used for all currency pairs and timeframes. Yes, as easy and simple as that. Even a newbie can use it to make great and reliable trades. NB: For best results, get my other premium indicators for more powerful and reliable signals. Get them here: https://www.m
FREE

Smart Liquidity Levels is a valuable tool for identifying optimal liquidity levels, enabling retail traders like us to strategically set our stop-loss orders. T he essential tool for traders seeking to maximize their trading success. The liquidity level is a critical component of inner circle trading (ICT). It assists us in determining when and how we should enter the market. Watch the video for detailed instructions. Here's why understanding liquidity levels is crucial in trading and how our

您是否厌倦了在图表上手动绘制斐波那契水平?您是否正在寻找一种方便有效的方法来确定交易中的关键支撑位和阻力位?别再犹豫了! 隆重推出 DrawFib Pro,这是一款可自动执行 ibonacci 水平的 终极 MetaTrader 5 指标 在图表上绘制,并在突破这些水平时及时发出警报。借助 DrawFib Pro,您可以增强交易策略、节省时间并做出更明智的决策。 我的基于斐波那契的指标: Advanced Gartley Pattern MT5 || Price Wave Pattern MT5 主要特征:
自动 斐波那契绘图 . 可定制的 参数 . 准确 可靠. 实时 警报. 用户 友好的 界面 . 对于任何寻求高效、可靠且用户友好的方式在图表上自动绘制斐波那契的交易者来说,DrawFib Pro 是必备工具。 DrawFib Pro 能够提供实时警报并支持各种时间范围,使交易者能够做出更准确、更及时的决策。节省宝贵的时间和精力,同时提高您的交易绩效。立即使用 DrawFib Pro 释放自动斐波那契分析的力量!
FREE

当涉及到金融市场时,"SuperTrend"这一备受欢迎的指标是一款技术分析工具,有助于识别趋势的方向以及市场可能的入场或离场点。该指标基于平均真实波幅(ATR),它根据价格范围来衡量市场的波动性。在其他平台上,它是免费提供的,这里也不例外! 该指标通常以三种方式使用: 识别当前趋势:当价格位于该线的上方时,被视为上升趋势,当价格位于下方时,被视为下降趋势。 用作止损水平。 作为动态支撑/阻力:在上升趋势中,该线位于价格下方,充当动态支撑水平。在下降趋势中,该线位于价格上方,充当动态阻力水平。 此指标的独特之处在于,它不仅可以帮助交易者确定趋势,还可以提供有效的风险管理策略。它是一个多功能工具,适用于各种市场和交易风格,从而为交易者提供了更大的灵活性和可操作性。无论是趋势追踪还是反转交易,"SuperTrend"都为交易者提供了关键的视觉指引,使他们能够更好地做出决策并取得成功。
FREE

This indicator combines double bottom and double top reversal chart patterns together with detection of divergences between the price chart and the MACD oscillator.
Features Easily detect strong reversal signals Allows to use double top/bottom and MACD divergence signals combined or independently Get email and/or push notification alerts when a signal is detected Custom colors can be used The indicator is not repainting Can easily be used in an EA (see below)
Inputs ENABLE Double Top - Bottom:
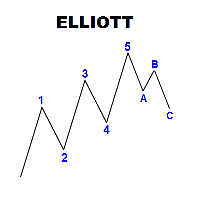
Panel with a set of labels for marking the Elliott wave structure. The panel is called up by the Q key, if you press twice, you can move the panel according to the schedule. The panel consists of seven rows, three colored buttons, each of which creates 5 or 3 labels of wave marking. Correction, consist of 3 tags, or five with a shift, you can break the chain of tags when installed by pressing the Esc key The optimal font for labels is Ewapro, write me a private message and I will give it to you

This indicator builds upon the previously posted Nadaraya-Watson Estimator. Here we have created an envelope indicator based on kernel smoothing with integrated alerts from crosses between the price and envelope extremities. Unlike the Nadaraya-Watson Estimator, this indicator follows a contrarian methodology. Please note that the indicator is subject to repainting. The triangle labels are designed so that the indicator remains useful in real-time applications.
Settings
Window Size: Determin
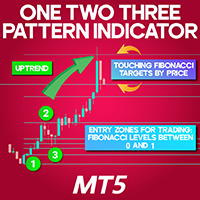
1-2-3 Pattern Indicator for MetaTrader 5
The 1-2-3 Pattern Indicator for MetaTrader 5 is a strategic analytical tool designed to pinpoint potential reversal zones in the financial markets. This indicator automatically identifies three significant swing points, forming a ZigZag structure that outlines the price path and calculates Fibonacci levels based on those decisive pivots. «Indicator Installation & User Guide» MT5 Indicator Installation | One Two Three 123 Pattern Indicator MT4 | ALL
FREE

The Relative Strenght Index presented to the world in 1978 by J. Welles Wilder Jr. in his book " New Concepts in Technical Trading Systems " is widely used around the world in several ways, not only with the traditional approach of Overbought and Oversold states, which in several cases and depending on the assets and timeframes it just simply doesn't work anymore . BUT, this indicator has its value when used, for instance, looking for divergences between its measuring system and the Prices appea

该指标在图表上绘制了供需区域。结合您自己的规则和技术,该指标将允许您创建(或增强)您自己的强大系统。还请查看提供更多功能的 付费版本 。我的建议是寻找在至少 25 个条形图后发生第一次区域测试的交易机会。 特征 区域有 3 种颜色(可通过输入调整)。深色表示未测试区域,中色表示已测试区域 ,浅色表示损坏区域 。 每个区域都写有区域外边界的价格以及区域测试的数量。 输入参数 最大后退柱线以搜索第一个极值 - 默认值为 3000。将搜索 xx 前的第一个极值。值越高,需要的系统资源就越多 。对于较慢的计算机,500-1000 的值可能更合适。 区域测试之间的最小蜡烛数量 未经测试的需求颜色 测试需求颜色 破碎需求颜色 未经测试的供应颜色 已测试的供给颜色 破损供给颜色 文本颜色 测试次数标签的字体大小 价格标签尺寸 [1-3]
FREE

枢轴点斐波那契 RSJ 是一个指标,它使用斐波那契汇率追踪当天的支撑线和阻力线。
这个壮观的指标使用斐波那契汇率通过枢轴点创建多达 7 个支撑位和阻力位。 价格如何尊重该支撑和阻力的每个水平真是太棒了,在那里可以感知操作的可能进入/退出点。
特征 多达 7 个支撑位和 7 个阻力位 单独设置级别的颜色
输入 枢轴类型 Pivot Fibo RSJ1 = Fibo ratio 1 计算 Pivot Fibo RSJ2 = Fibo ratio 2 计算 Pivot Fibo RSJ3 = Fibo ratio 3 计算 Pivot Fibo Classic = 经典枢轴计算 最低枢轴级别 旋转 3 个级别 旋转 4 个级别 旋转 5 个级别 枢轴 6 个级别 旋转 7 个级别
如果您仍有疑问,请通过直接消息与我联系: https://www.mql5.com/zh/users/robsjunqueira/
FREE

FREE
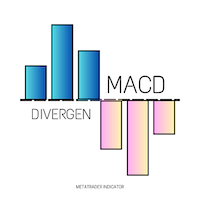
Overview The MACD Divergence Indicator is a powerful tool designed to detect potential trend reversals by analyzing divergences between price action and the MACD (Moving Average Convergence Divergence) indicator. It automatically identifies and highlights bullish and bearish divergence signals directly on the chart, making it easier for traders to spot high-probability trading opportunities. Key Features Customizable Settings: Includes adjustable parameters to suit various trading styles and ti

The Metatrader 5 has a hidden jewel called Chart Object, mostly unknown to the common users and hidden in a sub-menu within the platform. Called Mini Chart, this object is a miniature instance of a big/normal chart that could be added/attached to any normal chart, this way the Mini Chart will be bound to the main Chart in a very minimalist way saving a precious amount of real state on your screen. If you don't know the Mini Chart, give it a try - see the video and screenshots below. This is a gr
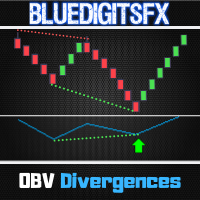
MT4 Version Available Here: https://www.mql5.com/en/market/product/48040
Telegram Channel & Group : https://t.me/bluedigitsfx
V.I.P Group Access: Send Payment Proof to our Inbox
Recommended Broker: https://eb4.app/BDFXOsprey
* Non-Repainting Indicator To Trade Divergences for any Newbie or Expert Trader ! BlueDigitsFx's OBV Divergence draws divergence lines on the chart and on the On Balance Volume (OBV) Indicator. Performs Amazingly at significant price areas such as support and

The ATR indicator is a helpful tool for measuring the range of bars. It quickly and easily helps evaluate the ATR's current spread (range), which is especially useful for VSA traders. The indicator for classifying the range of bars (candles) uses the moving average and its multiples. Accordingly, the area where the volume is located (relative to the moving average) is labeled as ultra-low, low, average, high, very high, or ultra-high. Our ATR indicator is rendered as a histogram. This indic

"Haven Candle Timer Countdown" 指标是一个简单方便的工具,帮助交易者控制不同时间框架的时间范围。它显示当前的服务器时间,并同时在三个选定的时间框架上显示到蜡烛结束的倒计时。这个工具对于那些需要精确知道当前蜡烛在多个时间框架上剩余时间的交易者尤为有用,从而能够及时做出决策。使用此指标可以显著加快分析过程,并避免因缺乏时间信息而导致的错误。 其他产品 -> 在这里 主要功能: 灵活的时间和颜色显示设置 支持从1分钟到1个月的时间框架 方便的图表定位 快速访问当前和即将到来的周期信息 适用于那些在做出交易决策时需要准确控制时间间隔的交易者。此指标将帮助您有效规划您的操作,减少与蜡烛结束时间的不确定性相关的风险。它非常适合那些使用短期时间框架进行分析的交易者,以及那些在较长期时间框架下需要精确计算蜡烛完成时间的交易者。
FREE
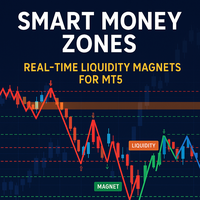
Developed according to the principles of smart money management strategies, the SM Zones indicator is a very convenient tool for traders on the MetaTrader 5 (MT5) platform. It graphically displays on the chart all the significant zones used in the SM strategy: market structure, price levels of increased liquidity, "price magnet" zones - imbalances, order blocks, fvg, breaker blocks and mitigation blocks - towards which the instrument's price moves. The zones influencing the bull market are high
FREE

VWAP, or volume-weighted average price, helps traders and investors observe the average price that major traders consider the "fair price" for that move. VWAP is used by many institutions to set up large operations.
In this indicator, you can enjoy the following features:
Daily VWAP, with option to display your current price next to the chart VWAP Weekly, with option to display your current price next to the chart Monthly VWAP, with option to display your current price next to the chart
FREE

The Supertrend indicator was originally created by a french fellow named Olivier Seban , and its goal is to identify the Primary Trend of prices . Its calculation is easy and based on the average of Highs and Lows and then we add the volatility of a custom period, plus a multiplier. This way we get the Supertrend Line. You can find in the web several approaches and trading strategies using this very useful indicator.
HOW TO "READ" THIS INDICATOR
If the closing prices are above Supertrend Line,
FREE

Do you know VWAP Bands? It is an indicator used to identify support and resistance points from the daily VWAP and you can use it to check the best entry and exit points. This indicator does not use the principle of bollinger bands. There is a difference in the calculation method. Use it according to your strategy. See the applications and what results you can get. The indicator is free and can be used on any account.
FREE

The Price Action Finder Multi indicator is an indicator of entry points that searches for and displays Price Action system patterns on dozens of trading instruments and on all standard time frames: (m1, m5, m15, m30, H1, H4, D1, Wk, Mn). The indicator places the found patterns in a table at the bottom of the screen. By clicking on the pattern names in the table, you can move to the chart where this pattern is located. Manual (Be sure to read before purchasing) | Version for MT4 Advantages
1. Pat

节省时间并做出更明智的决策,使用锚定的 Sweet VWAP 如果您想测试这个工具的威力,您可以下载 MetaTrader 5 的锚定 VWAP 免费指标 。 除了这个指标可以独立工作外,它还是 Sweet VWAP 免费版本的一个扩展。 这是因为当您点击免费版本时,您在鼠标指针上看到的那个 VWAP 将被固定。为了更好地理解,固定在那里的是这个指标,具有其所有功能。 此指标与 Sweet VWAP 完全集成,这是 MetaTrader 5 的免费锚定 VWAP 指标。 功能 固定时间 这是您想要锚定 VWAP 的蜡烛。这是由 Sweet VWAP(免费版本)自动完成的,只需单击图表即可。 交易量类型 您可以选择交易量类型,也可以将其保持自动。自动表示它将使用交易资产的实际交易量作为优先级,前提是经纪商提供此信息。 VWAP 平滑方法 简单: 这是 VWAP 的标准计算,即价格加权交易量。 指数: 第一个变体。使用此计算,VWAP 对最新价格赋予更大的权重。如果您觉得市场刚刚形成了一个新的底部/顶部,这非常有用。然后,您检查在形成底部/顶部的蜡烛中形成的 AVWAP,并且在接下来的顶部

传奇的威廉·甘氏(William Gann)水平,全自动 MT5 指标。GANN Master 基于每日、每周和每月数据,精准定位价格最可能反转或继续趋势的关键区域。 主要功能: 一键时间周期按钮:点击 “Daily”/“Weekly”/“Monthly”,即可即时绘制当日、当周或当月的关键区域 自动与手动模式 自动模式:GANN Master 自动为您计算所有水平,无需手动输入 手动模式:拖动 “Top” 和 “Bottom” 线来定义自选波段点;所有 Gann 水平即时重新计算 多头与空头水平:同时显示买入和卖出水平;线条汇聚时标志着强劲支撑或阻力区域 灵活的品种支持:适用于外汇、贵金属(如黄金)、指数、加密货币及任何高价值品种——只需在设置中切换类别,即可自动调整刻度和倍数 直观用户界面:清晰配色、简洁标签和直观按钮,实时调整水平毫不费力 即战准备区:任意时间框架下,为止盈和风险管理提供精确目标区域 使用方法: 选择时间框架:点击 “Daily”/“Weekly”/“Monthly” 生成支撑与阻力线 选择品种类别:在设置中选定 “Forex”/“Metals”/“Indices
MT4: https://www.mql5.com/en/market/product/52715
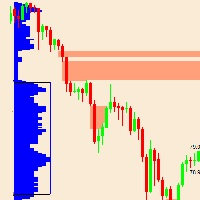
该指标基于市场概况理论。 单打区到底是什么? 理论:市场概况单打: 轮廓的单张或单张打印或间隙放置在轮廓结构的内部,而不是上边缘或下边缘。 它们以在市场资料上打印的单个TPO表示。 单身人士将我们的注意力吸引到价格快速波动(冲动)的地方。它们使低交易量的节点留有流动性缺口,从而导致市场失衡,并向我们展示了失衡的区域。通常,当市场对意外消息做出反应时,会创建单个。这些报告能够引起极端的失衡,并为买方和卖方的极端情绪反应做好准备。 市场将希望重新访问该区域,并检查这些价格水平是否不是对以这些价格进行交易感兴趣的交易者。这些商人为什么要在那里?因为市场从字面上飞过该地区,只有少数交易者有机会在该地区进行交易。为此,将来可能会填补这些领域。 这些低效的举动往往会被填补,一旦它们被填补,我们就可以寻找交易机会,或者我们也可以在它们被填补之前进入,并使用这些单张图作为目标。 用作支撑/阻力区域,但并非总是要小心。通常,它在趋势日表现良好。请参阅市场概况日:趋势日(策略1-买入-第三张图)和具有双

Note: this is a free indicator, for premium indicator,check out
https://www.mql5.com/en/market/product/125234 https://www.mql5.com/en/market/product/125234 https://www.mql5.com/en/market/product/125234 MEGASPIKES BOOM AND CRASH v1.32 NB: source codes of this indicator are available: PM me: https://t.me/Machofx PLEASE JOIN THE CHANNEL BELOW TO HAVE ACCESS TO ALL PREVIOUS VERSIONS check out Spikes robot
BoomCrash Cheatcode EA : https://www.mql5.com/en/market/product/103365 https://t.me/ma
FREE

FREE Heiken Ashi Smoothed indicator is fully adjustable, easy to use and comes with possibility to access the indicator via iCustom function so you can use it in your own trading software. Indicator can also pop up alerts when signal changes or send push notifications. For Metatrader 4 version click here: https://www.mql5.com/en/market/product/70824 For detailed information click: >>HERE<< Features
Easy to use Accessible via iCustom Fully adjustable Alerts and Push notifications Possib
FREE
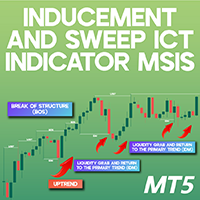
Inducement and Sweep ICT Indicator MT5 (MSIS)
The Market Structure Liquidity Trap Indicator (MSIS) is designed to highlight price movements that entice traders into making decisions based on misleading signals, such as false Support or Resistance levels. This tool identifies deceptive price action, revealing areas where traders might fall into liquidity traps, often resulting in unexpected losses. «Indicator Installation & User Guide» MT5 Indicator Installation | Inducement and Sweep ICT Indi
FREE

This all-in-one indicator displays real-time market structure (internal & swing BOS / CHoCH), order blocks, premium & discount zones, equal highs & lows, and much more...allowing traders to automatically mark up their charts with widely used price action methodologies. Following the release of our Fair Value Gap script, we received numerous requests from our community to release more features in the same category. "Smart Money Concepts" (SMC) is a fairly new yet widely used term amongst price a
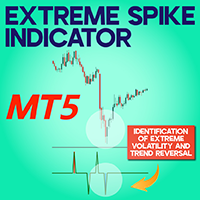
Extreme Spike indicator for MetaTrader 5 The Extreme Spike indicator for MetaTrader 5 applies ATR (Average True Range) analysis and advanced volatility filters to highlight sharp price movements and signal possible market reversals. On the MT5 platform, the indicator marks potential trend reversals to the downside with blue, and to the upside with red, equipping traders with timely alerts to manage risk and position themselves accordingly. «Indicator Installation & User Guide» MT5 Indicator Inst
FREE

Four MA on OBV - 您的终极交易指南! 通过 Four MA on OBV 指标释放您的交易潜力。此强大的指标专为MetaTrader 5平台设计,将四个移动平均线与平衡交易量(OBV)相结合,提供精确可靠的信号。 技术特点: 四个移动平均线: 集成简单、指数、平滑和线性移动平均线,进行详细的趋势监控。 OBV分析: 利用OBV检测在价格变化前的交易量变化,识别理想的进场和出场点。 可自定义设置: 根据您的交易策略调整参数,获得更大的灵活性和控制力。 实时提醒: 即时收到重大变化通知,允许快速和明智的操作。 主要优势: 信号精确度: 先进的假信号过滤,只提供最佳机会。 易于使用: 直观的界面,适合初学者和有经验的交易员。 收益提升: 通过优化您的交易决策来提升收益。
为什么选择Four MA on OBV? 信任和可靠性: 采用先进算法开发,并经过广泛测试,以确保一致的结果。 专属支持: 访问我们的专业支持团队,解答您的所有问题,并最大化您的交易体验。 明智投资: 使用真正与众不同的指标来改变您的交易策略。 通过 Four MA on OBV 改变您的金融市场之旅。

Special offer : ALL TOOLS , just $35 each! New tools will be $30 for the first week or the first 3 purchases ! Trading Tools Channel on MQL5 : Join my MQL5 channel to update the latest news from me 通过 Inversion Fair Value Gaps Indicator 解锁 ICT 的 反转公平价值缺口 (IFVG) 概念的强大功能!这款尖端工具将公平价值缺口 (FVG) 提升到新的水平,通过识别并显示反转 FVG 区域——价格修复后形成的关键支撑和阻力区域。无论您是短线交易者、波段交易者还是长期投资者,IFVG 指标都能为实时决策提供宝贵的见解。 查看 MT4 版本: Inversion Fair Value Gaps MT4 Multi TF 查看更多产品: 所有 产品 Some Usage Tips for Inversion Fair Valu

蜡烛计数器 此指标计算蜡烛并 将数字显示在屏幕上 基于更长的时间框架 较大的时间范围 您可以将每日时间范围选择为“ Bigger Timeframe ”,并在具有较小时间范围的任何图表中运行它。计数器将根据 每日图表 计算条形。 如果您将时间帧“ H1 ”作为参数传递,那么该指标将知道如何计算 H1 图表内的柱线,您只需在具有较小时间帧的图表上运行它即可。 主要参数是“ Bigger Timeframe ”,它比您使用的时间范围更大,是蜡烛计数的基础。 显示数字 除了这个参数之外,还有一个显示数字的参数,因为你不一定需要在屏幕中间看到数字,你可以通过按 CTRL+来看到计数D 并观察指标“ BarIn(大体时间) ”。 鼠标 当您在屏幕上 移动鼠标 时,该区域也非常有用,因此您将能够看到鼠标光标经过的确切栏,在图像中查看如何这行得通。 可分 有一个参数叫做“ Divisible ”这个参数是用来让你只看到能被这个参数整除的条数,这样屏幕就不会那么脏了这么多数字。 总和 还有参数“ Sum ”,它与参数 Divisible 一起使用,在图像中我留下了一个使用 Divisible 5 和
FREE

MACD divergence indicator finds divergences between price chart and MACD indicator and informs you with alerts (popup, mobile notification or email) . Its main use is to find trend reversals in the chart. Always use the divergence indicators with other technical assets like support resistance zones, candlestick patterns and price action to have a higher possibility to find trend reversals. Three confirmation type for MACD divergences: MACD line cross zero level Price returns to previous H/L Crea
FREE

介绍 Koala FVG for MT5 – 您的专业 Fair Value Gap (FVG) 模式指标 Koala FVG:您在 MT5 上精确交易的道路 解锁 Fair Value Gap (FVG) 模式的威力,使用 Koala FVG – 这是专为 MetaTrader 5 设计的先进指标。在有限的时间内,可以在其成为付费指标之前免费访问这个专业工具。 主要特点: FVG 模式检测: Koala FVG 智能识别基于可定制的最小和最大尺寸标准的 Qualified FVG 模式。 视觉呈现: 通过图形显示清晰度,其中包括动态矩形,用于说明 FVG 区域。三条线突出显示 FVG 水平,进行精确分析。 箭头入场信号: 永远不要错过交易机会。Koala FVG 提供清晰的箭头信号,指示入场点,让您能够做出明智的决策。 Koala FVG Scalper EA: 自动交易的卓越之选 通过下载 此处 可轻松将您的交易提升到新的水平。这款专家顾问与 Koala FVG 指标无缝集成,提供: 低回撤: 经验低于 7% 的回撤百分比,增强风险管理。 可靠的利润: 在整年内获得一贯和可靠的利润
FREE
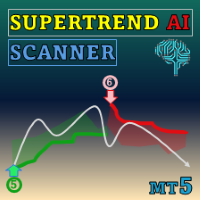
Special offer : ALL TOOLS , just $35 each! New tools will be $30 for the first week or the first 3 purchases ! Trading Tools Channel on MQL5 : Join my MQL5 channel to update the latest news from me 通过 SuperTrend AI Clustering MT5 with Scanner ,体验人工智能的强大力量。这款革命性的交易工具适用于 MetaTrader 5 (MT5),结合了 K-means 聚类和广受欢迎的 SuperTrend 指标,帮助交易者在趋势和信号中掌握主动。 See more MT4 version at: SuperTrend AI Clustering MT4 with Scanner See more products at: https://www.mql5.com/en/users/ndhsfy/seller
为何此工具独

Hull Moving Average (HMA) is well-deservedly popular among traders because of the effective averaging of market noise and a relatively small delay. The current MetaTrader 5 version changes its color when the movement direction changes. Sound and text signals are available. It also supports sending email and push messages. It is possible to trigger a signal on the current incomplete bar, although such a signal may be canceled before completion if conditions are no longer appropriate. One of the p
FREE

如果你象这个项目一样,就有5个饥饿审查。 这项指标采用了既定价格的公开、高、低价和关闭价格
可以对特定时间区加以调整。 许多机构和专业人士都认为这些是重要的。
贸易商可以为你了解他们可能更进一步的地点,
积极。 现有期间为: 前一日。 前一星期。 曾任Month。 曾任。 前一年。 或: 目前日。 目前周。 目前 Month。 目前配额。 今年。
FREE
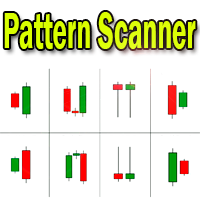
Candlestick pattern indicator - display found candlestick patterns on the chart. MT4-version: https://www.mql5.com/en/market/product/103345 Bearish patterns: Bearish Pattern Designations Pattern name SS
Shooting Star STR(S) Evening Star DJ(E) Evening Doji Star DC Dark Cloud Veil BEP Bearish Engulfing Bullish patterns: Designation of bullish patterns Pattern name HMR
Hammer pattern
STR(M) Morning Star DJ(M) Morning Doji Star PRL Piercing Line BEP Bullish Engulfing The Sh

Here is the boom and crash crazy Ma scalper a secretly coded color MA that is 1000% NON-REPAINT Works best on boom and crash 1000 Can be used on all timeframes from the 1 Minute timeframe to the Monthly timeframe The indicator is also a multi-time frame indicator you can select which timeframe to use The indicator is made for scalping purposes. as the trend changes the color of the indicator changes all well
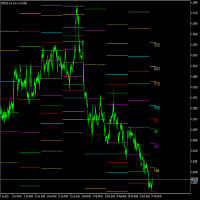
Fibonacci Pivots is a multi-timeframe indicator with custom alerts, designed to help traders easily identify key levels of support and resistance on any financial instrument. This advanced indicator uses the popular Fibonacci sequence to calculate pivot points based on the specified timeframe, depth, and backstep parameters. It also comes with customizable alerts. You can choose to be alerted when the price crosses any of the pivot points or when the price is within a specified frequency and pi
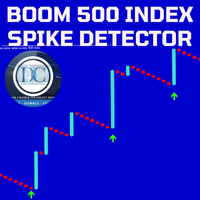
Our Spike Detector is specifically engineered to cater to the unique needs of traders in the Boom and Crash indices markets. This tool is optimized for M1 (1-minute) and M5 (5-minute) timeframes, ensuring you receive timely and actionable insights.
Key Features:
1. Non-Repainting**: Our detector guarantees accuracy with non-repainting signals, ensuring your data remains consistent and reliable. 2. Push Notifications**: Stay updated with real-time push notifications, so you never miss a criti

The indicator works to convert normal volume into levels and determine financial liquidity control points.
It is very similar in function to Fixed Volume Profile.
But it is considered more accurate and easier to use than the one found on Trading View because it calculates the full trading volumes in each candle and in all the brokers present in MetaTrade, unlike what is found in Trading View, as it only measures the broker’s displayed prices.
To follow us on social media platforms:
telegram
FREE

This indicator accurately identifies and informs market reversals and continuation patterns by analyzing and signaling the Three White Soldiers / Three Black Crows pattern. It also offers a "real-time backtesting" panel in the indicator itself in a way that every change made on the indicator parameters will immediately show the user how many signals are occurred, how many take profits and stop losses were hit and, by having these informations, the Win Rate and the Profit Factor of the setup bas

BUY INDICATOR AND GET EA FOR FREE AS A BONUS + SOME OTHER GIFTS! ITALO TREND INDICATOR is the best trend indicator on the market, the Indicator works on all time-frames and assets, indicator built after 7 years of experience on forex and many other markets. You know many trend indicators around the internet are not complete, does not help, and it's difficult to trade, but the Italo Trend Indicator is different , the Italo Trend Indicator shows the signal to buy or sell, to confirm the signal t
25% off. Original price: $40 RSI Scanner is a multi symbol multi timeframe RSI dashboard that monitors Relative Strength Index indicator for price entering and exiting overbought and oversold in up to 28 symbols and 9 timeframes.
Download Demo here (Scans only M1, M5 and M10) Settings description here MT4 version here
RSI Scanner features: Signals RSI entering and exiting the overbought and oversold zones. Monitors 28 customizable instruments and 9 timeframes at the same time. Supports a

DETECT THE TREND AND THE BEST PRICE TO ENTER A TRADE
Trend Detection for perfect entry - Distinguish the direction of thetrend and its strength, showing a line of different colors depending on whether the trend is strong bullish, weak bullish, strong bearish or weak bearish.- Best Entry point for perfect entry - Shows an area with the best entry in favor of trend. Never trade against the trend again.
Entry signals and alerts - When the price is in a valid zone, it sends pop up alerts, telephon

The indicator is designed to close positions on the market in time. For example: to take profits ahead of schedule if the price has not reached TakeProfit, and the market is turning around. The indicator analyzes the momentum, not the trend. He does not give any information about the trend. The indicator is well suited for finding divergence. The Ershov 38 Parrots indicator dynamically adjusts to the market and detects price movement impulses of medium and high amplitude. It almost does not rea
学习如何在MetaTrader AppStore上购买EA交易,MetaTrader平台的应用程序商店。
MQL5.community支付系统支持通过PayPay、银行卡和热门付款系统进行交易。为更好的客户体验我们强烈建议您在购买前测试EA交易。
您错过了交易机会:
- 免费交易应用程序
- 8,000+信号可供复制
- 探索金融市场的经济新闻
注册
登录