The First Red MT5

1. Introduction

The “First Red” Indicator is a tool designed to pinpoint dynamic market turning points by combining local price extremes with signals from the MACD (Moving Average Convergence Divergence) oscillator. Based on Dariusz Dargo’s original concept, it marks specific candles on your chart that meet the conditions of the “First Red” setup or its related variants—“Second Red,” “First Green,” and “Second Green.” These classifications let traders see at a glance when momentum may be shifting.

2. Core Concepts

Local Extremes

A candle is considered a local maximum if its High is greater than the Highs of surrounding bars, and a local minimum if its Low is lower than the Lows of surrounding bars. The indicator uses a look back window to confirm that a candle’s price truly stands out above or below its neighbours.

MACD Integration

The MACD histogram helps verify whether momentum is turning bullish or bearish:

  • Bearish turn: MACD values transition from rising to falling.
  • Bullish turn: MACD values transition from falling to rising.

3. Signal Definitions

  1. First Red

    • Local Maximum + MACD Flip downward on the Same Candle
    • The candle itself forms a local maximum and simultaneously causes the MACD to shift from rising to falling at its Close.
    • Chart Symbol: A red number “1” above the candle.
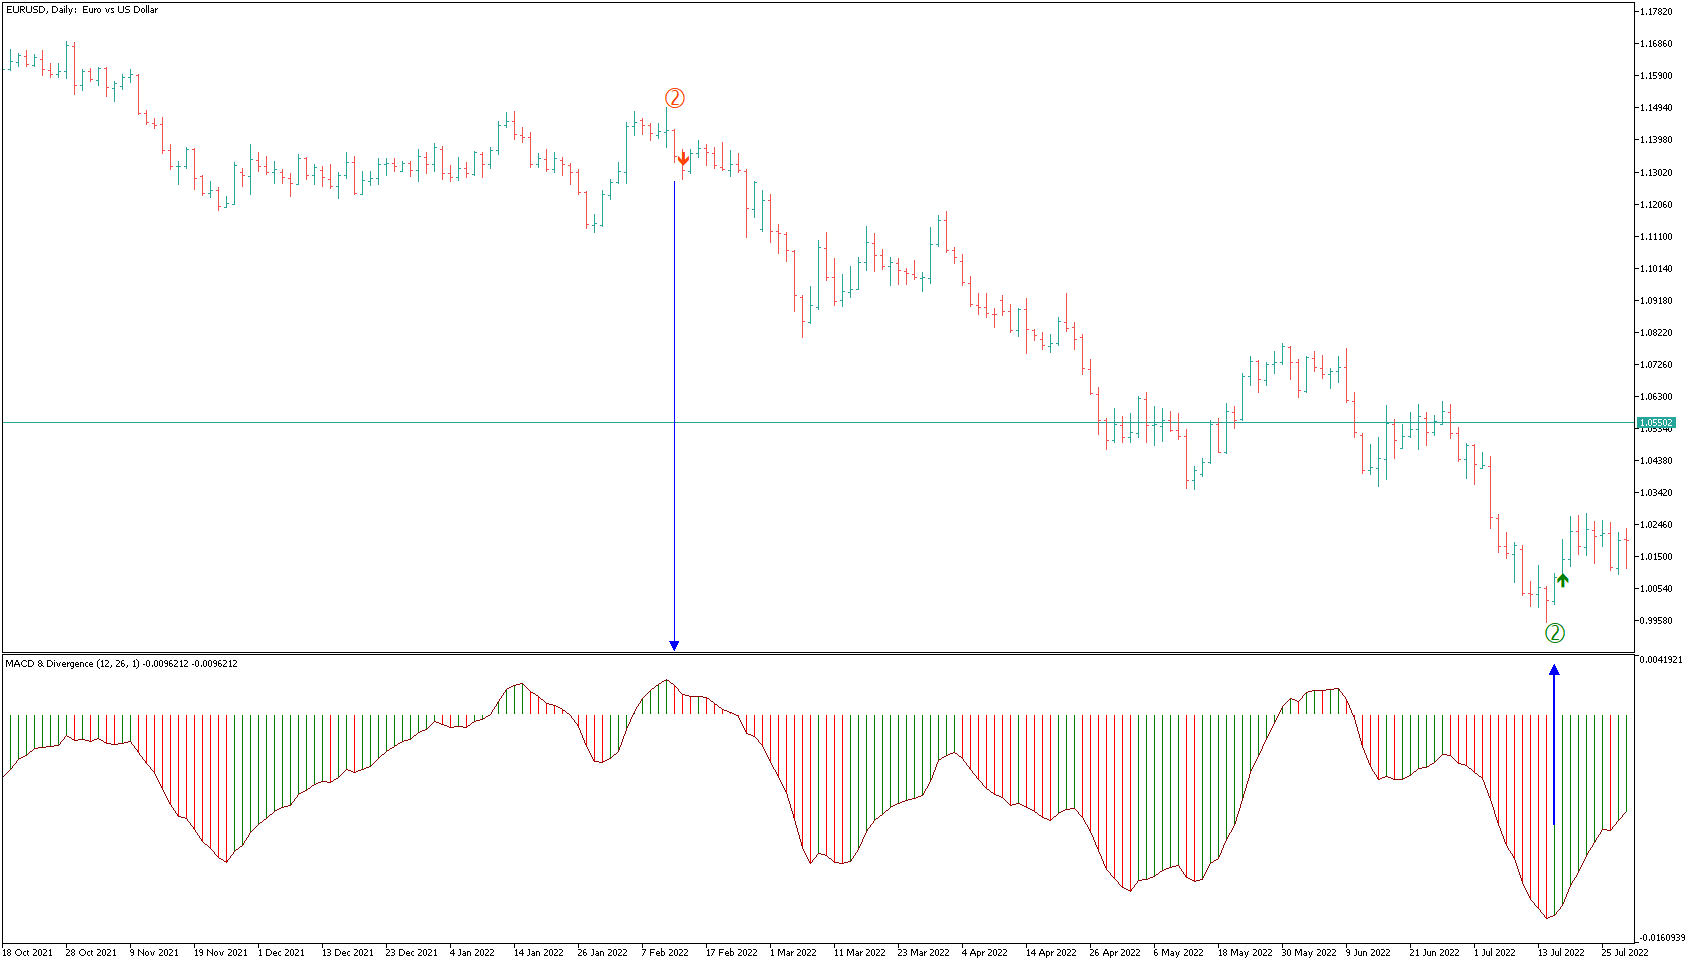
  2. Second Red

    • Local Maximum on the Previous Candle + MACD Flip on the Next Candle
    • The previous candle established a local maximum, but the MACD did not flip downward at that time.
    • The next candle (which is lower than the previous peak) does cause the MACD to turn bearish.
    • Chart Symbol: A red number “2” above the candle.
  3. First Green

    • Local Minimum + MACD Flip upward on the Same Candle
    • The candle itself creates a local minimum and simultaneously causes the MACD to shift from falling to rising at its Close.
    • Chart Symbol: A green number “1” below the candle.
  4. Second Green

    • Local Minimum on the Previous Candle + MACD Flip on the Next Candle
    • The previous candle established a local minimum, but the MACD did not flip upward at that time.
    • The next candle (which is higher than the previous trough) does cause the MACD to turn bullish.
    • Chart Symbol: A green number “2” below the candle.

4. Indicator Settings

MACD_Strength

  • Purpose
    Sets the number of consecutive bars the MACD must move in a single direction before a reversal signal is recognized.
  • Logic
    • For a bearish signal (red markers), the MACD must have been continuously rising for the specified number of bars (i.e., MACD_Strength) before it flips downward.
    • For a bullish signal (green markers), the MACD must have been continuously falling for MACD_Strength bars before it flips upward.
  • Interpretation
    A larger MACD_Strength value filters out weaker moves by requiring a stronger, more sustained MACD trend prior to suggesting a reversal.

Candle_Extreme_Strength

  • Purpose
    Defines how many bars must be checked to confirm that the current candle is truly a local maximum or minimum.
  • Logic
    • The indicator looks for the highest High or lowest Low within the last Candle_Extreme_Strength bars.
    • If the candle in question is the highest within that window, it’s a local top; if it’s the lowest, it’s a local bottom.
  • Interpretation
    A higher Candle_Extreme_Strength places a stricter requirement on what qualifies as an extreme, generally indicating a more significant potential turning point.

5. Why Two Types of Signals?

  • First Signals
    The same bar both creates the price extreme and triggers the MACD direction change.
  • Second Signals
    The local extreme occurs on one bar, but the MACD flip occurs on the following bar.

The “First” signals, which occur on the very candle that forms a local extreme and flips the MACD, are considered slightly stronger than the “Second” signals, which appear just one candle later. However, both “First” and “Second” signals provide robust indications of a potential market reversal.

By contrast, if the MACD change occurs multiple candles after the local extremum, the resulting signals are delayed and—according to Dariusz Dargo—are not recommended for opening new positions. These later signals often lag the actual turning point and may not offer the same trading advantage.

6. Indicator Features

  • Visual Clarity
    Marks candles directly on the chart with numerical labels (“1” or “2”), making it simple to identify potential turning points.
  • MACD-Based Confirmation
    Uses the MACD oscillator to filter out weaker signals and confirm true momentum shifts.
  • Customization
    Adjust number sizes, colours, and label placement to suit your personal trading style or chart theme.

7. Conclusion

The “First Red” Indicator offers a structured approach to spotting key market reversals using a blend of local price extremes and MACD signals. By distinguishing between “First” and “Second” candles, traders can decide whether they prefer early signals (labelled “1”) or further confirmation (labelled “2”). Fine-tune the MACD_Strength and Candle_Extreme_Strength settings to match your risk tolerance and style, and apply this indicator to any market or timeframe for a clearer picture of potential turning points.


Recommended products
KT DMA is a modified and advanced version of the classic Displaced Moving Averages with buy/sell crossover alerts and a Multi-Timeframe scanner that shows DMA's direction across each real-time time frame. A Displaced Moving Average is a simple moving average that moves ahead or backward in a time frame (either short-term or long-term). It also allows you to predict price movement more accurately. Features Depicts the trend direction using the alignment of three moving averages. Buy/Sell signals
SMC Workflow Auto EA
Choawana Malaikitsanachalee
English – Product Description (V1.42) SMC Workflow Auto EA — SR / OB / FVG with BOS–CHOCH Confirmation Smart-Money-Concepts Expert Advisor that trades only when a clean SMC setup appears: Order-Block retest after Break of Structure (BOS / CHOCH) confirmation, with optional SR and Fair Value Gap (FVG) confluence. The EA uses pending limit orders, fixed SL/TP or RR-based exits, step-lock trailing and strict risk-controls designed to pass broker validation. What it does Detects swing structure usi
FREE
DM IND Exclusive
Sergio Vidal Prado
Indicador Para Opções Binarias. Indicator for Binary Options Usa dois gales. Instalar em mt5 Esse indicador é para ser usado no tempo de vela de 5 minutos e em M5. Este também funciona em M1, porém é mais eficiente em M5. Só descompactar e copiar os arquivos na pasta de dados do seu MT5. Arquivos indicator na pasta MQL5 - Indicator. Baixe também a Media Movel totalmente gratis: https://www.mql5.com/pt/market/product/50400 Esse Indicador é para a próxima vela. Apareceu a seta, só aguardar a próx
KT Volatility Oscillator MT5
KEENBASE SOFTWARE SOLUTIONS
KT Volatility oscillator analyze the past and current market data with a mathematical formula to display the result in a form of an oscillator. The growing and deteriorating waves are equivalent to high and low volatility in the asset.  In a nutshell, volatility is simply a measurement of the price fluctuation of an asset over a certain period of time. Without volatility, there would not much movement in the market and traders would not be able to profit from the price movements. Use of Volatil
Utilities
Douglas Lucio De Araujo
Indicator with 3 features - Clock : Clock independent of the chart, counting continues even when the market is closed. - Template : After setting up a configuration in any graphic, be it color patterns, indicators, zoom ... The configuration will be copied to all active graphics. - TimeFrame : Set the TimeFrame on a chart, and with just one click all the active charts will be changed to the same TimeFrame.
Bearish/Bullish divergent bar . One of the signals of the "Trade Chaos" system of Bill Williams. (First wiseman) When bar moving away from the  "Alligator" indicator and there is divergence on the Awesome Oscillator indicator, it shows a potential point of movement change. It is based on the opening/closing of the bar, the position relative to the previous ones, the Alligator and AO. When trading, the entrance is at the breakthrough of the bar(short trade - low of bar, long trade high of bar), a
Indicator introduction:  A channel and trend line indicator, which is a good tool for manual trading, and also can be used for creating new EAs, without drifting or repainting.  It applies to any timeframes and any symbols.   The work of the indicator is shown in the screenshots. For any novice and programming trading friend, you can write the signal into the EA to play freely, buffer 0 corresponds to the bold trend line, buffer 4 and 5 respectively corresponds to the channel's upper and lower f
Fibonacci automatically draws Fibonacci retracement, Because Fibonacci automatically draws Fibonacci retracement, you can know at a glance the price to buy at a push or sell back. Therefore, you can trade in favorable conditions in a trending market. We are live-streaming the actual operation of the system. Please check for yourself if it is usable. Please check it out for yourself. https://www.youtube.com/@ganesha_forex We do not guarantee your investment results. Investments should be made
[ How to use the Demo version ] [ MT4 Version ] AO unpaid divergences MT5 AO unpaid divergences is the first indicator developed to detailed analyze Regular and Hidden Divergences. It uses this analysis to find out possible entry points and targets. Below some of the characteristics of this indicator:  Time saving Highly customizable Working for all pairs (Crypto, Forex, Stocks, Indices, Commodities...) Suitable for Scalping or Swing trading Possible reversal swings Alerts and Notifications on M
MasterCharts
Alexander Berger
You can think of these indicators as moving pivot points. MasterChartsTrading Price Action Indicators show good price levels to enter or exit a trade. The Blue indicator line serves as a Bullish Trend setter. If your instrument closes above the Blue line, we think about going Long (buying). When your trading instrument closes below the Red line, we think about Shorting (selling). It is very easy to read price action if you have a reference point. These support/resistance lines are there to help
Order Block Finder [LuxQuant] is a professional-grade Smart Money Concepts (SMC) indicator that automatically identifies institutional order blocks using volume pivot analysis and market structure detection. KEY FEATURES Automatic Bullish & Bearish Order Block Detection Volume Pivot-Based Institutional Zone Identification Smart Mitigation Detection (Wick or Close-based) Dynamic Order Block Zones w
FREE
This indicator draws a trend line and a trend tunnel on the chart. You can choose several calculation methods, alerts, notifications, and other settings. It can also draw trendlines from another TimeFrame. You can also use this indicator for your ExpertAdvisor. The current values of the lines are stored in the memory buffer from where the EA can load them. You can trade the price bounce from the upper and lower lines .   Settings TimeFrame – trend timeframe Description – show description of line
KT De Munyuk MT5
KEENBASE SOFTWARE SOLUTIONS
The KT De Munyuk is a trend-based indicator that uses   Parabolic SAR   to identify the market direction. The indicator shows the PSAR in the form of green/red dots using a separate window. Buy Signal:   When a green dot appears after a series of at least three red dots. Buy Exit:   When a red dot appears on the current or next higher time frame. Sell Signal:   When a red dot appears after a series of at least three green dots. Sell Exit:   When a green dot appears on the current or next higher
Clean Chart Toggle
Liam Alex Thomas Webb
5 (1)
The Clean Chart Toggle  is a user-friendly indicator designed to enhance your MetaTrader 5 (MT5) charting experience by providing a simple way to manage the visibility of indicators and objects on your chart. With a single button located in the top-left corner of the chart window, users can instantly hide or show all indicators and drawing objects, reducing clutter and improving focus on price action or specific analysis needs.  Key Features - One-Click Toggle Button: A button in the top-left
FREE
Double Fractal Entry Bot trades automatically using fractal breakouts or rebounds. It detects precise entry points, places SL and TP based on market structure, and includes logic to manage risk and avoid false signals. Simple, smart, and powerful. This product is also available for MetaTrader 4 =>  https://www.mql5.com/en/market/product/143609 Double Fractal Entry Bot is an intelligent trading robot based on the proven logic of the Double Fractal Entry indicator. It analyzes price using upper a
Adaptive Math Zones Indicator is a professional MT5 indicator designed to identify high-probability price reaction areas using mathematical price projections and Fibonacci-based channel structures. The indicator automatically builds a reference price channel, highlights neutral zones, and projects future price levels (50%, 100%, and 200%), helping traders visually understand market structure and potential reaction points. This tool is especially effective during ranging and corrective market con
1. Why did I develop this series of indicators I found that most traders need to use multiple time frame indicators. They usually switch time frame to see indicators. However, once the timeframe is switched, you cannot see the  corresponding relationship  between  the price in the smaller timeframe  and  the indicator in the larger timeframe . For example: if your price chart is in H1 timeframe, you can see H4, D1 and W1 indicators in H1 timeframe Chart. This is more helpful for you to find th
A top and bottom indicator that can intuitively identify the trend of the band. It is the best choice for manual trading, without redrawing or drifting. Price increase of $20 every 3 days, price increase process: 79-->   99 --> 119...... Up to a target price of $1000. For any novice and programming trading friend, you can write the signal into the EA to play freely. Array 3 and array 4, for example, 3>4 turns green, 3<4 turns red. If you don't understand, please contact me. ====================P
Moving pivot Average Fibonacci The  indicator compares the selected period with its counterpart from the previous period. The indicator determines the moving Fibonacci levels for the day or any time interval to assess the price movement range from the time average. The indicator helps predict the expected high or low for the day based on historical time data. The pivot line can be considered an average trend line and use it in a variety of trading strategies. If you have any question about the
SupportResistence
Eduardo Borges Mariani
SupportResistance is a dynamic support and resistance indicator based on the high and low of the previous candles. The calculation parameters are configurable. You can use the maximum and minimum values of the previous candle as a reference, or you can use the maximum and minimum of a group of previous candles. The indicator uses a red line to indicate resistance and a green line to indicate support. When a support or resistance is broken, its line is dotted, being restored only when it beco
Descriptions A point point is a technical analysis indicator, or calculations, used to determine the overall trend of market over different time frames. This indicator calculate the highest or lowest pivots among left x and right y bars and show the high/low level during that period.   From that, you could clearly see the top resistance & bottom support level and how market goes break out. Instructions pivotLeft - pivot left bar count pivotRight - pivot right bar count pivotHighColor - color
Flag MT5
Dmitry Fedoseev
An indicator of patterns #21, #22, #23 ("Flag") from Encyclopedia of Chart Patterns by Thomas N. Bulkowski. Parameters: Alerts - show alert when an arrow appears Push - send a push notification when an arrow appears (requires configuration in the terminal) PeriodBars - period in bars K - an additional parameter that influences the accuracy of pattern shape recognition. The influence of the parameter will be visible if not all of the pattern variants are enabled (not all three parameters Expandin
"Battles between bulls and bears continue to influence price development long after the combat has ended, leaving behind a messy field that observant technicians can use to manage risk and find opportunities. Apply "trend mirror" analysis to examine these volatile areas, looking for past action to impact the current trend when price turns and crosses those boundaries." RSI Mirrors and Reflections is a robust technique using multiple RSI periods, mirrors and reflections based on RSI values to ind
Auto Fibonacci Retracement Indicator — Flexible and Reliable This isn’t just another Auto Fibonacci Retracement indicator. It’s one of the most flexible and dependable tools available . If you find it useful, please consider leaving a review or comment — your feedback means a lot! Check out my other helpful tools below: Smart Alert Manager   - Set up advanced alerts and send them to Mobile, Telegram, Discord, Webhook... Timeframes Trend Scanner    - Scan the trend of assets in difference timefr
FREE
Sniper Pro
Md Wakiluzzaman Raz
Sniper Pro Sniper Pro is a sophisticated reversal trading indicator engineered for the MetaTrader platform. It utilizes advanced non-parametric regression and kernel smoothing techniques to filter out market noise and identify high-probability turning points. By calculating a dynamic probability envelope, the indicator provides a clear visualization of where price action is likely to exhaust and reverse back toward its mean. The Trading Philosophy Most traditional indicators rely on moving aver
ZigZagMozart
MIKHAIL VINOGRADOV
The ZigZagMozart indicator is based on the calculation of the advanced ZigZag. Displays trend break points (white squares), resulting points (yellow circles), flat zones (purple dots). The only indicator parameter: “ pivot in points ” - the minimum shoulder between the peaks of the indicator. The indicator uses market analysis based on the strategy of the famous modern trader Mozart. https://www.youtube.com/watch?v=GcXvUmvr0mY. ZigZagMozart - works on any currency pairs. If the parameter “pivo
Market structures are the one which when breakout in higher timeframe may help clears a trend to a trader. 1. This indicator will draw ZigZag to only last 2 structures (previous high and low of ZigZag ) and a new bar of ZigZag will be only formed when break of structure happens 2. It gives Terminal and Push notificationon break of structure 3. Increase and Decrease Extdepth of ZigZag from "[" and "]" keys to adjust swing 4. Change colors of Line AB BC and CD 5. Add to many charts and get alerts
Macd Pro Alpha Candles
Aiman Saeed Salem Dahbag
MACD Alpha Candles – Advanced MACD Visualization Using OHLC Candlestick Format MACD Alpha Candles is an advanced indicator that reconstructs the traditional MACD in an innovative way by transforming MACD movement into dynamic OHLC candlesticks or a MACD 2 Line display in a separate window, giving traders a deeper view of momentum behavior and market direction. The indicator calculates MACD using the difference of moving averages applied to Open, High, Low, and Close prices , not only the closing
A lot of professional traders use high quality divergence signals as a part of their strategy to enter a position. Spotting correct divergences quickly can often be hard, especially if your eye isn’t trained for it yet. For this reason we’ve created a series of easy to use professional oscillator divergence indicators that are very customisable so you get only the signals you want to trade. We have this divergence indicator for RSI, MACD, Stochastics, CCI and OBV. RSI:   https://www.mql5.com/en/
This indicator is an indicator for automatic wave analysis that is perfect for practical trading! Case... Note:   I am not used to the Western name for wave classification. Influenced by the naming habit of Chaos Theory (Chanzhongshuochan), I named the basic wave as   pen   , the secondary wave band as   segment   , and the segment with trend direction   as main trend segment   (this naming method will be used in future notes, let me tell you in advance), but the algorithm is not closely relat
Buyers of this product also purchase
SuperScalp Pro
Van Minh Nguyen
4.63 (24)
SuperScalp Pro – Advanced Multi-Filter Scalping Indicator System SuperScalp Pro is an advanced scalping indicator that combines the classic Supertrend with multiple intelligent confirmation filters to help identify trading opportunities. It works efficiently across multiple timeframes from M1 to H4, with optimized performance on XAUUSD, BTCUSD, and major Forex pairs. The indicator provides clear Buy and Sell signals, along with automatically calculated entry price, stop loss, and take profit lev
Divergence Bomber
Ihor Otkydach
4.9 (89)
Each buyer of this indicator also receives the following for free: The custom utility "Bomber Utility", which automatically manages every trade, sets Stop Loss and Take Profit levels, and closes trades according to the rules of this strategy Set files for configuring the indicator for various assets Set files for configuring Bomber Utility in the following modes: "Minimum Risk", "Balanced Risk", and "Wait-and-See Strategy" A step-by-step video manual to help you quickly install, configure, and s
Entry In The Zone and SMC Multi Timeframe is a real-time 2-in-1 market analysis tool that combines market structure analysis and a No Repaint BUY / SELL signal system into a single indicator, built on Smart Money Concepts (SMC) — a widely adopted framework used by professional traders to understand market structure. This indicator helps you see the market more clearly, make decisions based on structure rather than guesswork, and focus on high-probability zones where price is more likely to react
SignalTech MT5 is an unique fully rule based trading system for EURUSD, USDCHF, USDJPY, AUDUSD, NZDUSD, EURJPY, AUDJPY, NZDJPY, CADJPY.  All the winning trades with chart setups are published on the comments page. 2026-05 3173 Pips (Until 05-18 NY Closed) 2026-04 2243 Pips 2026-03 2165 Pips 2026-02 2937 Pips 2026-01 2624 Pips 2025-12 1174 Pips It can generate signals with Buy/Sell Arrows and Pop-Up/Sound Alerts. Each signal has clear Entry and Stop Loss levels, which should be automatically flag
Let's be honest first. No indicator will make you profitable on its own. If someone tells you otherwise, they're selling you a dream. Every indicator that shows perfect buy/sell arrows can be made to look flawless — just zoom into the right window of history and screenshot the winners. We won't do that. SMC Intraday Formula is a tool. It reads the market structure for you, maps the highest-probability price zones, and tells you exactly what the smart money footprint looks like right now — in pl
Power Candles MT5
Daniel Stein
5 (8)
Power Candles V3 - Self-Optimizing Strength Indicator Power Candles V3 turns currency and instrument strength into an actionable trade plan on every chart it is attached to. Instead of just coloring candles, it runs a live auto-optimization in the background and hands you the best Stop Loss, Take Profit and signal threshold for the symbol in front of you. One click adopts it for live trading - entry, Stop Loss and Take Profit rays appear on the chart at the exact prices, and alerts fire with dir
ARIPoint
Temirlan Kdyrkhan
1 (1)
ARIPoint is a powerful trading companion designed to generate high-probability entry signals with dynamic TP/SL/DP levels based on volatility. Built-in performance tracking shows win/loss stats, PP1/PP2 hits, and success rates all updated live. Key Features: Buy/Sell signals with adaptive volatility bands Real-time TP/SL/DP levels based on ATR Built-in MA Filter with optional ATR/StdDev volatility Performance stats panel (Success, Profit/Loss, PP1/PP2) Alerts via popup, sound, push, or email Cu
Gann Made Easy   is a professional and easy to use Forex trading system which is based on the best principles of trading using the theory of W.D. Gann. The indicator provides accurate BUY and SELL signals including Stop Loss and Take Profit levels. You can trade even on the go using PUSH notifications. PLEASE CONTACT ME AFTER PURCHASE TO GET TRADING  INSTRUCTIONS   AND GREAT EXTRA INDICATORS   FOR FREE! Probably you already   heard   about the Gann trading methods before. Usually the Gann theory
New Update of   Smart Trend Trading System MT5 For  2026 Market: If You Buy this Indicator you will Get my Professional Trade Manager + EA  for FREE . First of all Its worth emphasizing here that this Trading System is Non-Repainting   , Non Redrawing and Non Lagging Indicator Which makes it ideal from both manual and robot trading .  [Online course] , [manual] and [download presets] . The Smart Trend Trading System MT5 is a comprehensive trading solution tailored for new and experienced traders
Introducing   Quantum Breakout PRO , the groundbreaking MQL5 Indicator that's transforming the way you trade Breakout Zones! Developed by a team of experienced traders with trading experience of over 13 years,   Quantum Breakout PRO   is designed to propel your trading journey to new heights with its innovative and dynamic breakout zone strategy. Quantum Breakout Indicator will give you signal arrows on breakout zones with 5 profit target zones and stop loss suggestion based on the breakout b
Azimuth Pro
Ottaviano De Cicco
5 (7)
Azimuth Pro V2: Synthetic Fractal Structure and Confirmed Entries for MT5 Overview Azimuth Pro is a multi-level swing structure indicator by Merkava Labs . Four nested swing layers, swing-anchored VWAP, ABC pattern detection, three-timeframe structural filtering, and closed-bar confirmed entries — one chart, one workflow from micro-swings to macro-cycles. This is not a blind signal product. It is a structure-first workflow for traders who care about location, context, and timing. V2 Launch Offe
Trend Screener Pro MT5
STE S.S.COMPANY
4.85 (104)
Trend Screener Indicator --Professional Trend Trading & Market Scanning System for MetaTrader Unlock the true power of trend trading with Trend Screener Indicator — a complete multi-currency, multi-timeframe trend analysis solution powered by Fuzzy Logic,Trend Pulse Technology  and advanced market structure algorithms.   Trend Screener transforms your MetaTrader platform into a professional-grade Trend Analyzer and Market Scanner, helping you identify high-probability trend opportunities, early
FX Trend MT5 NG
Daniel Stein
5 (4)
FX Trend NG: The Next Generation Multi-Market Trend Intelligence Overview FX Trend NG is a professional multi-timeframe trend and market monitoring tool designed to give you a complete structural overview of the market in seconds. Instead of switching between dozens of charts, you instantly see which symbols are trending, where momentum is fading, and where strong alignment exists across timeframes. This tool is part of the Stein Investments ecosystem - 18+ tools plus Max, your 1-on-1 AI tradi
Meridian Pro
Ottaviano De Cicco
5 (2)
Meridian Pro 2.00: Professional Multi-Timeframe Trend Matrix for MT5 Meridian Pro 2.00 is a professional adaptive trend matrix for MetaTrader 5. It combines the original Meridian trend engine, a clean chart ribbon, closed-bar signal arrows, an 8-timeframe dashboard, Fuel momentum, weighted consensus, synthetic HTF processing and chart-native higher-timeframe context lines. The goal is simple: read current trend, multi-timeframe structure, strength, momentum and EA-ready state from one discipline
First of all Its worth emphasizing here that this Trading Tool is Non Repainting , Non Redrawing and Non Lagging Indicator , Which makes it ideal for professional trading . [Online course] ,   and   [manual] The Smart Price Action Concepts Indicator is a very powerful tool for both new and experienced traders . It packs more than 20 useful indicators into one , combining advanced trading ideas like Inner Circle Trader Analysis and Smart Money Concepts Trading Strategies . This indicator focuses
Market Structure Order Block Dashboard MT5 is an MT5 indicator designed for traders who want to read market structure and the main price reaction zones directly on the chart. It combines BOS, ChoCH, Order Blocks, Fair Value Gaps (FVG), Liquidity, Kill Zones, Volume Profile, and a compact dashboard for quick analysis. This indicator targets traders who use market structure, ICT and Smart Money concepts as a decision framework. It can help spot trend continuations, possible reversals, price imbala
FX Power MT5 NG
Daniel Stein
5 (31)
FX Power: Analyze Currency Strength for Smarter Trading Decisions Overview FX Power is your go-to tool for understanding the real strength of currencies and Gold in any market condition. By identifying strong currencies to buy and weak ones to sell, FX Power simplifies trading decisions and uncovers high-probability opportunities. Whether you’re looking to follow trends or anticipate reversals using extreme delta values, this tool adapts seamlessly to your trading style. Don’t just trade—trade
Gem SIGNAL
Shengzu Zhong
5 (1)
GEM Signal Pro GEM Signal Pro is a trend-following indicator for MetaTrader 5, designed for traders who want clearer signals, more structured trade setups, and practical risk management directly on the chart. Instead of showing only a simple arrow, GEM Signal Pro helps present the full trade idea in a cleaner and more readable way. When conditions are confirmed, the indicator can display the entry price, stop loss, and take profit targets on the chart, helping traders review the setup more effic
Top indicator for MT5   providing accurate signals to enter a trade without repainting! It can be applied to any financial assets:   forex, cryptocurrencies, metals, stocks, indices .  Watch  the video  (6:22) with an example of processing only one signal that paid off the indicator! MT4 version is here It will provide pretty accurate trading signals and tell you when it's best to open a trade and close it. Most traders improve their trading results during the first trading week with the help of
Btmm state engine pro
Garry James Goodchild
5 (4)
BTMM State Engine Pro is a MetaTrader 5 indicator for traders who use the Beat The Market Maker approach: Asian session context, kill zone timing, level progression, peak formation detection, and a multi-pair scanner from a single chart. It combines cycle state logic with a built-in scanner dashboard so you do not need the same tool on many charts at once. What it does Draws the Asian session range; session times can follow broker server offset or be set in inputs. Tracks level progression (L
Atomic Analyst MT5
Issam Kassas
3.94 (31)
New Update of   Atomic Analyst MT5 For  2026 Market: If You Buy this Indicator you will Get my Professional   Trade Manager + EA  for   FREE . First of all Its worth emphasizing here that this Trading Indicator is   Non-Repainting   , Non Redrawing and Non Lagging Indicator   Indicator, Which makes it ideal from both manual and robot trading.  User manual: settings, inputs and strategy . The Atomic Analyst  is a PA Price Action Indicator that uses Strength and Momentum of the price to find a bet
This dashboard shows the latest available   harmonic patterns   for the selected symbols, so you will save time and be more efficient /   MT4 version . Free Indicator:   Basic Harmonic Pattern Comparison of "Basic Harmonic Pattern" vs. "Basic Harmonic Patterns Dashboard" Indicators Feature Basic Harmonic Pattern Basic Harmonic Patterns Dashboard Functionality Detects and displays harmonic patterns on a single chart Searches multiple symbols and timeframes for harmonic patterns, displays res
Quantum TrendPulse
Bogdan Ion Puscasu
5 (25)
Introducing Quantum TrendPulse , the ultimate trading tool that combines the power of SuperTrend , RSI , and Stochastic into one comprehensive indicator to maximize your trading potential. Designed for traders who seek precision and efficiency, this indicator helps you identify market trends, momentum shifts, and optimal entry and exit points with confidence. Key Features: SuperTrend Integration: Easily follow the prevailing market trend and ride the wave of profitability. RSI Precision: Detect
Trend Forecaster
Alexey Minkov
5 (7)
Trend Forecaster – Since 2023. The Trend Forecaster indicator utilizes a unique proprietary algorithm to determine entry points for a breakout trading strategy. The indicator identifies price clusters, analyzes price movement near levels, and provides a signal when the price breaks through a level. The Trend Forecaster indicator is suitable for all financial assets, including currencies (Forex), metals, stocks, indices, and cryptocurrencies. You can also adjust the indicator to work on any time
OrderFlux | Footprint Orderflow for MetaTrader 5 Version 2.0 – Real-time Bid/Ask Visualization for Active Traders OrderFlux is a footprint and orderflow indicator for MT5. It shows not only where the price has moved, but what happens inside the movement: Bid/Ask volume per price level, delta, imbalance, and volume distribution. Many charts only show you the final result of a candle. OrderFlux shows you the path to get there. This is exactly what helps when you want to read market participation i
RelicusRoad Pro MT5
Relicus LLC
4.96 (24)
RelicusRoad Pro: Quantitative Market Operating System 70% OFF LIFETIME ACCESS (LIMITED TIME) - JOIN 2,000+ TRADERS Why do most traders fail even with "perfect" indicators? Because they trade Single Concepts in a vacuum. A signal without context is a gamble. To win consistently, you need CONFLUENCE . RelicusRoad Pro is not a simple arrow indicator. It is a complete Quantitative Market Ecosystem . It maps the "Fair Value Road" price travels on, distinguishing between random noise and true structur
Grabber System MT5
Ihor Otkydach
4.83 (23)
Let me introduce you to an excellent technical indicator – Grabber, which works as a ready-to-use "All-Inclusive" trading strategy. Within a single code, it integrates powerful tools for technical market analysis, trading signals (arrows), alert functions, and push notifications. Every buyer of this indicator also receives the following for free: Grabber Utility for automatic management of open orders Step-by-step video guide: how to install, configure, and trade with the indicator Custom set fi
Trend Lines PRO MT5
Roman Podpora
5 (1)
TREND LINES PRO  -   helps understand where the market is truly changing direction. The indicator shows real trend reversals and points where major players re-enter. You see   BOS lines   Trend changes and key levels on higher timeframes — without complex settings or unnecessary noise. Signals don't repaint and remain on the chart after the bar closes. MT4 VERSION   - Reveals its maximum potential when combined with the   RFI LEVELS PRO   indicator What the indicator shows: Real shifts   trend
RFI levels PRO MT5
Roman Podpora
3.67 (3)
The indicator accurately shows the reversal points and price return zones where the   Major players . You see where new trends are forming and make decisions with maximum precision, maintaining control over every trade. VERSION MT4     -    Reveals its maximum potential when combined with the   TREND LINES PRO   indicator What the indicator shows: Reversal structures and reversal levels with activation at the beginning of a new trend. Display of   TAKE PROFIT   and   STOP LOSS   levels with min
Weltrade Spike Sentinel
Batsirayi L Marango
5 (1)
Introducing Indicator for PainX and GainX Indices Traders on Weltrade Get ready to experience the power of trading with our indicator, specifically designed for Weltrade   broker's PainX and GainX Indices.  Advanced Strategies for Unbeatable Insights Our indicator employs sophisticated strategies to analyze market trends, pinpointing optimal entry and exit points.  Optimized for Maximum Performance To ensure optimal results, our indicator is carefully calibrated for 5-minute timeframe charts on
More from author
Integrated Dashboard Scanner
Krzysztof Janusz Stankiewic
5 (1)
Integrated Dashboard Scanner – Version 4.00 The Ultimate Market Command Center just got smarter. Now with Programmable Logic Presets. The Integrated Dashboard Scanner (IDS) monitors multiple symbols and timeframes from a single, DPI-aware panel. Version 4.00 introduces a revolutionary Preset Editor , allowing you to combine signals from different modules into complex, custom strategies without writing a single line of code. NEW IN VERSION 4.00: Filter Presets & Logic Editor Stop scanning for
Supply Demand Ranger
Krzysztof Janusz Stankiewic
5 (4)
The indicator draws supply and demand zones. The zone timeframe can be set independently of the chart timeframe. For instance, it is possible to set M5 zones on an H4 chart. The importance of zones can be adjusted using the zone strength parameter. Demand zones are displayed if at least one candle in the range of the zone is entirely above the zone. Similarly, supply zones are displayed if at least one candle within the zone is entirely below the zone.
MT5 Macd Divergence Scanner
Krzysztof Janusz Stankiewic
This indicator helps you monitor multiple currency pairs and timeframes all at once. It displays the occurrence of divergences between price and the MACD indicator in a clear and easy-to-read table. Monitoring multiple timeframes and currency pairs in one place helps traders identify a divergence without needing to switch between charts. Divergences can be bullish or bearish. For example, if the price forms a higher high while the MACD forms a lower high, this indicates bearish divergence. On th
MACD Divergence and TFR for MT5
Krzysztof Janusz Stankiewic
5 (1)
The indicator identifies divergence by analyzing the slopes of lines connecting price and MACD histogram peaks or troughs. Bullish Divergence (Convergence): Occurs when the lines connecting MACD troughs and corresponding price troughs have opposite slopes and are converging. Bearish Divergence: Occurs when the lines connecting MACD peaks and corresponding price peaks have opposite slopes and are diverging. When a divergence signal is detected, the indicator marks the chart with dots at the pric
Supply Demand FVG Zones
Krzysztof Janusz Stankiewic
5 (1)
Supply or demand zones refer to price areas where a significant amount of supply or demand had previously entered the market, causing prices to either fall or rise. If the price returns to the demand or supply zone, it is likely to bounce off due to the large number of orders previously placed within the zone. These orders will be defended in these areas. The Fair Value Gap (FVG) is a concept used to identify imbalances in the equilibrium of buying and selling. Fair Value Gaps are formed in a t
MACD Divergence and TFR for MT4
Krzysztof Janusz Stankiewic
5 (1)
The indicator identifies divergence by analyzing the slopes of lines connecting price and MACD histogram peaks or troughs. Bullish Divergence (Convergence): Occurs when the lines connecting MACD troughs and corresponding price troughs have opposite slopes and are converging. Bearish Divergence: Occurs when the lines connecting MACD peaks and corresponding price peaks have opposite slopes and are diverging. When a divergence signal is detected, the indicator marks the chart with dots at the pric
Purpose of the Inside Bar and Outside Bar Breakout Scanner Indicator: The Inside Bar & Outside Bar Breakout Scanner  is an advanced dashboard designed to scan multiple instruments and timeframes simultaneously. Its primary function is to identify two powerful candlestick patterns—the  Inside Bar (IB)  and the  Outside Bar (OB) —and then to detect and classify breakouts from these formations. The indicator presents its findings in a clean, organized table, signaling potential trend continuation o
Symbol
Krzysztof Janusz Stankiewic
For those who monitor charts from afar, this utility is essential. It displays the chart symbol, time frame, and bid price as text. Users can adjust the text position, color, and font size. It’s also a useful tool for forex video publishers. There will be no more complaints about which symbol and time frame are displayed on the screen, even if the content is viewed on a phone. Symbol prefixes such as “_ecn” or “_stp” can be removed from the displayed symbol.
FREE
Supply Demand FVG
Krzysztof Janusz Stankiewic
3 (2)
The indicator offers a comprehensive suite of features for identifying key market areas, including: Supply Zones Demand Zones Fair Value Gaps (FVG) and provides alerts whenever price reaches a supply or demand zone. Key Features: Historical Zones: In addition to active zones, the indicator now includes historical supply, demand, and FVG zones, allowing for a deeper analysis of past price behavior. Flexible Zone Timeframes: Zones can be plotted independently of the chart's timeframe, enabling sce
MT4 Macd Divergence Scanner
Krzysztof Janusz Stankiewic
This indicator provides an efficient way to monitor multiple currency pairs and timeframes simultaneously. By visually displaying price-MACD divergences in a structured, easy-to-read table, it allows traders to detect potential market turning points without constantly switching between charts. Divergences can signal either bullish or bearish momentum shifts. For instance, a bearish divergence occurs when the price reaches a new high, but the MACD fails to confirm this with a corresponding higher
The First Red MT4
Krzysztof Janusz Stankiewic
1. Introduction The “First Red” Indicator is a tool designed to pinpoint dynamic market turning points by combining local price extremes with signals from the MACD (Moving Average Convergence Divergence) oscillator. Based on Dariusz Dargo’s original concept, it marks specific candles on your chart that meet the conditions of the “First Red” setup or its related variants—“Second Red,” “First Green,” and “Second Green.” These classifications let traders see at a glance when momentum may be shifti
Filter:
No reviews
Reply to review