YouTubeにあるマーケットチュートリアルビデオをご覧ください
ロボットや指標を購入する
仮想ホスティングで
EAを実行
EAを実行
ロボットや指標を購入前にテストする
マーケットで収入を得る
販売のためにプロダクトをプレゼンテーションする方法
MetaTrader 5のためのテクニカル指標 - 4

ブームおよびクラッシュスパイク検出器インジケーターは、主に価格のブームおよびクラッシュを検出するための高度な戦略に基づいてコーディングされています。 価格の高確率のブームとクラッシュを検出するために、複雑なアルゴリズムが組み込まれました。 ブームまたはクラッシュフェーズの可能性について警告します。
ブームフェーズ:価格の上昇が速すぎる場合。 クラッシュフェーズ:価格の低下が速すぎる場合。
期間限定オファー:インジケーターは30ドルと生涯でのみご利用いただけます。
主な機能
プッシュ通知を携帯電話に送信します コンピューターまたはラップトップでポップアップしてアラートを鳴らします 再描画されない矢印を表示します(潜在的なブームの場合は上向きの矢印、潜在的なクラッシュの場合は下向きの矢印) すべてのペアでの作業。
おすすめ
時間枠:H1およびH4 ペアの推奨:トレンドフェーズのペア。
コンタクト
ご不明な点がある場合やサポートが必要な場合は、プライベートメッセージでご連絡ください。
著者
SAYADI ACHREF、fintechソフトウェアエンジニアおよびFinansyaの

THE MAGICIAN - プロフェッショナル需給ゾーンインジケーター ゴールド15分足チャートで市場の混沌を明確なトレーディング機会に変換 ゴールド取引でお困りですか? XAU/USDでどこでエントリーすべきか推測するのに疲れていませんか? 買うべきか、売るべきか、様子を見るべきか混乱していませんか? 15分足タイムフレームで高確率のセットアップを逃していませんか? 「THE MAGICIAN」は市場を動かす需給の見えない力を明らかにします! THE MAGICIANの独自性とは? マルチタイムフレーム分析 H4、日足、週足のタイムフレームを同時に分析 複数のタイムフレームが一致する合流ゾーンを特定 最高確率の取引のためにHTF確認済みゾーンを表示 低品質シグナルを自動的に排除 フレッシュ(未ブレイク)ゾーンのみ ブレイク済みゾーンは表示しない - 未テストのレベルのみ 各ゾーンにフレッシュインジケーターでマーク 50%浸透閾値で品質検出を保証 ブレイクせずにゾーンタッチを追跡 インテリジェントトレーディングガイダンス インジケーターが取引または待機の理由を正確に
FREE

Was: $99 Now: $49 Blahtech Daily Range indicator displays the average daily range alongside the individual session ranges. Using the daily open price as a reference the indicator shows fixed range and dynamic range targets as lines on the charts. These lines clearly show when the average range has been exhausted. Daily and session ranges can be useful for confirming entries or setting targets and is an excellent odds enhancer for many trading systems. Links [ Documentation | Install | U
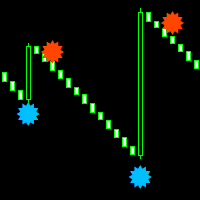
Boom and crash smasher free indicator that works on all timeframe from the one minute to the monthly timeframe. the indicator is 100% non-repaint. the indicator come with sound alerts and email push notification the indicator appears on the current candle stick for faster entries can be used on all charts and renko charts orange dot is your sell signal blue dot is your buy signal
FREE
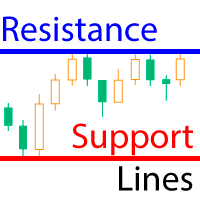
The indicator calculates fractal lines, which are technically psychological support/resistance lines. In fact, these are the highs and lows of the price over a period of time. The indicator works on all charts and timeframes. This free version of the Resistance Support Lines Pro indicator comes as is! Settings: These settings cannot be changed in this version Fractal Candels = 5 - number of candles from which a fractal is built. Calculates the maximum/minimum at which a psychological price can b
FREE
Special offer : ALL TOOLS , just $35 each! New tools will be $30 for the first week or the first 3 purchases ! Trading Tools Channel on MQL5 : Join my MQL5 channel to update the latest news from me Follow Line MT5 とスキャナーを使って、ボラティリティに基づいた高度なインジケーターでトレーディングエッジを最大限に活用しましょう。このツールは、カスタマイズ可能な設定とともに、ボリンジャーバンドの力を組み合わせ、価格の動きについて正確な洞察を提供します。 See more MT4 version at: Follow Line MT4 with Scanner See more products at: https://www.mql5.com/en/users/ndhsfy/seller Follow Line の鍵は、価格が 1 標準偏差に設
FREE

Introducing our exciting new Price Retest indicator! Get instant alerts when the price retests, giving you a powerful edge in your trading strategy. Remember to do your own analysis before making any moves in the market. MT4 Version - https://www.mql5.com/en/market/product/118031 Join To Learn Market Depth - https://www.mql5.com/en/channels/suvashishfx
Here’s a detailed explanation of how the Price Retest indicator works, its components, and how you can incorporate it into your trading strat
FREE
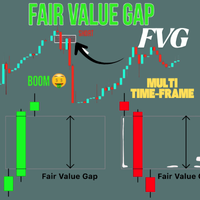
Crystal FVG Touch Detector – スマートマネーコンセプト対応高機能インジケーター Crystal FVG Touch Detector は、Smart Money Concepts (SMC) と ICT 手法を使用するトレーダー向けに設計されたプロ仕様の指標です。
あらゆる時間足で Fair Value Gap (FVG) を自動検出し、タッチをリアルタイムに認識して表示します。
リペイントしないアルゴリズムにより、機関トレーダーの不均衡ゾーンを正確に把握します。 主な特徴 FVG(強気・弱気)を自動で検出。 タッチ時に即時更新。 全時間足対応。 カラー自動調整。 高速・安定動作。 カスタマイズ可能な設定。 キーワード:
FVG, Fair Value Gap, Smart Money Concepts, SMC, ICT, Order Block, Imbalance, 流動性, サプライ・デマンド, Non Repaint, Volume Spread Analysis, Market Structure, CHoCH, BOS, Liquidity
FREE
HTF Power of Three (ICT) - MT5 Indicator - Version 1.1 Overview The HTF Power of Three indicator is a professional implementation of the Inner Circle Trader's (ICT) Power of Three concept, inspired by Larry Williams. This indicator visualizes higher timeframe (HTF) candle development in real-time on any lower timeframe chart, making it an essential tool for ICT traders who study institutional price movement patterns. What is Power of Three (PO3)? Power of Three represents a three-staged Smart M

SuperTrend Alert MT5で市場トレンドをマスターしましょう。この強力なインジケーターは、外国為替、株式、暗号通貨、商品取引向けに正確なトレンド追従シグナルを提供するために設計されています。Forex FactoryやRedditのr/Forexなどのトレーディングコミュニティで称賛され、InvestopediaやTradingViewの議論でもその堅牢なトレンド検出能力で高く評価されており、信頼性の高いエントリーとエグジットを求めるトレーダーにとって必須のツールです。ユーザーは、SuperTrendのシグナルをプライスアクションと組み合わせることで、トレンド方向を最大90%の精度で特定し、リアルタイムアラートを活用してトレンドの変化を捉えることで、取引タイミングが25-35%向上したと報告しています。主な利点には、高度なトレンド分析、カスタマイズ可能な設定によるパーソナライズされた戦略、チャートを常に監視せずに意思決定を向上させる軽量デザインが含まれ、スカルパー、デイトレーダー、スイングトレーダーに最適です。 SuperTrend Alert MT5は、独自のアルゴリズ
FREE

Improved version of the free HMA Trend indicator (for MetaTrader 4) with statistical analysis. HMA Trend is a trend indicator based on the Hull Moving Average (HMA) with two periods. HMA with a slow period identifies the trend, while HMA with a fast period determines the short-term movements and signals in the trend direction.
The main differences from the free version: Ability to predict the probability of a trend reversal using analysis of history data. Plotting statistical charts for analyzi
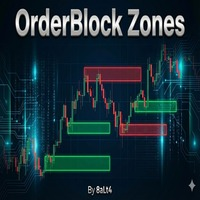
概要 OrderBlock Zoneは、市場における機関投資家の取引領域(オーダーブロック)を自動的に検出・可視化する、高度なMetaTrader 4インジケーターです。大手プレイヤー(銀行、ヘッジファンド)が残した痕跡を追跡し、潜在的なサポートレベルとレジスタンスレベルを特定します。
主な機能 自動オーダーブロック検出 フラクタルベースの分析:36 期間(カスタマイズ可能)のフラクタル分析により、強力な転換点を特定 ブル&ベアゾーン:緑色の矢印は上昇、赤色の矢印は下降のオーダーブロックを示します 巻き込みパターンサポート:巻き込みローソク足パターンを認識し、より強力なシグナルを生成 ビジュアルツール 自動レベルライン:各オーダーブロックの上限および下限ライン カラーゾーン:ブル(緑)とベア(赤)のゾーンが明確に区別 巻き込みハイライト:巻き込みパターンを青/オレンジの四角形で強調表示 すっきりしたインターフェース:グリッドは自動的に閉じ、グラフは最適化された表示のために左にスライド カスタマイズ可能なパラメータ フラクタル周期:感度を調整(デフォルト:36) 線の長さ:Ord
FREE

Crystal Volume Indicator — MT5向けボリューム分析ツール 概要
Crystal Volume Indicator は MetaTrader 5 用の高度で直感的なインジケーターです。価格の動きと出来高の関係を組み合わせ、市場の隠れた強さを視覚的に把握できます。買いクライマックス、売りクライマックス、弱いローソク足などを検出し、反転や継続の可能性を見極めやすくします。 主な機能 Tick Volume と Real Volume の両方に対応(ブローカー次第) 色分けされたヒストグラムで出来高イベントを分類 買い/売りクライマックス検出 出来高が低いローソク足を識別 出来高ベースの移動平均線(オプション) 任意の期間を指定可能(Lookback Window) ローソク方向に基づく着色モード 出来高イベントの分類 買いクライマックス — 非常に高い出来高で、高値付近で終値を形成 売りクライマックス — 非常に高い出来高で、安値付近で終値を形成 弱いローソク — 指定期間内で最も低い出来高 高相対出来高 — ローソクのレンジに比べて異常に大きな出来高 中立バ
FREE
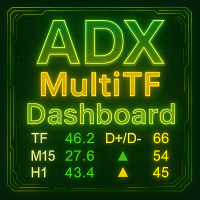
ADX MultiTF Dashboard 概要 ADX MultiTF Dashboardは、選択された3つの時間軸でトレンドの強さと方向に関する重要な情報を同時に表示するマルチタイムフレームインジケーターです。このインジケーターは、包括的な市場分析のためにADX値、方向性移動指標、RSI値を示すコンパクトなダッシュボード形式でデータを表示します。 ダッシュボードは、ADXによって測定されるトレンドの強さ、DIの比較によって決定されるトレンドの方向、買われ過ぎまたは売られ過ぎの可能性のある状態を示すRSIレベルなど、取引判断に重要な情報を提供します。これらの情報はすべて3つの時間軸で同時に表示され、トレーダーが異なる時間枠でシグナルを確認できるようにします。 主な機能 Multi-Timeframe Analysis このインジケーターは、ユーザーが選択した3つの時間軸で市場状況を同時に監視します。これにより、トレーダーは短期的な動きと長期的なトレンドの両方を観察できます。一般的な時間軸の組み合わせには、デイトレード用のM5-M15-H1、スイングトレード用のH1-H4-D1、または
FREE

Breakthrough Solution For Trend Trading And Filtering With All Important Features Built Inside One Tool! Trend PRO's smart algorithm detects the trend, filters out market noise and gives entry signals with exit levels. The new features with enhanced rules for statistical calculation improved the overall performance of this indicator.
Important Information Revealed Maximize the potential of Trend Pro, please visit www.mql5.com/en/blogs/post/713938
The Powerful Expert Advisor Version
Automatin

サプライ/デマンドゾーン:過去に価格が何度も接近した観察可能な領域。 多機能ユーティリティ: 66+ 機能 ,このインジケーターを含む | 質問があれば私に連絡 してください | MT4バージョン このインジケーターは、価格が再び反転する可能性のある場所を示します。 通常、価格がそのレベルで拒否された回数が多いほど、そのレベルは重要です。 入力設定で 調整できる項目: 弱いゾーン を有効または無効にします; ゾーンの説明 を表示または非表示にします; フォントサイズ; 基本色を設定: サポートとレジスタンスごとに別々に:
選択した色は弱いゾーンでは薄くなり、チャートを視覚的に分析するのに役立ちます; ゾーン計算の時間枠; 需給ゾーン は、価格チャート上で過去に大きな買い(需要)または売り(供給)が発生した重要な領域です。これらのゾーンは、価格変動の 潜在的な反転または継続 を予測するのに役立ちます。需給トレードは、トレンドライン、移動平均線、オーダーフロー分析などの 他のツールと組み合わせる と最も効果的です。 需給ゾーンの特定方法: 需要ゾーン(買い圧力)

Was: $49 Now: $33 Blahtech Better Volume provides an enhanced version of the vertical volume bars. Each bar is compared to the previous 20 bars. Depending on its volume, range and volume density it will be assigned a state and colour. Low Volume – Minimum volume High Churn – Significant volume with limited movement Climax Neutral – High volume with unclear direction
Climax Up – High volume with bullish direction Climax Dn – High volume with bearish direction Climax Churn – High vol

The ultimate M5 indicator for Boom 300 indx, providing clear, filtered buy/sell signals to eliminate market noise and enhance your trading precision. Benefit-Focused spike alert on time
spike signals
spike trade sl 5 candels
trend following dashboard to know trend strength and direction
use it in any market conditions and it will help you to stay profitable and consistent it send mt5 and mobile notification alert right on time all signals are non repaint and no lag

Introducing the Adaptive Trend Finder , a cutting-edge Forex indicator that automatically identifies and draws trend lines with pinpoint accuracy. Designed to adapt to changing market conditions, this powerful tool helps traders uncover the most significant trends, enabling them to capitalize on emerging opportunities and confirm the strength of ongoing market movements. The Adaptive Trend Finder uses advanced algorithms to scan the market for pivotal price points, dynamically adjusting trend li
FREE

インディケータはチャート上にトレンドラインを描画します。このインジケーターには6つの入力があります。ユーザーは両方の行に代替ラベルを指定できます。インジケーターの複数のインスタンスが使用される場合、ラベルは異なっている必要があります。ユーザーは、線の幅と色、および使用する重要なピークを指定する深さを設定できます。たとえば、Depth = 10は、現在の山と谷を使用してトレンドラインを設定します。この山と谷は、左右に少なくとも10本のバーがあり、高/低がピークの高/低よりも小さい/大きいです。インジケーターは、以前の山と谷もペイントします。インジケーターには、価格がサポート/レジスタンスラインから事前に設定された距離にあるときにユーザーに通知するために使用できるアラート機能が追加されています。アラート距離はピップで設定されます。
FREE

TRUE ANTI SPIKES DERIV
Find the user manual here, as well as settings fro boom 1000, crash 500, crash 1000 https://t.me/automated_TLabs DM: https://t.me/gg4rex
Professional Reversal Detection Indicator Advanced Multi-Timeframe Reversal Detection System for Boom & Crash Indices
Download product user manual here:
WHAT IS TRUE ANTI-SPIKES? True Anti-Spikes is a precision-engineered reversal detection indicator specifically designed for Boom and Crash synthetic indices. Unlike trend-follo
FREE

Was: $69 Now: $49 Blahtech VWAP - Volume Weighted Average Price (VWAP) is the ratio of price to total volume. It provides an average price over a specified time interval. Links [ Install | Update | Documentation ] Feature Highlights
Configurable VWAP Line Sessions, intervals, anchored or continuous Previous day settlement line Standard Deviation bands Alerts at bar close or real time Automatic Broker or Tick volumes Significantly reduced CPU usage
Input Parameters
Expert Advisor Mo
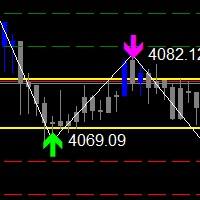
The Zigzag Price Arrow indicator is an enhanced version of the classic Zigzag indicator, combining the traditional zigzag pattern with advanced visual features. It not only identifies major market turning points but also provides clear trading signals through: • Directional arrows: Displays colored arrows (green for buy, magenta for sell) indicating potential trend directions.
• Price labels: Shows the exact price values at each pivot point directly on the chart.
• Improved visual clarity: Make
FREE

Setup Tabajaraは、「ウォール街の鬼」として知られるブラジルのトレーダーによって作成されました。
この設定のアイデアは、トレーダーに価格の現在の傾向とグラフで探す必要のある操作のタイプを示すことです。
手術 これは、ろうそくの閉まりとVWAPを午前10時40分まで配置し、その後20期間の算術平均で、ろうそくを4つの可能な色でペイントすることによって行われます。 緑->上昇傾向の価格上昇(購入のエントリポイントを検索) 黒->強気トレンドでの価格修正(購入のためのエントリーポイントの検索) 赤->価格が下落傾向にある(販売用のエントリポイントを検索) 白->下降トレンドでの価格修正(販売のエントリポイントを検索) さらに、次のインジケーターもスクリプトに追加しました。 8期間の指数平均:短期的な価格変動を特定するため 50期間の算術平均:中期的な価格変動を特定する 80期間の指数平均:中期的な価格変動を特定する 200期間の算術平均:長期的な価格変動を特定する
それでも質問がある場合は、ダイレクトメッセージで私に連絡してください: https://www.mql5.c
FREE

What is Double Top and Bottom Double top and bottom patterns are chart patterns that occur when the underlying investment moves in a similar pattern to the letter "W" (double bottom) or "M" (double top). Double top and bottom analysis is used in technical analysis to explain movements in a security or other investment, and can be used as part of a trading strategy to exploit recurring patterns. you can fin MT4 version hier
Indicator shows you 2 Level target and stop loss level. Stoploss level

THE PREDICTOR: Advanced Machine Learning & ICT Powerhouse Transform your trading from guesswork to data-driven precision. The Predictor is not just another indicator; it is a sophisticated market analysis engine that combines Pattern Recognition AI with the institutional power of ICT (Inner Circle Trader) strategies. Designed for professional traders who demand high-accuracy signals for Forex, Boom/Crash, and Volatility Indices. Why Choose "The Predictor"? Unlike lagging indicators, T

The indicator identifies when a divergence occurs between price and an indicator or oscillator. It identifies both regular and hidden divergences. Combined with your own rules and techniques, this indicator will allow you to create (or enhance) your own powerful system. For higher probability setups I can recommend you to use my Supply Demand indicator and trade only if the divergence occurs inside a zone. Supply zone for bearish div and demand zone for bullish div. The optimal scenario is if it
FREE

MT4 version | Owl Smart Levels Indicator | Owl Smart Levels戦略 | FAQ
Fractals Indicator は、著者のビル ウィリアムズのトレーディング戦略の要素の 1 つです。 価格チャートで価格反転ポイントを検索し、その結果、サポートとレジスタンスのレベルを検索するために使用されます。 Full Fractals Indicator は改良された Fractals であり、ほぼすべての取引端末のツールキットで利用できます。 唯一の違いは、フラクタルを構築するために、メインのローソク足の左に 5 本、右に 2 本のローソク足を使用することです (図 1 を参照)。 基本的な構造に加えて、Full Fractals は価格がしばらく止まっているレベルを探します。 Telegram チャット: @it_trader_chat 新しい Expert Advisor Prop Master - 取引ターミナルでテストしてください https://www.mql5.com/ja/market/pr
FREE

このダッシュボードは、選択されたシンボルの最新の利用可能なハーモニックパターンを表示するので、時間を節約し、より効率的に / MT4バージョン 。
無料インジケーター: Basic Harmonic Pattern
インジケーター列 Symbol : 選択したシンボルが表示されます。 Trend : 強気または弱気 Pattern : パターンの種類(ガートレー、バタフライ、バット、カニ、サメ、サイファー、ABCD) Entry : エントリー価格 SL: ストップロス価格 TP1: 1回目の利食い価格 TP2: 2回目の利食い価格 TP3: 3回目の利食い価格 Current price : 現在値 Age (in bars): 最後に描画されたパターンの年齢
主な入力項目 Symbols: "28 Major Currency Pairs "または "Selected Symbols "から選択。 Selected Symbols: カンマで区切られた監視したいシンボル("EURUSD,GBPUSD,XAUUSD")。ブローカーがペアに接
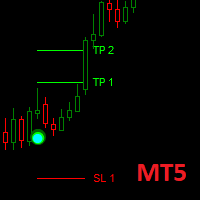
Dark Point is an Indicator for intraday trading. This Indicator is based on Trend Following strategy, also adopting the use of the atr to determine the right volatility. We can enter in good price with this Indicator, in order to follow the strong trend on the current instrument. If you love Dark Point, consider adding some power: Dark Power
Key benefits
Easily visible take profit/stop loss lines Intuitive directional points/arrows by colors Useful statistics , which indicate the wi
FREE

Bill Williams Advanced is designed for automatic chart analysis using Bill Williams' "Profitunity" system. The indicator analyzes four timeframes at once.
Manual (Be sure to read before purchasing)
Advantages
1. Analyzes the chart using Bill Williams' "Profitunity" system. Signals are displayed in a table in the corner of the screen and on the price chart. 2. Finds all known AO and AC signals, as well as zone signals. Equipped with a trend filter based on the Alligator. 3. Finds "Divergence Bar

Haven Stop Loss Hunter Indicator
重要なレベルを分析するための正確なツールです。価格のダイナミクスをより深く理解し、取引の意思決定を改善しようと努めるトレーダーのために開発されました。
他の製品 -> はこちら 主な機能: 重要な価格の極値を迅速に見つけるのに役立ちます。
潜在的なブレイクアウト(スイープ)レベルの識別
価格がレベルを突破しようとするが、それを実行できない瞬間を検出し、潜在的な反転またはトレンドの継続を知らせます。 重要な価格ポイントの視覚的表示
市場構造の分析を簡素化し、目に見えるデータに基づいて意思決定を行うのに役立ちます。 このインジケーターは、価格が重要なレベルをテストしているが、それを突破しない状況を特定するのに理想的です。これはトレーダーにとって重要なシグナルです。 設定の柔軟性 により、個々の取引戦略に合わせてツールを調整し、選択した任意の金融商品で使用できます。
FREE
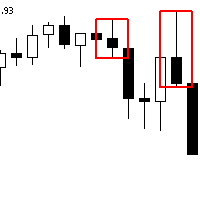
The Advanced Order Block Indicator for MetaTrader 5 is designed to enhance technical analysis by identifying significant order blocks that sweep liquidity and create Fair Value Gaps (FVG) when pushing away. This indicator is ideal for traders who focus on institutional trading concepts and wish to incorporate advanced order flow and price action strategies into their trading routine. Overview Order Block Identification : An order block represents a price area where a substantial number of orders
FREE
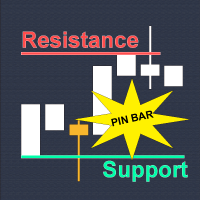
Why Technical Indicators Don't Work?
Many traders lose money because of lagging indicator crossovers and fake breakouts. Indicators are rearview mirrors. They're all just pretty math equations of PAST data. Would you drive forward while staring at your rearview mirror? Absolutely NO. The "Holy Grail" indicator doesn't exist. Price Action Decoding: How Smart Money REALLY Trades?
The market don't care about your indicators, analyze price action instead, e.g. the principles of ICT, SMC, and other
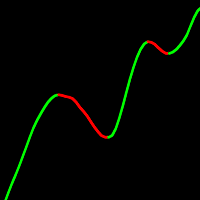
巨大なカスタマイズオプションを持つ移動平均。 スムージングの10種類。 構築するための12の価格オプション。 結果として生じる移動の離散化の可能性。 クイックコード。 制限なしに専門家で使用する能力。 UniversalMA指標は、現代の取引で使用される最も一般的な建設方法を組み合わせたものです。 したがって、多くの異なる指標を持つ必要はもはやありません。 指標ベースのエキスパートアドバイザー 移動平均は、設定された期間にわたる商品の平均価格を表示する価格ベースの遅れ指標です。 基本的に、移動平均は、チャートを解釈しようとすると、"ノイズ"を滑らかにします。 移動平均は、勢いを評価するだけでなく、傾向を確認し、サポートと抵抗の領域を特定するための良い方法です。 移動平均を使用する方法の巨大な様々ながあります。 以下は、最も一般的な使用方法の例です:移動平均の方向(この方法を使用する主なルールは、移動平均の一般的な方向を追跡することです:それは市場 この動きの方向にのみ取引を行う価値があります。 このような単純なルールは、移動平均法を短期予測のための便利なツールにします)、価格チャートで
FREE

特別オファー : ALL TOOLS 、各 $35 ! 新しいツール は 最初の1週間 または 最初の3件の購入 について $30 です! MQL5 の Trading Tools チャンネル :最新情報を受け取るために私の MQL5 チャンネルに参加してください 本インジケーターは、“Smart Breakout Channels” と呼ばれるブレイクアウト検出ゾーンを描画します。これはボラティリティで正規化された価格の動きに基づいています。これらのゾーンは出来高オーバーレイを備えた動的なボックスとして表示されます。本ツールは、カスタムの正規化ボラティリティ計算を用いて一時的な蓄積または分配レンジを検出し、価格がそのレンジを上方または下方に抜けた瞬間をマークします。各チャネルは構造化されたレンジを表し、出来高デルタ、上昇/下降出来高、そしてモメンタムバイアスを示すグラデーションのビジュアルゲージによる追加コンテキストを提供します。 MT5 版はこちら: Smart Breakout Channels MT5 Scanner
MT4 版はこちら: S

A lot of professional traders use high quality divergence signals as a part of their strategy to enter a position. Spotting correct divergences quickly can often be hard, especially if your eye isn’t trained for it yet. For this reason we’ve created a series of easy to use professional oscillator divergence indicators that are very customisable so you get only the signals you want to trade. We have this divergence indicator for RSI, MACD, Stochastics, CCI and OBV. RSI: https://www.mql5.com/en/
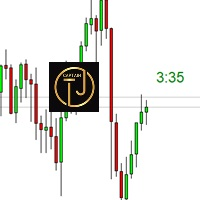
The CTJM Candle Timer Indicator is a robust tool developed for traders who use MetaTrader 5. Designed with precision, it displays the remaining time for the current candle on a trading chart, enabling traders to monitor the market more effectively and make timely decisions. With a customizable visual interface, users can adjust colors, font sizes, and positioning to suit their preferences. Some key features of this indicator include: Real-Time Candle Countdown: Keeps traders informed of the exa
FREE

Position Size Calculator Lite MT5 – 無料リスク管理インジケーター 重要事項 チャート上でのマウス操作(ドラッグ&ドロップ)によるインタラクティブなストップロス/テイクプロフィット設定、証拠金計算、ブレイクイーブン、詳細なリスク指標を備えたアドバンスド・パネルが必要な場合は、マーケットで Position Size Calculator PRO MT5 を検索してください。このLiteバージョンは、ポジションサイズ計算に特化した無料の簡易版です。 概要 Position Size Calculator Lite MT5 は、以下の要素から推奨ロット数を計算する無料のインジケーターです: 口座残高に対するリスクパーセンテージ ATR(平均真の範囲)に基づいたストップロス 目標リスク報酬比(RR比) インジケーターは、推定リスク、計算されたロット数、および予測されるストップロス・テイクプロフィット価格を軽量なパネルでチャート上に表示します。ボタン一つでBUY(買い)とSELL(売り)を素早く切り替えることができます。 主な機能 (Liteバージョン) 口座
FREE

* 主要通貨のデータの信頼性を確保するため、ライブチャートのご利用を推奨いたします。
UEX Pure USD Euro Index とは: 英語での説明: https://www.mql5.com/en/market/product/152936
Pure USD & Euro Indexで、外国為替市場の真の脈動を探りましょう。 — 世界で最も強力な2つの通貨間の隠れた強みと弱みを真に明らかにする革新的なインジケーターです。
EURUSDのような単一の通貨ペアに頼るのではなく、このツールは複数の主要通貨ペアにわたる米ドルとユーロの総合的なパフォーマンスを測定し、 真の市場センチメントを明確かつバランスよく把握します。
このインジケーターは、すべての主要USDおよびEuroペアのデータを組み合わせることで、 真の通貨変動を反映した同期インデックスチャートを構築します。 単一の通貨ペアの変動だけでなく、真の通貨変動を反映します。 ドルが優勢になった時、ユーロが反落した時、即座に通知を受け取り、 市場が反応する数分前に、両者のバランスが変化する局面を洞察できます。 このコンセ

ボリューム&流動性ハンター - スキャルピング は、複数の時間軸にわたるリアルタイムのボリューム急増や流動性ゾーンを追跡するために設計されたプロフェッショナルグレードのスキャルピング用インジケーターです。
このインジケーターは「スマートマネー(賢い資金)」のコンセプトとリアルタイムの市場状況を組み合わせており、正確なスキャルピング取引に最適なツールです。リバーサル(反転)、ブレイクアウト(突破)、またはフェアバリューギャップ(FVG)のいずれで取引している場合でも、このインジケーターは、実際の買いと売りの圧力が集中している場所を特定するのに役立ちます。 リアルタイム・ボリューム検出
ティックボリュームの急騰を追跡し、最近の履歴と比較して市場の異常な動きを強調表示します。 流動性ゾーンの識別
自動的にフェアバリューギャップ(FVG)や潜在的なオーダーブロックを検出します。価格が反応する可能性のあるゾーンを強調表示します。 M5〜H4までのマルチタイムフレーム分析、任意のタイムフレームを非表示にすることも可能
チャート上に明確なバーとボックスを直接表示します。邪魔にならず、カスタマ
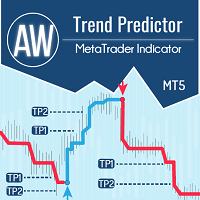
1 つのシステムでのトレンド レベルとブレイクダウン レベルの組み合わせ。高度なインジケーター アルゴリズムは、市場のノイズをフィルター処理し、トレンド、エントリー ポイント、および可能なエグジット レベルを決定します。インジケーターシグナルは統計モジュールに記録されるため、最適なツールを選択してシグナル履歴の有効性を示すことができます。この指標は、テイクプロフィットとストップロスのマークを計算します。 マニュアルと説明書 -> ここ / MT4 バージョン -> ここ インジケーターで取引する方法: Trend Predictor での取引は、たった 3 つの簡単なステップです。 ステップ 1 - ポジションを開く 70% 以上の成功率で買いシグナルが受信されました ステップ 2 - ストップロスの決定 逆信号でトランクを選択 ステップ 3 - テイクプロフィット戦略の定義 戦略 1: TP1 に到達したらポジション全体をクローズする 戦略 2: TP1 に達した時点でポジションの 50% をクローズし、TP2 に達した時点で残りの 50% をクローズします。 戦略 3:

Consolidation Zone Indicator is a powerful tool designed for traders to identify and capitalize on consolidation patterns in the market. This innovative indicator detects consolidation areas and provides timely alerts when the price breaks above or below these zones, enabling traders to make informed trading decisions. MT4 Version : https://www.mql5.com/en/market/product/118734 Join To Learn Market Depth - https://www.mql5.com/en/channels/suvashishfx
Key Features:
1. Consolidation Det
FREE

Crystal Quantum Flow
高度なマーケット・インテリジェンス・インジケーター Crystal Quantum Flow は、明確さ、精度、そして機関投資家レベルの市場洞察を求めるトレーダーのために設計された、次世代のプロフェッショナル・トレーディング・インジケーターです。
本インジケーターは、マルチ次元のマーケットフロー分析、時間足の同期インテリジェンス、高度なビジュアル解釈を一つの強力なチャート環境に統合した、完全な意思決定支援システムとして構築されています。 Crystal Quantum Flow の内部アーキテクチャは完全に独自設計であり、保護されています。
すべての分析モデルはクローズドシステムとして動作し、一般的なリテール向けインジケーターや公開された数式には基づいていません。 コアコンセプト Crystal Quantum Flow は、市場の動きを単なる個別の価格変動としてではなく、圧力、モメンタム、方向性の優位性が連続的に流れるプロセスとして解釈するよう設計されています。
市場ノイズに反応するのではなく、確定した市場状態とその転換に焦点を当て、トレー
FREE
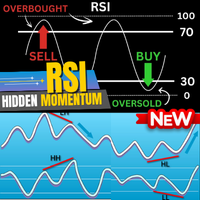
The Real RSI – プロフェッショナル・ダイバージェンス・ハンター 概要 The Real RSI は、RSI に基づく反転およびトレンド継続シグナルを高精度に検出するために設計された、プロフェッショナル向けのダイバージェンス検出インジケーターです。
価格と RSI の間に生じる 通常のダイバージェンス および 隠れたダイバージェンス を自動的に検出し、スマートなピボットロジックとリアルタイム構造検証によって各セットアップを確認します。
このインジケーターは、精度・安定性・実用性を重視して開発されており、実際の市場環境で 再描画せず遅延もない 動作を実現しています。 これらのダイバージェンスシグナルを自動取引で活用したい場合は、以下のEAを使用できます:
The Real RSI BOT – Auto Divergence Trading EA 主な機能 1. 自動ダイバージェンス検出 • 通常および隠れたダイバージェンスを自動検出(強気・弱気両対応)。
• Forex、Gold、Indices、Crypto など、すべての銘柄・時間足に対応。
• 反転型およびトレンド継続型
FREE

- Real price is 200$ - 50% Discount (It is 99$ now) - It is enabled for 4 purchases. Contact me for extra bonus (Gann Trend indicator), instruction or any questions! - Non-repaint, No lag - I just sell my products in Elif Kaya Profile, any other websites are stolen old versions, So no any new updates or support. - Lifetime update free Gann Gold EA MT5 Introduction W.D. Gann’s theories in technical analysis have fascinated traders for decades. It offers a unique approach beyond traditional cha

note: this indicator is for METATRADER4, if you want the version for METATRADER5 this is the link: https://www.mql5.com/it/market/product/108106 TRENDMAESTRO ver 2.5 TRENDMAESTRO recognizes a new TREND from the start, he never makes mistakes. The certainty of identifying a new TREND is priceless. DESCRIPTION TRENDMAESTRO identifies a new TREND in the bud, this indicator examines the volatility, volumes and momentum to identify the moment in which there is an explosion of one or more of these da

機能
フィボナッチ・リトレースメント・トレーディングのためのインジケータ 1時間、4時間、1日、1週間の前のバーから選択されたバーに基づいてフィボナッチ・チャートが描かれます。 市場価格がフィボナッチ・レベルに触れると、色が変わり、タッチした時間が表示されます。 フィボナッチ・グラフは、-23.6、0、23.6、38.2、50、61.8、76.4、100、123.6のレベルに描かれ、バーが更新されるとチャートがリフレッシュされます。
変数
タイムフレーム:1時間、4時間、1日、1週間から選択されたタイムフレームでフィボナッチ・チャートが描かれます。 FiboWidth:レベルの太さを決定します。 FiboStyle:ピボット・レベルのスタイルを設定します。 TouchedColor:タッチしたときに変わる色です。
エラーがある場合や改善点がある場合はコメントしてください。 評価は開発者にとって大きな助けになります。満足していただける場合は5つ星をお願いいたします。
FREE
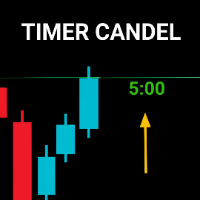
Timer Candle MT5 is a lightweight indicator that displays a countdown timer until the current candlestick closes. This indicator helps visual traders monitor the remaining time before the candle closes, especially on lower timeframes. Key Features: Countdown display in seconds or minute:second format. Text color changes automatically as it approaches the final seconds (warning color). Text is displayed in simulated bold style for better readability. Fully customizable: font type, size, color, a
FREE
特別オファー : ALL TOOLS 、各 $35 ! 新ツール は $30 ( 最初の1週間 または 最初の3回の購入 )です! Trading Tools Channel on MQL5 :最新情報を受け取るため、私の MQL5 チャンネルに参加してください Specter Trend Cloud は移動平均に基づくトレンド可視化ツールで、市場の方向性と主要なリテスト機会を強調表示するよう設計されています。適応型平均にボラティリティ調整を組み合わせ、トレンド変化に応じて反転するカラー「クラウド」を生成し、進行中のトレンド下で価格が短期平均とどのように相互作用するかを追跡します。
MT5 版の詳細はこちら: Specter Trend Cloud MT5 Scanner MT4 版の詳細はこちら: Specter Trend Cloud MT4 Scanner その他の製品はこちら: All P roducts Key Features マルチ MA コアエンジン
SMA、EMA、SMMA (RMA)、WMA、VWMA から選択可能。短期 MA

Spike Trap is a simple but powerful tool that identifies sharp market spikes and waits for price pullbacks to highlight high-probability entry and exit zones. By combining volatility detection with smart retracement logic, it helps traders capitalize on fast price moves with precision and reduced risk. Ideal for scalping or short-term trading in volatile markets. Spike Trap can be used to trade synthetic indices such as Boom and Crash offered by Deriv Broker as well as Pain and Gain indices offe

A tool for on-chart strategy backtesting and performance analysis.
A utility for developing, debugging, and testing custom trading ideas and indicator functions.
An indicator designed to quickly test trading concepts and visualize the effectiveness of different input parameters.
An all-in-one sandbox for testing everything from simple crossovers to complex, multi-condition trading systems.

このインジケーターは、チャート上に需要と供給のゾーンを描画します。独自のルールやテクニックと組み合わせることで、このインジケーターを使用して独自の強力なシステムを作成 (または強化) できます。さらに多くの機能を提供する 有料版 もぜひご確認ください。私の推奨は、少なくとも 25 バー後に最初のゾーン テストが発生する取引機会を探すことです。 特徴 ゾーンには 3 つの色があります (入力によって調整可能)。テストされていないゾーンは暗い色、テスト済みのゾーンは中くらいの色 、壊れたゾーンは明るい色です 。 各ゾーンにはゾーン外枠の価格とゾーンテストの金額が記載されています。 入力パラメータ 最初の極値を検索するための最大バックバー数 - デフォルトは 3000 です。最初の極値を xx バー分遡って検索します。値が大きいほど、より多くのシステム リソースが必要になります 。遅いコンピューターの場合は、500 ~ 1000 の値が適している場合があります。 ゾーンテスト間のキャンドルの最小数 未テストの需要色 テスト済みの需要色 壊れた需要の色 未テスト供給色 テスト済みの供給
FREE
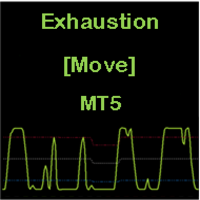
CONSTITUTION Exhaustion [Move] is an indicator consisting of an oscillator and three dynamic levels (upper, middler, lower). The inputs can be used to adjust the oscillator, dynamic levels and warning signals. It is designed for the MT5 platform only. APPLICATION This indicator should be used with a trend filter [e.g. moving averages, MA 200]. It detects the exhaustion of correction movements within a trend, thus giving entry points for new trades. It is usually used in the RENKO chart for SCA

INTRODUCTION The Fib Autotrendline is a basic tool that analysts use to find out when a security's trend is reversing. By determining the support and resistance areas , it helps to identify significant changes in price while filtering out short-term fluctuations, thus eliminating the noise of everyday market conditions. It is an excellent tool for any trader who follows indicators that use swing highs and swing lows . How to Use the fib Auto Trendline Indicator The Fib Auto Trendline

Auto Fibo は、手動での取引を強化するために開発されたインジケーターです。自動で黄金比を描き、時間を節約し、取引を円滑にします。 グラフにインジケータを取り付けると、自動的に正確な黄金比が描かれるので、臨界点を探す手間が省けます。 インターフェイスは、お使いのコンピュータに応じて、バンドのおおよそのハイポイントとローポイントに調整されます。 このインジケータは、ほとんどの始点と終点の選択ミスを修正します。 各バンドには、正確な価格が表示されます。 警告 私はMQL5.comで私のEAを販売するだけです。もし誰かが私のEAを売ってくれと連絡してきたら、それはあなたのお金が欲しいだけの詐欺師です。
また、もしあなたが私のEAを外部のウェブサイトから購入した場合、それは偽のバージョンであり、オリジナルのものと同じようには動作しないことを保証します。
FREE

KT Momentum Arrows インジケーターは、一方向への急激なボラティリティとバンドの乖離に基づいて計算される、瞬間的なブレイクアウトを検出するツールです。動きの強さとタイミングを捉えることに特化しており、モメンタムトレードに最適です。 価格が上部バンドを上抜けして終値が確定したときに買いシグナルが、下部バンドを下抜けしたときに売りシグナルが発生します。 バンドの広がりとボラティリティの両方に影響を与える「係数(Magnitude Coefficient)」が入力として用いられます。通貨ペアや時間軸に応じて最適な値を選定し、分析することが推奨されます。
主な特徴
リペイントなし! モメンタムトレーダーにとって優れたエントリーツール。 勝率、平均利益、勝ち/負けなどのパフォーマンス分析機能付き。 デイトレード、スイングトレード、スキャルピングに対応。
入力パラメーター 履歴バー数: インジケーター計算に使用するローソク足の数。 マグニチュード係数: バンドの拡張とボラティリティ計測に使う単一の係数。 パフォーマンス分析: 利益傾向のラインを含む分析を表示/非表示に切

** NOTE: This indicator uses realtime data. Thus DO NOT download Demo version. If you still need demo version, please refer to trial version .
Symbol Chart Changer is an indicator/utility that offers you the option to switch between symbols and timeframes.
You can choose any symbol and timeframe on the same chart with just a few clicks. In addition, this indicator also shows the profit of the symbol through the color of the buttons.
Features: Click buttons on the chart to monitor all your f

初心者やエキスパートトレーダーに最適なソリューション!
このインジケーターは、独自の機能と新しい計算式を取り入れた、ユニークで高品質、かつ手頃な価格のトレーディングツールです。たった1枚のチャートで28の為替ペアの通貨強度を読み取ることができます。新しいトレンドやスキャルピングチャンスの引き金となるポイントを正確に特定することができるので、あなたのトレードがどのように改善されるか想像してみてください。
ユーザーマニュアルはこちら https://www.mql5.com/en/blogs/post/697384
これが最初の1本、オリジナルだ! 価値のないクローンを買わないでください。
特別な サブウィンドウの矢印で強い通貨の勢いを表示 GAPがあなたのトレードを導く! 基準通貨や気配値が売られすぎ・買われすぎのゾーン(外相フィボナッチレベル)にあるとき、個別チャートのメインウィンドウに警告表示。 通貨がレンジの外側から反落した場合、プルバック/リバーサルのアラート。 クロスパターンの特別なアラート
複数の時間枠を選択可能で、トレンドを素早く確認できます。通貨強度のライン
The SyntheticaFX Pain & Gain Spike Indicator is a specialized tool designed to identify potential spike opportunities in the market, exclusively for traders focusing on Weltrade Pain and Gain pairs. This indicator is optimized to operate on the 1-minute (M1), 2-minute (M2), 3-minute (M3), and 5-minute (M5) timeframes and supports only the following pairs: PainX 1200, PainX 999, PainX 800, PainX 600, PainX 400, GainX 1200, GainX 999, GainX 800, GainX 600, and GainX 400. It will not display signal
Special offer : ALL TOOLS , just $35 each! New tools will be $30 for the first week or the first 3 purchases ! Trading Tools Channel on MQL5 : Join my MQL5 channel to update the latest news from me ボリュメトリックオーダーブロック多時間枠 インジケーターは、主要な市場参加者が注文を蓄積する重要な価格エリアを特定することで、より深い市場の洞察を求めるトレーダー向けに設計された強力なツールです。これらのエリアはボリュメトリックオーダーブロックとして知られており、サポートやレジスタンスの潜在的ゾーンとして機能し、取引の意思決定において重要な優位性を提供します。 MT4バージョンを見る: Volumetric Order Blocks MT4 Multi Timeframe See more products at: https://www.mql5.com/en

The Supertrend indicator was originally created by a french fellow named Olivier Seban , and its goal is to identify the Primary Trend of prices . Its calculation is easy and based on the average of Highs and Lows and then we add the volatility of a custom period, plus a multiplier. This way we get the Supertrend Line. You can find in the web several approaches and trading strategies using this very useful indicator.
HOW TO "READ" THIS INDICATOR
If the closing prices are above Supertrend Line,
FREE

The market price usually falls between the borders of the channel .
If the price is out of range, it is a trading signal or trading opportunity.
Basically, Fit Channel can be used to help determine overbought and oversold conditions in the market. When the market price is close to the upper limit, the market is considered overbought (sell zone). Conversely, when the market price is close to the bottom range, the market is considered oversold (buy zone).
However, the research can be used to

RSI Entry Points is the upgrade of the standard RSI indicator to avoid lagging. Indicator draws the clouds and the arrows to have clear picture where price is and what to wait for. Why standard RSI is lagging? because mostly we do not use it correctly and it is with very weak visual flexibility, less informativity. With my current upgrade I tried to Fix both problems same time and I got much better results and more exact entries than standard RSI has. To make yourself sure check out the screens

RSI v SMA MTF Indicator : Professional Trading Edge in One Tool Summary The RSI v SMA MTF Indicator is a sophisticated, multi-timeframe momentum analysis tool that transforms the traditional RSI into a powerful, actionable trading system. By combining RSI slope analysis with SMA crossover signals, divergence detection, and real-time multi-timeframe confluence, this indicator provides traders with a more comprehensive view of market momentum across all relevant timeframes. Core Utility an
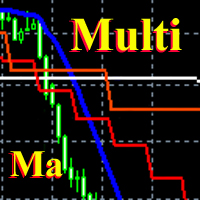
This is the same Ma Multi indicator that was previously available only for Mt4 . Now there is a version for Mt5 . It belongs to a whole family of multi-frame indicators, implementing the idea of displaying different timeframes in a single time scale. Horizontal fixation the scale allows one glance to get the big picture and provides additional opportunities for technical analysis. The indicator is tested on Just2trade Indicator parameters: MA_Period - averaging period of the moving av

The indicator implements the author's approach to the construction of the popular "Zig-Zag" indicator.
The advantages of the "ZIgZag Level" indicator is that it filters out market noise and shows levels.
"ZIg Zag Level" is based on peaks and troughs, displays levels.
These levels can be disabled and configured.
The indicator displays the price of the level, the price tag can be disabled.
The "zigzag" line between the points can also be disabled.
The indicator has a built-in notification s

Also check my premium spikes bot: https://www.mql5.com/en/market/product/142350 Also check my premium spikes bot: https://www.mql5.com/en/market/product/142350 Also check my premium spikes bot: https://www.mql5.com/en/market/product/142350 MEGASPIKES BOOM AND CRASH v1.32 NB: source codes of this indicator are available: PM me: https://t.me/Machofx PLEASE JOIN THE CHANNEL BELOW TO HAVE ACCESS TO ALL PREVIOUS VERSIONS check out Spikes robot
BoomCrash Cheatcode EA : https://www.mql5.com/en/ma
FREE

ADR反転インジケーターは、通常の1日の平均レンジに関連して価格が現在取引されている場所を一目で示します。価格が選択した平均範囲とレベルを超えると、ポップアップ、電子メール、またはプッシュを介して即座にアラートを受け取るため、プルバックと逆転にすばやくジャンプできます。インディケータは、チャート上に1日の平均レンジの極値で水平線を描画し、それらを超える価格の数学的確率が付加されているレベルを超える延長も描画します。詳細については、以下をご覧ください... インジケーターとモニターを補完するADRアラートダッシュボードここでも利用可能なすべてのペア:https:// www.mql5.com/en/market/product/66316
MT4バージョンはこちらからも入手できます:https:// www.mql5.com/en/market/product/62757
通常の1日平均レンジ(ADR)内で価格が取引され、これらのレベルを上回っている時間の約60%は、通常、その後の引き戻し(利益確定)の動きを伴う急激な価格の動きの指標です。毎日の範囲の上部または下部からのプルバック

The indicator analyzes the volume scale and splits it into two components - seller volumes and buyer volumes, and also calculates the delta and cumulative delta. The indicator does not flicker or redraw, its calculation and plotting are performed fairly quickly, while using the data from the smaller (relative to the current) periods. The indicator operation modes can be switched using the Mode input variable: Buy - display only the buyer volumes. Sell - display only the seller volumes. BuySell -
FREE
MetaTraderマーケットは自動売買ロボットとテクニカル指標を販売するための最もいい場所です。
魅力的なデザインと説明を備えたMetaTraderプラットフォーム用アプリを開発するだけでいいのです。マーケットでプロダクトをパブリッシュして何百万ものMetaTraderユーザーに提供する方法をご覧ください。
取引の機会を逃しています。
- 無料取引アプリ
- 8千を超えるシグナルをコピー
- 金融ニュースで金融マーケットを探索
新規登録
ログイン