MetaTrader 5용 기술 지표 - 4

Fractal Model Indicator for Metatrader , meticulously crafted around the renowned Fractal Model by TTrades. This powerful tool empowers traders to navigate price action with precision, leveraging multi-timeframe analysis to anticipate momentum shifts, swing formations, and trend continuations. Designed for MetaTrader , the Fractal Model Indicator combines advanced algorithmic insights with customizable features, making it an essential addition for traders seeking to capitalize on expansive mar

The "Power of Three" (PO3) is a concept developed by the Inner Circle Trader (ICT) to illustrate a three-stage approach used by smart money in the markets: Accumulation, Manipulation, and Distribution . ICT traders view this as a foundational pattern that can explain the formation of any candle on a price chart. In simple terms, this concept is effective for any time frame, as long as there's a defined start, highest point, lowest point, and end. MT4 - https://www.mql5.com/en/market/product/1
FREE
촛불이 끝날 때까지의 시간 표시기. 촛불이 끝날 때까지의 시간과 서버 시간을 표시합니다. 텍스트는 캔들의 추세 또는 방향을 표시할 수 있으며 소리 알림이 내장되어 있습니다. 특징:
필요한 경우 조정하거나 비활성화할 수 있는 다른 시간 프레임뿐만 아니라 현재 캔들이 끝날 때까지의 시간을 표시합니다. AW 캔들 타임은 AW Super Trend 지표로 현재 캔들 또는 추세의 방향을 선택할 수 있습니다. 추세 전략은 선택한 색상으로 강조 표시됩니다. 내장형 소리 알림 및 캔들 교체 전 시간 추가 컬러링 디스플레이는 현재 가격 옆이나 차트의 모든 모서리에 구성할 수 있으며 입력 설정에서 유연하게 조정할 수 있습니다. Instruction -> 여기 / 더 많은 제품 -> 여기 입력 변수:
기본 Candle_Time_Location - 캔들 타임스탬프의 위치입니다. 차트의 모서리 또는 현재 가격 옆에 위치할 수 있습니다. Trend_Strategy - 컬러 캔들 타임스탬프를 사용합니다
FREE

RelicusRoad Pro: 퀀트 시장 운영 체제 70% 할인 평생 이용권 (한정 시간) - 2,000명 이상의 트레이더와 함께하세요 왜 대부분의 트레이더는 "완벽한" 지표를 가지고도 실패할까요? 진공 상태에서 단일 개념 만으로 거래하기 때문입니다. 문맥 없는 신호는 도박입니다. 지속적인 승리를 위해서는 컨플루언스(중첩) 가 필요합니다. RelicusRoad Pro는 단순한 화살표 지표가 아닙니다. 완전한 퀀트 시장 생태계 입니다. 독점적인 변동성 모델링을 사용하여 가격이 이동하는 "공정 가치 로드"를 매핑하고, 단순 노이즈와 실제 구조적 돌파를 구분합니다. 추측은 그만두세요. 기관급 로드 로직으로 거래를 시작하세요. 핵심 엔진: "Road" 알고리즘 시스템의 중심에는 시장 상황에 실시간으로 적응하는 동적 변동성 채널인 Road Algo 가 있습니다. 세이프 라인(평형) 과 가격이 수학적으로 반전될 가능성이 높은 확장 레벨 을 투영합니다. Simple Road: 일반적인 시장을 위

The indicator returning pivot point based trendlines with highlighted breakouts . Trendline caculated by pivot point and other clue are ATR, Stdev. The indicator also includes integrated alerts for trendlines breakouts and foward message to Telegram channel or group if you want. Settings · Lookback bar: Default 200 is number of bar caculate when init indicator. · Length: Pivot points period · Slope Calculation Method: Determines how this lope is calculated. We supp
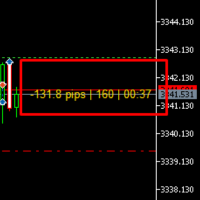
Ultimate Trading Companion Indicator for MT5
Hi there!
This intelligent and easy-to-use indicator is designed to give you a clear edge in the market. It shows: Live Pips of Open Trades – Instantly see how much you're gaining or losing in pips. Candle Countdown Timer – Know exactly when the current candle will close. Real-Time Spread Display – Stay aware of market conditions and avoid bad entries. Fully Customizable Colors – Choose your own Profit, Loss, and Neutral display colors for a clean a

Description :
VWAP (Volume-Weighted Average Price) is the ratio of the value traded to total volume traded over a particular time horizon. It is a measure of the average price at which pair is traded over the trading horizon. Read More.
All Symbols and All Timeframes are supported.
Indicator Inputs :
VWAP Mode : Mode of VWAP Calculation. Options can be selected : Single,Session,Daily,Weekly,Monthly
Volumes : Real Volumes,Tick Volumes
Price Type : Used price for calculating. O
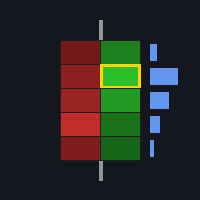
FOOTPRINTORDERFLOW: The Authoritative Guide ( This indicator is also compatible with economic providers that do not offer DOM data and BID/ASK data, It also supports various foreign exchange transactions, DEMO version,modleling must choose " Every tick based on real ticks" ) Important notice: Before placing an order, please contact me first, and I will provide you with professional answers and services
1. Overview FOOTPRINTORDERFLOW is an advanced Order Flow analysis tool designed for MetaTra

Introducing Order Blocks Breaker , a brand-new way to identify and leverage order blocks in your trading strategy. After developing multiple order block tools with unique concepts, I’m proud to present this tool that takes things to the next level. Unlike previous tools, Order Blocks Breaker not only identifies order blocks but also highlights Breaker Order Blocks —key areas where the price is likely to retest after a breakout. MT4 - https://www.mql5.com/en/market/product/124101/ This t

이동 평균 수렴 발산(MACD) 거래 전략은 추세와 흐름 방향의 변화를 식별하는 데 사용되는 인기 있는 기술 분석 도구입니다. MACD는 12기간의 지수 이동 평균(EMA)에서 26기간의 EMA를 빼서 계산됩니다. "신호 선"이라고 불리는 9기간의 EMA는 MACD 위에 표시되어 매수 및 매도 신호를 트리거로 작용합니다. MACD 선이 신호 선 위에 있으면 매수 트렌드로 간주되고, 신호 선 아래에 있으면 매도 트렌드로 간주됩니다. 거래자들은 종종 이 정보를 사용하여 잠재적인 매수 및 매도 기회를 파악합니다. MACD는 다양한 방식으로 사용될 수 있는 다재다능한 지표입니다. 일반적으로 사용되는 몇 가지 방법은 다음과 같습니다. 교차: MACD 선이 신호 선 위로 크로스되면 매수 교차가 발생하고, MACD 선이 신호 선 아래로 크로스되면 매도 교차가 발생합니다. 발산: MACD가 새로운 고점을 형성하면서 기초 자산이 그렇지 않은 경우 매수 발산이 발생하고, MACD가 새로운 저점을 형성
FREE
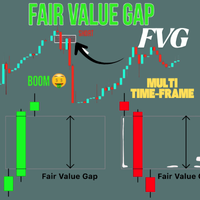
Crystal FVG Touch Detector – 스마트 머니 콘셉트 고급형 인디케이터 Crystal FVG Touch Detector는 Smart Money Concepts(SMC) 및 ICT 전략을 사용하는 트레이더를 위한 전문 지표입니다.
모든 상품 및 시간대에서 FVG(공정 가치 갭)를 자동으로 감지하고 터치 여부를 시각적으로 표시합니다.
비리페인트 구조로 안정적이며 실시간 기관 불균형 구역을 포착합니다. 주요 기능 강세 및 약세 FVG 감지. 실시간 터치 업데이트. 멀티 타임프레임 지원. 컬러 자동 조정. 빠른 속도와 최적화된 구조. 완전한 사용자 설정 지원. 키워드:
FVG, Fair Value Gap, Smart Money Concepts, SMC, ICT, Order Block, 불균형, 유동성, Non Repaint, Volume Spread Analysis, Market Structure, Liquidity Sweep, Forex Indicator, MT5 In
FREE
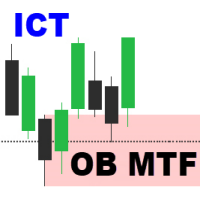
Order Block Multi Timeframe The Order Block Multi Timeframe is a powerful tool for Smart Money Concept (SMC) traders, combining high-accuracy Order Block detection with real-time Break of Structure (BOS) and Change of Character (CHoCH) analysis across multiple timeframes. Smart Money Insight, Multi-Timeframe Precision This indicator automatically identifies institutional Order Blocks —key price zones where large players have entered the market—and plots them directly on your chart. It also track

Improved version of the free HMA Trend indicator (for MetaTrader 4) with statistical analysis. HMA Trend is a trend indicator based on the Hull Moving Average (HMA) with two periods. HMA with a slow period identifies the trend, while HMA with a fast period determines the short-term movements and signals in the trend direction.
The main differences from the free version: Ability to predict the probability of a trend reversal using analysis of history data. Plotting statistical charts for analyzi
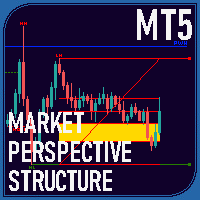
Overview The Market Perspective Structure Indicator is a comprehensive MetaTrader indicator designed to provide traders with a detailed analysis of market structure across multiple timeframes. It identifies and visualizes key price action elements, including swing highs and lows, Break of Structure (BOS), Change of Character (CHOCH), internal structures, equal highs/lows, premium/discount levels, previous levels from higher timeframes, and trading session zones. With extensive customization opt

Super Signal Series – V2 PRO Falcon Real Time Trend Rider Signals – Professional MT4 Dashboard Exclusive FREE Bonus Exclusive Bonus When you purchase this indicator, you receive 2 professional Gold EAs: MT4 Gold EA
XAU Trend Matrix EA – Worth $150 : See the EA https://www.mql5.com/en/market/product/162870 MT5 Gold EA
XAU Steady Gain Pro – Worth $150 : See the EA https://www.mql5.com/en/market/product/162861 Total Bonus Value: $300 Product Description Falcon Trend Rider Signals is a

Korean (한국어) ICT_SuperTrend 는 트레이더가 시장의 전체 흐름을 한눈에 파악할 수 있도록 설계된 "올인원" 도구입니다. 주요 장점은 다음과 같습니다: 하이브리드 트레이딩 시스템 **추세 추종(Trend Following)**과 **스마트 머니 컨셉 / ICT(가격 구조)**의 결합이 가장 큰 장점입니다. SuperTrend: 시장의 주요 방향(매수/매도)을 알려줍니다. ICT 컨셉: 지지/저항선과 같은 구조적 핵심 지점을 식별합니다. 명확한 진입 및 청산 시점 화살표 신호 가 추세 변화를 명확히 알려줍니다. SuperTrend 라인 은 동적 지지/저항 역할을 하며, 수익을 확정하기 위한 **트레일링 스톱(Trailing Stop)**으로 활용하기 좋습니다. 자동 유동성 레벨 탐색 (Liquidity Levels) 주요 **스윙 하이/로우(Swing Highs/Lows)**를 자동으로 스캔합니다. BSL (매수 측 유동성): 상단 저항. SSL (매도 측 유동성):

Unlock hidden profits: accurate divergence trading for all markets Tricky to find and scarce in frequency, divergences are one of the most reliable trading scenarios. This indicator finds and scans for regular and hidden divergences automatically using your favourite oscillator. [ Installation Guide | Update Guide | Troubleshooting | FAQ | All Products ]
Easy to trade
Finds regular and hidden divergences Supports many well known oscillators Implements trading signals based on breakouts Displays

RSI divergence indicator finds divergences between price chart and RSI indicator and informs you with alerts (popup, mobile notification or email). Its main use is to find trend reversals in the chart. Always use the divergence indicators with other technical assets like support resistance zones, candlestick patterns and price action to have a higher possibility to find trend reversals. Three confirmation type for RSI divergences: RSI line cross 50 level Price returns to previous H/L C
FREE

KT Price Border는 세 개의 가격 밴드로 구성된 가격 채널을 생성하여 시장의 잠재적인 고점과 저점을 식별합니다. 이러한 레벨은 동적 지지 및 저항선으로도 사용할 수 있습니다. 중앙 밴드는 트렌드 방향을 식별하는 데에도 사용할 수 있으며, 결과적으로 트렌드 추종형 지표로도 작동합니다. 또한, 사용이 간편하고 직관적인 거래 신호를 제공하여 초보 트레이더에게 큰 도움이 됩니다。
특징
대부분의 외환 통화 쌍에서 효과적으로 작동합니다. 낮은 시간 프레임과 높은 시간 프레임에서 모두 사용 가능합니다. 스캘핑, 데이트레이딩, 스윙 트레이딩에 적합합니다. 트렌드 및 역추세 거래 전략을 모두 지원합니다. 가격이 가격 밴드를 통과할 때 알림을 보낼 수 있습니다. 가격 밴드는 동적 지지 및 저항 수준으로도 활용할 수 있습니다.
가격 경계 개념 이해하기 이 지표는 볼린저 밴드와 유사하게 작동합니다. 하단 밴드는 시장의 과매도 상태를 나타내며 동적 지지 역할을 합니다. 상단 밴드는 시장의
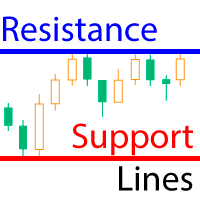
The indicator calculates fractal lines, which are technically psychological support/resistance lines. In fact, these are the highs and lows of the price over a period of time. The indicator works on all charts and timeframes. This free version of the Resistance Support Lines Pro indicator comes as is! Settings: These settings cannot be changed in this version Fractal Candels = 5 - number of candles from which a fractal is built. Calculates the maximum/minimum at which a psychological price can b
FREE

MTF Trend Detector can detect the trend directions on any timeframe with real time sound and Pop-up alert when the trend changes its direction.
It needs a lot of historical data. When it's attached to a chart at the first time, you may need to way 2-3 minutes and refresh the chart to get all the trend directions on the table. It can be used in isolation or as a reliable filter of any trading system.
Input Parameters
Timeframe settings
Enable H1: Select true or false
Enable H2: Select true
FREE

Introducing our exciting new Price Retest indicator! Get instant alerts when the price retests, giving you a powerful edge in your trading strategy. Remember to do your own analysis before making any moves in the market. MT4 Version - https://www.mql5.com/en/market/product/118031 Join To Learn Market Depth - https://www.mql5.com/en/channels/suvashishfx
Here’s a detailed explanation of how the Price Retest indicator works, its components, and how you can incorporate it into your trading strat
FREE

Volume Weighted Average Price (VWAP) The volume weighted average price (VWAP) is a trading benchmark used by traders that gives the average price a security has traded at throughout the day, based on both volume and price. It is important because it provides traders with insight into both the trend and value of a security. This indicator VWAP V2 is free and is the manual version of the extended Easy VWAP indicator (30 Euro), where the date and time properties are automatically entered. With
FREE
Nadaraya Watson Envelope 멀티커런시 스캐너 MT5 는 여러 통화 쌍과 시간 프레임에서 중요한 반전 신호를 모니터링하는 간소화된 방법을 제공합니다. TradingView에서 정확한 반전 신호로 유명한 인기 지표를 기반으로 구축된 이 스캐너는 동일한 핵심 로직을 MT5 호환 형식으로 변환합니다. 낮은 시간 프레임에서의 단기 기회와 높은 시간 프레임에서의 강한 추세 신호에 초점을 맞춰 트레이더가 시장 전환점에 주의를 기울일 수 있도록 돕습니다. MT4 버전은 여기에서 확인할 수 있습니다: Nadaraya Watson Envelope Multicurrency Scanner MT4 자세한 문서는 여기에서 클릭하세요: 문서 주요 기능: 지표 통합: Nadaraya Watson Envelope 지표를 사용하며, 가격 움직임 주변에 부드러운 엔벨로프를 계산합니다. 트레이더는 Length 파라미터를 조정하여 고려할 바의 수를 정의하고, Bandwidth를 조정하여 평활화를 제어하

MinMax Levels – 은 중요한 거래 기간(일, 주, 월)의 최대, 최소 및 시가 수준을 나타내는 지표입니다.
각 Forex 시장 참가자는 거래 시스템에서 레벨을 사용합니다. 이는 거래를 위한 주요 신호일 수도 있고 분석 도구 역할을 하는 추가 신호일 수도 있습니다. 이 지표에서는 대규모 시장 참여자의 주요 거래 기간인 일, 주, 월을 중요한 기간으로 선택했습니다. 아시다시피 가격은 수준에서 수준으로 이동하며 중요한 수준과 관련된 가격 위치에 대한 지식은 거래 결정을 내리는 데 이점을 제공합니다. 편의를 위해 두 레벨 자체를 활성화 및 비활성화하고 버튼을 축소하여 가격 차트 작업 창에서 공간을 확보할 수 있는 버튼이 추가되었습니다.
각 Forex 시장 참가자는 거래 시스템에서 레벨을 사용합니다. 이는 거래를 위한 주요 신호일 수도 있고 분석 도구 역할을 하는 추가 신호일 수도 있습니다. 이 지표에서는 대규모 시장 참여자의 주요 거래 기간인 일, 주, 월을 중요한

Crystal Volume Indicator — Volumenanalyse-Tool für MT5 Überblick
Crystal Volume Indicator ist ein Indikator für MetaTrader 5, mit dem Trader die verborgene Marktdynamik durch Volumenanalyse verstehen können. Er erkennt wichtige Ereignisse wie Kauf-Klimax, Verkaufs-Klimax und schwache Kerzen und erleichtert so die Identifizierung möglicher Umkehr- oder Fortsetzungszonen. Hauptfunktionen Unterstützt Tick Volume und Real Volume (abhängig vom Broker) Farblich codiertes Histogramm zur Volumenklassi
FREE
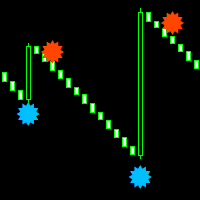
Boom and crash smasher free indicator that works on all timeframe from the one minute to the monthly timeframe. the indicator is 100% non-repaint. the indicator come with sound alerts and email push notification the indicator appears on the current candle stick for faster entries can be used on all charts and renko charts orange dot is your sell signal blue dot is your buy signal
FREE
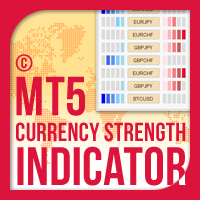
MT5용 통화 강도 지표 는 초보자 또는 전문가 트레이더를 위한 혁신적인 솔루션입니다! 8개 주요 통화의 일반적인 28개 조합을 제외하고 가격 조치와 결합하고 모든 기호/쌍에 적용할 수 있기 때문에 통화 강도 개념을 완전히 새로운 수준으로 끌어 올렸습니다. 즉, 모든 통화, 주요 통화, 마이너 통화 및 외래 통화, 상품 및 암호화폐(인덱스 제외)를 포함하여 모든 통화 쌍의 장단점을 거래할 수 있습니다. 복잡한 스트렝스 라인을 해독하거나 복잡한 스트렝스 라인을 해독할 필요 없이, 어떤 쌍의 2개 부분의 강약 균형을 시각적으로 알려주는 컬러 막대를 사용하여 한 번에 32개의 기호에 대한 명확한 통찰력을 제공하는 진정한 획기적인 제품입니다. 다른 전통적인 통화 강도 솔루션에서와 같이 히스토그램.
MT5용 통화 강도 표 시기는 가장 관심을 갖고 가장 거래하고 싶은 쌍을 추가하여 32개의 기호 버튼을 개인 취향에 맞게 구성할 수 있는 옵션을 제공합니다. 이렇게 하면 한 번의 보기로 차트에

"Haven Key Levels PDH PDL" 인디케이터는 트레이더가 차트에서 핵심 레벨을 시각화하는 데 도움을 줍니다. 다음 레벨을 자동으로 표시합니다: DO (Daily Open) — 일일 시가. NYM (New York Midnight) — 뉴욕 자정 레벨. PDH (Previous Day High) — 전일 고가. PDL (Previous Day Low) — 전일 저가. WO (Weekly Open) — 주간 시가. MO (Monthly Open) — 월간 시가. PWH (Previous Week High) — 전주 고가. PWL (Previous Week Low) — 전주 저가. CMH (Current Month High) — 당월 고가. CML (Current Month Low) — 당월 저가. PMH (Previous Month High) — 전월 고가. PML (Previous Month Low) — 전월 저가. 다른
FREE

The SMC ICT Indicator integrates the key concepts of Smart Money Concepts and Inner Circle Trader into a practical and precise tool.
It displays essential levels and patterns on the chart for clear analysis according to the ICT approach.
Optimized for agile processing, it allows smooth backtesting with no repainting, freezes, or delays—ensuring precision and efficiency in your trading.
Included Concepts It includes Fair Value Gap (FVG), Order Blocks, Imbalance, Gap, Equal High and Equal Low, a
40% off. Original price: $50 (Ends on February 15) Moving Average Trend Scanner is a multi symbol multi timeframe triple MA crossover dashboard that helps traders to monitor, and identify potential market trends from one chart. This panel scans 3 moving averages in up to 28 configurable instruments and 9 timeframes for triple moving average alignment and moving average crossover with a deep scan feature to scan all market watch symbols (up to 1000 instruments!).
Download Demo here (Scans

SuperTrend Alert MT5로 시장 트렌드를 마스터하세요. 이 강력한 인디케이터는 외환, 주식, 암호화폐, 상품 거래를 위한 정확한 트렌드 추종 신호를 제공하도록 설계되었습니다. Forex Factory와 Reddit의 r/Forex와 같은 거래 커뮤니티에서 찬사를 받고 있으며, Investopedia와 TradingView의 논의에서도 견고한 트렌드 탐지 능력으로 호평받고 있어, 신뢰할 수 있는 진입 및 퇴장 지점을 찾는 트레이더에게 필수적인 도구입니다. 사용자들은 SuperTrend 신호를 프라이스 액션과 결합하여 트렌드 방향을 최대 90%의 정확도로 식별하며, 실시간 알림을 활용하여 트렌드 변화를 포착함으로써 거래 타이밍이 25-35% 개선되었다고 보고합니다. 주요 이점에는 고급 트렌드 분석, 맞춤형 설정을 통한 개인화된 전략, 지속적인 차트 모니터링 없이 스캘퍼, 데이 트레이더, 스윙 트레이더의 의사 결정을 향상시키는 경량 디자인이 포함됩니다. SuperTrend A
FREE
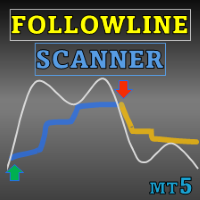
Special offer : ALL TOOLS , just $35 each! New tools will be $30 for the first week or the first 3 purchases ! Trading Tools Channel on MQL5 : Join my MQL5 channel to update the latest news from me Follow Line MT5와 스캐너로 거래에서 앞서 나가세요. 이 고급 변동성 기반 지표는 진지한 트레이더를 위해 설계되었습니다. 이 도구는 Bollinger 밴드의 강력한 기능과 맞춤 설정을 결합하여 가격 움직임에 대한 정확한 통찰력을 제공합니다. See more MT4 version at: Follow Line MT4 with Scanner See more products at: https://www.mql5.com/en/users/ndhsfy/seller Follow Line의 핵심은 가격이 1
FREE
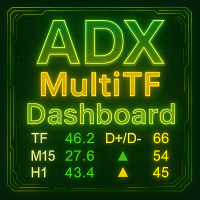
ADX MultiTF Dashboard 개요 ADX MultiTF Dashboard는 선택된 세 개의 시간대에서 추세 강도와 방향에 대한 주요 정보를 동시에 표시하는 다중 시간대 지표입니다. 이 지표는 포괄적인 시장 분석을 위해 ADX 값, 방향성 이동 지표 및 RSI 판독값을 보여주는 컴팩트한 대시보드 형식으로 데이터를 제공합니다. 대시보드는 ADX로 측정된 추세 강도, DI 비교로 결정된 추세 방향, 잠재적 과매수 또는 과매도 상태를 나타내는 RSI 수준을 포함한 거래 결정에 중요한 정보를 제공합니다. 이 모든 정보는 세 개의 시간대에 대해 동시에 표시되므로 트레이더가 다양한 기간에 걸쳐 신호를 확인할 수 있습니다. 주요 기능 다중 시간대 분석 이 지표는 사용자가 선택한 세 개의 시간대에서 시장 상황을 동시에 모니터링합니다. 이를 통해 트레이더는 단기 움직임과 장기 추세를 모두 관찰할 수 있습니다. 일반적인 시간대 조합에는 일중 거래를 위한 M5-M15-H1, 스윙 거래를 위한
FREE

Forex Strategist is a powerful trading sustem for EURPLN H4 Timeframe only. We'll add more logic to trade more currency pairs gradually. Input Parameters:
Line setting:
Line Style: Default is Solid
Buy Color: Default is White
Sell Color: Default is White
Stop Loss Color: Default is White
Target Color: Default is Gold Panel Setting:
Corner: Default is Let upper chart corner
X Panel: Default is 10
Y Panel: Default is 20
BackGround1: Default is DarkBlue
BackGround 2: Default is 47,47,47
Text C
FREE

** NOTE: This indicator uses realtime data. Thus DO NOT download Demo version. If you still need demo version, please refer to trial version . Version for MT4: https://www.mql5.com/en/market/product/123597
Symbol Chart Changer is an indicator/utility that offers you the option to switch between symbols and timeframes.
You can choose any symbol and timeframe on the same chart with just a few clicks. In addition, this indicator also shows the profit of the symbol through the color of the butt

40% off. Original price: $50 (Ends on February 15)
Advanced Bollinger Bands Scanner is a multi symbol multi timeframe Bollinger bands dashboard that monitors and analyzes the Bollinger Bands indicator from one chart. This panel scans the Bollinger bands indicator in up to 28 configurable instruments and 9 timeframes for price overbought/oversold, price consolidation (Bollinger bands squeeze), and consolidation breakout (squeeze break) with a deep scan feature to scan all market watch symbols

The Advanced Trend Scalper MT5 indicator is designed to help both novices and professional traders. The indicator analyses the market and gives you buy and sell signals. It does not use any other indicators, it works only with the market actions. The signal appears right after the candle close and it does not repaint. The efficient algorithm provides a high degree of reliability of such signals. Advanced Trend Scalpe r for the MetaTrader 4 terminal : https://www.mql5.com/en/market/product/

اسم المصدر: مؤشر أسعار الأسهم الخاص بمؤشر القوة النسبية 2 "مستويات سليمان" 지표와 "RSI Trend V" شكرا جزيلا. يبلغ عدد مستويات سليمان 9,800 مليون جنيه إسترليني، وهو ما يزيد عن 9,800 مليون دولار أمريكي شكرا جزيلا. شكرا جزيلا. مستويات سليمان في اللعبة: 노란색 박스 (자금 흐름 감지) - 노란색 박스 설명: ""الحصول على معلومات إضافية عن العمل" 기능 - 처음부터 개발됨": 특정 캔들에서 은행 및 기관의 자금 유입을 감지합니다. هذا هو السبب في أن هذا هو ما يحدث في المستقبل. اسم المنتج: """""""""""""" " 지표 기능 - 처음부터 개발됨": 재표시되지 독창적인 컬러 레벨 시스템. "هذا هو السبب

[ 내 채널 ] , [ 내 제품 ]
이 인디케이터는 전체 추세가 상승 또는 하락하는 동안 순간적인 압력으로 인해 캔들의 추세가 변하는 지점을 보여줍니다. 인디케이터에 표시되는 화살표는 이전 캔들이 특정 조건을 충족할 때 그려집니다. 전략을 설계할 때, 연속된 3~4개의 화살표를 잠재적인 돌파 신호로 해석할 수 있습니다. 예를 들어, 네 번째 화살표가 나타날 때 진입을 고려할 수 있습니다. 이는 주요 시장 움직임을 예측하고 거래 결정을 최적화하는 데 신뢰할 수 있는 도구입니다. 요약하면, 이 인디케이터는 캔들 패턴을 기반으로 신호를 생성합니다: 캔들이 bearish이지만, 윗꼬리가 이전 캔들을 초과함. 캔들이 bullish이지만, 아랫꼬리가 이전 캔들보다 낮음. 강력한 신호,
신호가 강할 때를 인식할 수 있습니다. 진입 전에 "Data Window"에서 이를 확인하면 승률을 높일 수 있습니다. 이 인디케이터를 VolumeHedger EA 와 함께 사용하면 매우 좋은 결과를 얻을
FREE

SHOGUN Trade - 16年間の最適化されなかった衝撃的な真実。
将軍取引2月特別セール – たったの99ドル(通常価格は249ドル)! この特別オファーは 2月28 日まで 利用可能です。 さらなる製品開発と最適化 に取り組 むため、貴重なフィードバックと引き換えにこの割引を提供いたします。皆様の洞察は、次回のアップデートや機能強化に直接影響します。 価格: 99ドル(特別割引199ドルから) 要件: レビューを残し、あなたの体験を共有してください。 私たちの目標: 皆様のフィードバックを 活用して積極的な製品開発 を行い 、取引に最適なツールを提供することを確実にします。 SHOGUN TRADE PRO v3.82 ~ 騒音を切り裂いて。「司令官の目」を極めろ。究極のダウ理論市場構造スイート。~ MT4版はこちらをクリックしてください https://www.mql5.com/en/market/product/158467
1. はじめに:なぜほとんどのトレーダーは「森」で迷子になるのか? 1分チャートの雑音に常に振り回されて、感情的なエントリーで損をしていません

The Super Arrow Indicator provides non-repainting buy and sell signals with exceptional accuracy. Key Features No repainting – confirmed signals remain fixed Clear visual arrows: green for buy, red for sell Real-time alerts via pop-up, sound, and optional email Clean chart view with no unnecessary clutter Works on all markets: Forex, gold, oil, indices, crypto Adjustable Parameters TimeFrame Default: "current time frame" Function: Sets the time frame for indicator calculation Options: Can

Delta Single Volume is a very powerful indicator that reads the supply on the Market.
It calculates the Delta from movement of the price and the difference of BUY and SELL volumes. Its special structure allows you to get all timeframe values available on the MT5 platform. It works on Tick Volumes and Real Volumes (if avalaibles on your Broker). A good observation of this instrument can suggest great entry points and possible reversal. We are confident that this tool will help you to improve you

익스퍼트 어드바이저 (EA) 버전 수동 신호 대신 자동 거래를 선호한다면, 이 지표의 익스퍼트 어드바이저 버전을 여기에서 확인할 수 있습니다:
https://www.mql5.com/en/market/product/148222
이 지표는 캔들이 볼린저 밴드(Bollinger Bands) 밖으로 벗어난 후 가격이 다시 밴드 안으로 들어오는 재진입(ReEntry) 순간 을 계산하고, 이를 RSI 확인 과 결합하여 오탐을 줄입니다.
가격이 하단 밴드 아래로 나갔다가 다시 안으로 돌아오고, (선택적으로) RSI가 방금 과매도(oversold) 상태에서 벗어났을 때 Buy ReEntry 신호가 감지됩니다.
가격이 상단 밴드 위로 나갔다가 다시 안으로 진입하고, (선택적으로) RSI가 방금 과매수(overbought) 상태에서 벗어났을 때 Sell ReEntry 신호가 생성됩니다.
신호는 차트에 화살표로 표시되며, 명확히 보이도록 고점/저점 바깥쪽에 약간 오프셋되어 그려집니다. 주요 특징 볼린
FREE

AI Forecasts MT5 인디케이터:
인공 지능과 딥 러닝을 통한 미래 예측 시스템 (AI + ML)
_ 주요 특징: 동적 데이터 분석을 기반으로 최대 20캔들 앞을 내다보는 미래 예측 스캘핑 트레이딩에 적합 예측 신뢰도를 반영하는 다색상 예측 차트와 현재 매수/매도 상태 옆의 흰색 핍 카운터 확률 변화 범위와 방향을 포함한 예상 가격 경로를 보여주는 확률 구역 Shock Pullback 인디케이터를 주로 기반으로 한 다변량 분석 포함: Pullback 구역, 갭 시작 및 종료의 계산 및 연구 노란색 화살표로 생성되는 경사, 가속, 감속 및 반등 신호 지그재그 각도와 돌파/상승 추세 구역 계산 플래그 및 패턴 모델 등의 분석 축적 구역과 갭의 모델링 및 미래 움직임에 미치는 영향 분석 예측 계산에 차트 패턴 통합 인공 지능:
MQL5 구조와 환경에서 설계된 고급 신경망 아키텍처 "참고: 학습 및 AI 시스템은 내부적이며 외부가 아니며 Python 등에 의존하지 않음" _
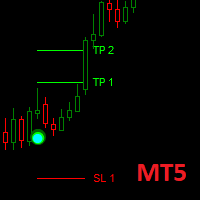
Dark Point is an Indicator for intraday trading. This Indicator is based on Trend Following strategy, also adopting the use of the atr to determine the right volatility. We can enter in good price with this Indicator, in order to follow the strong trend on the current instrument. If you love Dark Point, consider adding some power: Dark Power
Key benefits
Easily visible take profit/stop loss lines Intuitive directional points/arrows by colors Useful statistics , which indicate the wi
FREE
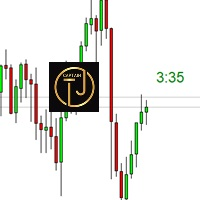
The CTJM Candle Timer Indicator is a robust tool developed for traders who use MetaTrader 5. Designed with precision, it displays the remaining time for the current candle on a trading chart, enabling traders to monitor the market more effectively and make timely decisions. With a customizable visual interface, users can adjust colors, font sizes, and positioning to suit their preferences. Some key features of this indicator include: Real-Time Candle Countdown: Keeps traders informed of the exa
FREE

The indicator draws trendlines on chart. This indicator has six inputs. User can specify alternative labels for both lines. If multiple instances of the indicator are used, the labels must differ. User can set width and color of the lines and depth which specifies what significant peaks should be used. For example, Depth=10 sets trendlines using the current peaks and valleys that have at least 10 bars to the right and to the left and that have highs/lows less/greater than the peak's high/low. In
FREE

Setup Tabajara는 "월스트리트의 OGRO"로 알려진 브라질 상인이 만들었습니다.
이 설정의 아이디어는 거래자에게 현재 가격 추세와 그래프에서 찾아야 하는 작업 유형을 나타내는 것입니다.
작업 이것은 오전 10시 40분까지 양초와 VWAP를 닫는 위치를 지정하고 그 이후에 4가지 색상으로 양초를 칠하는 20주기의 산술 평균으로 수행합니다. 녹색 -> 가격 상승 추세 (구매 진입점 검색) 검은색 -> 강세 추세에서 가격 수정(구매 진입점 검색) 빨간색 -> 하락 추세에 있는 가격 (매도 진입점 검색) 흰색 -> 하락세 시 가격 조정 (판매 진입점 검색) 또한 스크립트에 다음 표시기를 넣었습니다. 8 기간의 지수 평균: 단기 가격 움직임 식별 50개 기간의 산술 평균: 중기 가격 움직임 식별 80 기간의 지수 평균: 중기 가격 움직임 식별 200개 기간의 산술 평균: 장기 가격 움직임 식별
여전히 질문이 있는 경우 다이렉트 메시지로 저에게 연락하십시오: https://w
FREE

Trendline Targets Dashboard MT5 Trendline Targets Dashboard MT5 는 메타트레이더 5(MT5) 전용 지표로, 신호(Signal) , 진입가(Entry) , 손절가(Stop Loss) , 익절가(Take Profit) 를 리스크 배수 R 에 따라 자동으로 계산하여 시각적인 매매 계획을 보여줍니다. 이 도구는 직접 주문을 실행하지 않습니다. 이는 매매 자동화 로봇이 아닌, 시각적 분석 및 관리를 위한 전문 도구입니다. 출시 기념 이벤트: 구매 시마다 내 MQL5 프로필에 있는 다른 지표 1개를 무료 로 드립니다. 예외: Market Structure Order Block Dashboard MT5 는 보너스 대상에서 제외됩니다. 보너스를 받으시려면 구매 후 MQL5 메시지를 통해 원하시는 제품명을 보내주시기 바랍니다. 주요 기능 네온 효과가 적용된 추세선 (상승/하락) 캔들 종가 기준 추세 반전 시 BUY/SELL 신호 발생 리스크(1R)

평균 회귀 거래에 대한 전문적이고 정량적인 접근 방식을 구현하는 고유한 지표입니다. 이는 가격이 예측 가능하고 측정 가능한 방식으로 평균으로 전환되고 반환된다는 사실을 이용하여 비정량적 거래 전략을 훨씬 능가하는 명확한 진입 및 퇴장 규칙을 허용합니다. [ Installation Guide | Update Guide | Troubleshooting | FAQ | All Products ]
명확한 거래 신호 놀랍도록 쉬운 거래 사용자 정의 가능한 색상 및 크기 성능 통계 구현 대부분의 거래 전략을 능가합니다. 적절한 SL 및 TP 레벨을 표시합니다. 이메일/음향/시각 알림을 구현합니다.
작동 원리
이 지표는 더 높은 기간에서 완전히 사용자 정의 가능한 이동 평균 주변의 표준 편차를 측정하고 추세 추종 접근 방식을 사용하여 정확하게 거래를 찾습니다. 거래는 현재 차트의 가격 동작을 살펴보고 선택한 더 높은 기간에서 계산된 평균 가격대로 가격이 돌아오면 닫힙니다. 코딩 방식 때문에 지

Dark Oscillator is an Indicator for intraday trading. This Indicator is based on Counter Trend strategy, trying to intercept changes in direction, in advance compared trend following indicators. We can enter in good price with this Indicator, in order to follow the inversion of the trend on the current instrument. It is advised to use low spread ECN brokers. This Indicator does Not repaint and N ot lag . Recommended timeframes are M5, M15 and H1. Recommended working pairs: All. I nst

Volume Delta Candles offer a straightforward way to analyze trading activity within each candle, making it easier to see what's happening without needing an extra volume indicator. This tool uses lower timeframe or real-time data to show the percentage of buying and selling volume within a candle as a colored bar. Make sure you understand Volume and Volume Delta before jumping in. If you’re not sure, reach out to me first for a quick rundown. But if you're already familiar, you're good to go! Ke

MT4 version | Owl Smart Levels Indicator | Owl Smart Levels 전략 | FAQ
Fractals Indicator 는 Bill Williams 의 저자 거래 전략 요소 중 하나입니다. 가격 차트에서 가격 반전 지점을 검색하고 결과적으로 지원 및 저항 수준을 검색하는 데 사용됩니다. Full Fractals Indicator 는 거의 모든 거래 터미널의 툴킷에서 사용할 수 있는 개선된 Fractals입니다. 유일한 차이점은 프랙탈을 만들기 위해 기본 양초의 왼쪽에 5개의 양초와 오른쪽에 2개의 양초를 사용한다는 것입니다(그림 1 참조). 기본 구성 외에도 Full Fractals는 가격이 한동안 멈춘 수준을 찾습니다. Telegram 채팅: @it_trader_chat 새로운 Expert Advisor Prop Master - 트레이딩 터미널에서 테스트해보세요 https://www.mql5.com/ko/market/
FREE

The indicator identifies when a divergence occurs between price and an indicator or oscillator. It identifies both regular and hidden divergences. Combined with your own rules and techniques, this indicator will allow you to create (or enhance) your own powerful system. For higher probability setups I can recommend you to use my Supply Demand indicator and trade only if the divergence occurs inside a zone. Supply zone for bearish div and demand zone for bullish div. The optimal scenario is if it
FREE
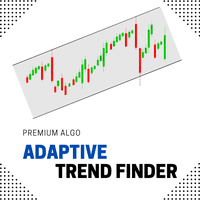
Introducing the Adaptive Trend Finder , a cutting-edge Forex indicator that automatically identifies and draws trend lines with pinpoint accuracy. Designed to adapt to changing market conditions, this powerful tool helps traders uncover the most significant trends, enabling them to capitalize on emerging opportunities and confirm the strength of ongoing market movements. The Adaptive Trend Finder uses advanced algorithms to scan the market for pivotal price points, dynamically adjusting trend li
FREE
VWAP Scalping Pro – Advanced VWAP & Market Profile System
Professional-Grade VWAP + Market Profile Technology for Precision Trading VWAP Scalping Pro is an advanced analytical tool that integrates Volume-Weighted Average Price (VWAP) analysis with professional Market Profile visualization.
It provides traders with institutional-style insights into price structure, volume distribution, and session dynamics — ideal for scalping, intraday, and swing trading strategies. Key Features Triple VWAP St

무료 AUX 지표, EA 지원 및 전체 가이드를 얻으시려면 방문하세요 – https://www.mql5.com/en/blogs/post/763955 트렌드를 포착하세요. 패턴을 읽으세요. 진입 시점을 타이밍하세요.
30초 이내의 3단계! 분석 없이도 쉽게 거래하세요 — 당신의 스마트 어시스턴트가 워크플로우를 단순화해 드립니다. 더 이상 차트 과부하 없음. 스마트 바이어스 감지로 자신감 있게 거래하세요. 모든 통화, 암호화폐, 주식, 금속, 지수 및 모든 시간대와 호환됩니다. 그냥 클릭하고 실행하세요 — 정말 간단합니다. 속도와 명확성을 원하는 바쁜 트레이더에게 이상적입니다. TPTSyncX는 추세, 패턴, 그리고 캔들스틱 트리거 분석을 하나로 통합하여 깨끗하고 지능적인 시각 시스템으로 동기화하는 강력한 올인원 MetaTrader 5 인디케이터입니다. 명확성, 정밀성, 속도를 원하는 트레이더를 위해 설계되었으며, 가격 행동, 구조적 패턴 및 시장 타이밍 도구의 조합을 통해 높은 확

이 올인원 트레이딩 인디케이터는 브레이크아웃 신호, 고점 및 저점 수준, 그리고 알림이 포함된 트레일링 스톱을 하나의 강력한 도구로 통합합니다. 차트에 너무 많은 인디케이터를 겹쳐 사용하느라 부담을 느껴본 적이 있다면, 이 인디케이터는 모든 것을 단순화하면서도 시장에서 날카로운 우위를 제공합니다. 세 가지 필수 요소를 깔끔하고 직관적인 디스플레이로 결합하여 진입 기회를 발견하고, 위험을 관리하며, 시장의 전체 흐름을 즉시 파악할 수 있도록 도와줍니다. 특히 브레이크아웃을 거래하는 트렌드 팔로워, 즉 고전적인 터틀 트레이딩 접근법과 유사한 방식으로 거래하는 트레이더에게 매우 유용합니다.
이러한 전통적인 트렌드 팔로잉 방식에서는 승률이 약 30~40% 정도이고 샤프 지수는 보통 수준일 수 있지만, 실제 수익은 드물게 발생하는 5~10%의 예외적인 거래에서 나옵니다. 모든 것은 일일 차트에서 펼쳐지며, 5분, 15분, 30분, 1시간, 4시간과 같은 단기 시간대의 혼란을 피합니다. 이를
FREE
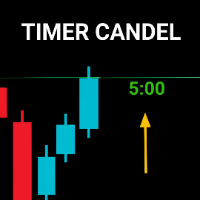
Timer Candle MT5 is a lightweight indicator that displays a countdown timer until the current candlestick closes. This indicator helps visual traders monitor the remaining time before the candle closes, especially on lower timeframes. Key Features: Countdown display in seconds or minute:second format. Text color changes automatically as it approaches the final seconds (warning color). Text is displayed in simulated bold style for better readability. Fully customizable: font type, size, color, a
FREE
Initial Balance Session The Initial Balance Indicator is a professional-grade tool for MetaTrader 5 traders, designed to enhance your trading by visualizing key price levels during the Asia, London, and US market sessions. This indicator plots the Initial Balance (IB) range—the high, low, and midpoint prices—formed during the first hour of each session, with a customizable box to highlight the range and optional extension levels for advanced analysis. Optimized for smooth, flicker-free perform

MetaTrader 5용 Candle Smart Range (CSR) Candle Smart Range는 여러 타임프레임에서 가격 범위를 자동으로 식별하도록 설계된 기술 지표입니다. 이 도구는 캔들 형성 및 이전 고점/저점과의 상호작용을 바탕으로 시장 구조를 분석합니다. 주요 기능: 범위 감지: 급격한 변동 전의 횡보 구간을 자동으로 식별합니다. 거짓 돌파 식별: 가격이 이전 수준을 넘어섰으나 캔들 종가 기준으로 범위 내에서 마감된 경우를 표시합니다. 멀티 타임프레임 분석: 사용자 정의 주기를 포함하여 최대 19개의 타임프레임 데이터를 한 차트에 표시합니다. 내부 시각화 (줌): 차트 변경 없이 상위 타임프레임 캔들 내부의 가격 움직임을 확인할 수 있습니다. 시간 필터: 주요 시장 세션 등 특정 시간대에만 작동하도록 설정 가능합니다. 과거 데이터 복기 모드: 과거 데이터를 단계별로 탐색하며 지표의 작동을 분석할 수 있습니다. 알림 시스템: 캔들 마감 및 새로운 범위 감지에 대한 사용
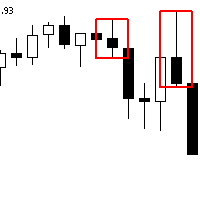
The Advanced Order Block Indicator for MetaTrader 5 is designed to enhance technical analysis by identifying significant order blocks that sweep liquidity and create Fair Value Gaps (FVG) when pushing away. This indicator is ideal for traders who focus on institutional trading concepts and wish to incorporate advanced order flow and price action strategies into their trading routine. Overview Order Block Identification : An order block represents a price area where a substantial number of orders
FREE
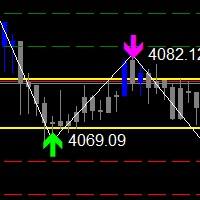
The Zigzag Price Arrow indicator is an enhanced version of the classic Zigzag indicator, combining the traditional zigzag pattern with advanced visual features. It not only identifies major market turning points but also provides clear trading signals through: • Directional arrows: Displays colored arrows (green for buy, magenta for sell) indicating potential trend directions.
• Price labels: Shows the exact price values at each pivot point directly on the chart.
• Improved visual clarity: Make
FREE

Haven Stop Loss Hunter Indicator
정확한 주요 가격 수준 분석 도구. 가격 움직임을 깊이 이해하고 거래 결정을 개선하려는 트레이더를 위해 설계되었습니다.
다른 제품 -> 여기에서 확인하세요 주요 기능: 중요한 가격 극점을 신속하게 식별
잠재적 돌파(Sweep) 수준 식별
가격이 특정 수준을 돌파하려 하지만 실패하는 순간을 감지하여, 반전 또는 추세 지속 가능성을 신호로 제공합니다. 핵심 가격 포인트의 시각적 표시
시장 구조 분석을 쉽게 하고, 눈에 보이는 데이터를 기반으로 한 의사 결정을 지원합니다. 이 지표는 가격이 주요 수준을 테스트하지만 돌파하지 않는 상황을 식별하는 데 이상적이며, 트레이더에게 중요한 신호를 제공합니다. 유연한 설정 을 통해 각자의 거래 전략에 맞춰 조정할 수 있으며, 모든 금융 상품에서 사용할 수 있습니다.
FREE

Very powerful indicator! converted from TradingView with upgraded alerts and added notifications. Ideal use in EAs.
Use as a supplementary Indicator to confirm your entries, but it is as good on it's own.
The indicator consists of 3 different Trend Meters and a 2 Trend Bars which are used to confirm trend
How to Use:
The more Trend meters are lit up the better =>>
-more GREEN COLOR at one bar means more confirmation to open buy trade,
- more RED COLOR signals for one bar = more confirmat

Crystal Heikin Ashi Signals - Professional Trend & Signal Detection Indicator Advanced Heikin Ashi Visualization with Intelligent Signal System for Manual & Automated Trading Overview Crystal Heikin Ashi Signals is a professional-grade MetaTrader 5 indicator that combines pure Heikin Ashi candle visualization with an advanced momentum-shift detection system. Designed for both manual traders and algorithmic systems, this indicator delivers clear trend analysis with precise entry signals through v

TRUE ANTI SPIKES DERIV
Find the user manual here, as well as settings fro boom 1000, crash 500, crash 1000 https://t.me/automated_TLabs DM: https://t.me/gg4rex
Professional Reversal Detection Indicator Advanced Multi-Timeframe Reversal Detection System for Boom & Crash Indices
Download product user manual here:
WHAT IS TRUE ANTI-SPIKES? True Anti-Spikes is a precision-engineered reversal detection indicator specifically designed for Boom and Crash synthetic indices. Unlike trend-follo
FREE
- Real price is 200$ - 50% Discount (It is 99$ now) - It is enabled for 2 purchases. Contact me for extra bonus (Gann Trend indicator), instruction or any questions! - Non-repaint, No lag - I just sell my products in Elif Kaya Profile, any other websites are stolen old versions, So no any new updates or support. - Lifetime update free Gann Gold EA MT5 Introduction W.D. Gann’s theories in technical analysis have fascinated traders for decades. It offers a unique approach beyond traditional cha

The Extreme Spike PRT Indicator is an effective tool for identifying sharp market fluctuations . It performs its calculations using the ATR (Average True Range) indicator and displays candles with extreme volatility in two categories: primary spikes and secondary spikes , within the Metatrader platform oscillator window. This tool assists traders in detecting intense price movements and conducting more precise analyses based on these fluctuations. Time Frame 15-minute - 1-ho
MetaTrader 마켓은 거래로봇과 기술지표를 판매하기에 최적의 장소입니다.
오직 어플리케이션만 개발하면 됩니다. 수백만 명의 MetaTrader 사용자에게 제품을 제공하기 위해 마켓에 제품을 게시하는 방법에 대해 설명해 드리겠습니다.
트레이딩 기회를 놓치고 있어요:
- 무료 트레이딩 앱
- 복사용 8,000 이상의 시그널
- 금융 시장 개척을 위한 경제 뉴스
등록
로그인
계정이 없으시면, 가입하십시오
MQL5.com 웹사이트에 로그인을 하기 위해 쿠키를 허용하십시오.
브라우저에서 필요한 설정을 활성화하시지 않으면, 로그인할 수 없습니다.