RSI Shift Zone MT5 Scanner
- Indicators
-
Duc Hoan Nguyen
 ->| I am a dedicated developer and programmer specializing in MQL4, MQL5, and Pine Script for TradingView, with a strong track record of success in building high-performing, tailored solutions for MT4, MT5, and TradingView platforms. Over the years, I have worked extensively within the financial and
 - Version: 1.11
- Updated: 8 August 2025
- Activations: 10
New tools will be $30 for the first week or the first 3 purchases!
Trading Tools Channel on MQL5: Join my MQL5 channel to update the latest news from me
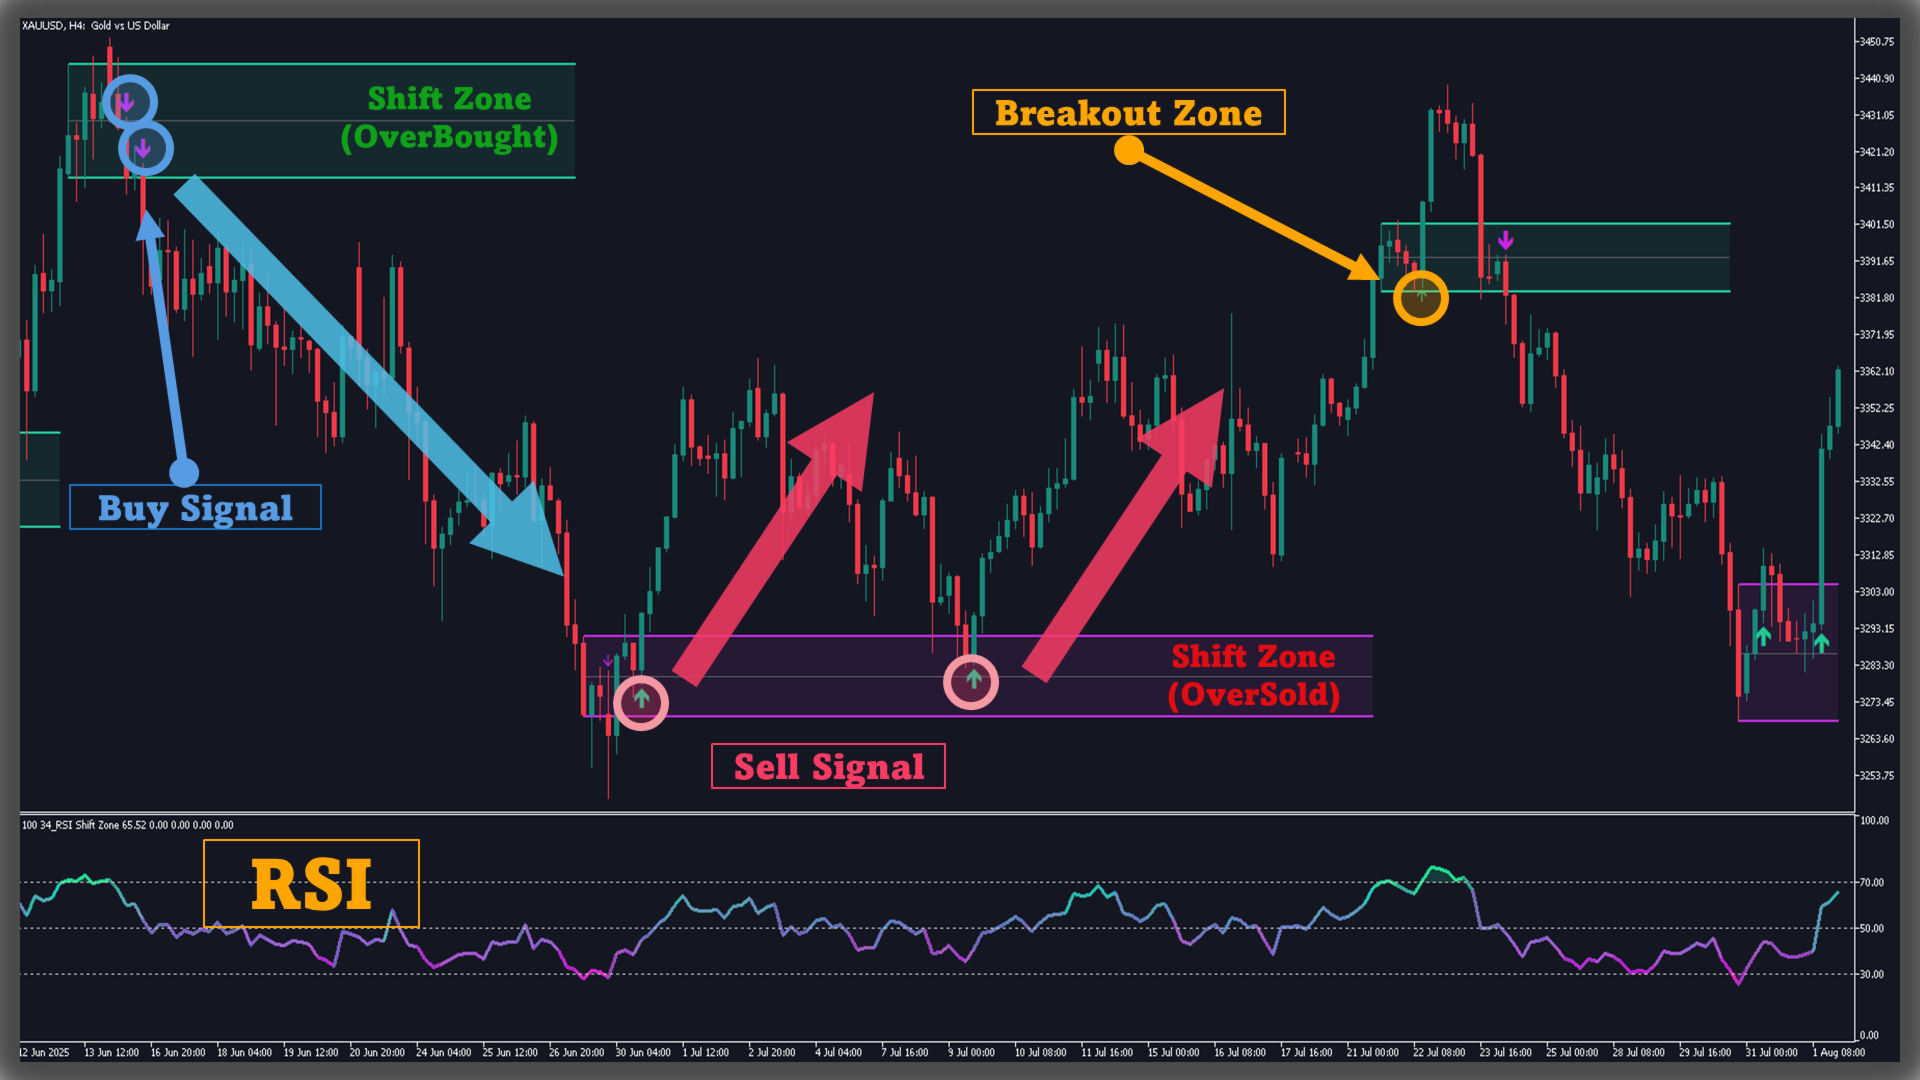
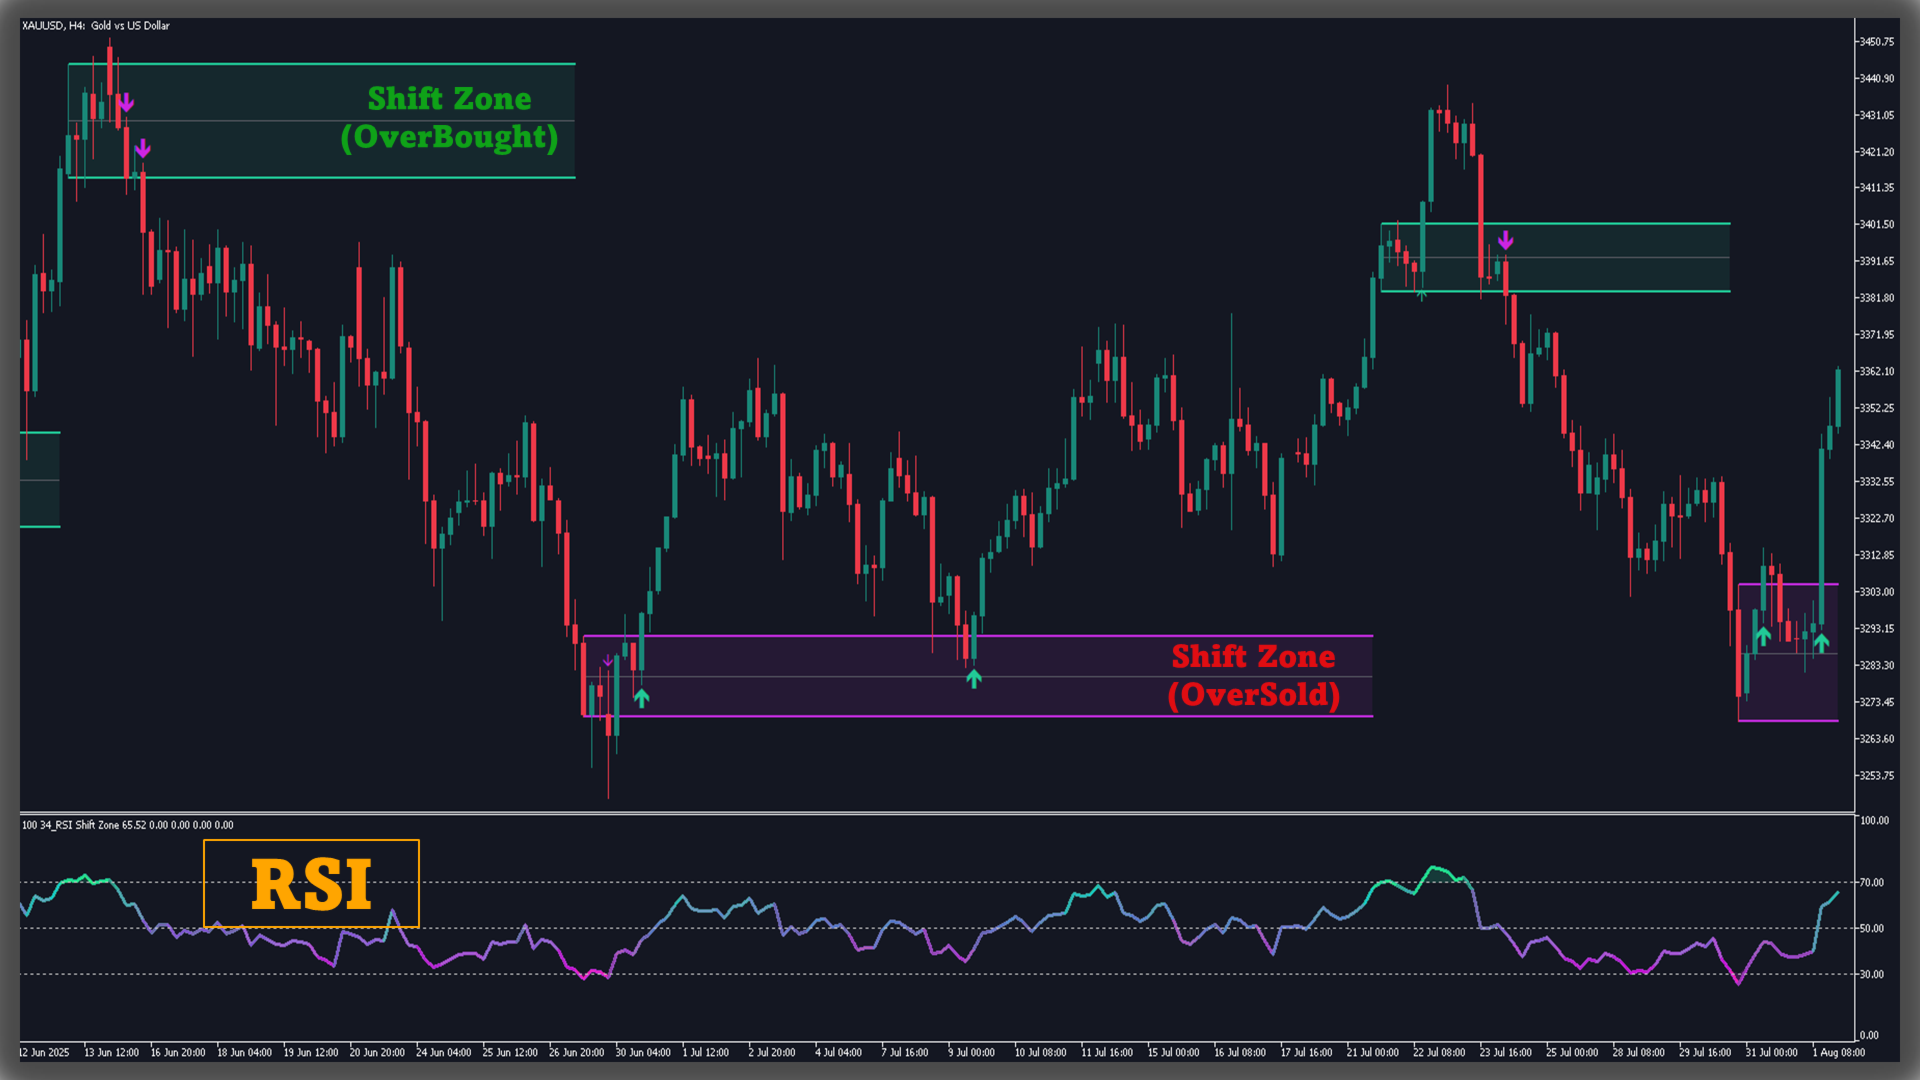
RSI Shift Zone Scanner identifies moments when market sentiment may change by linking RSI signals with price action. Whenever the RSI moves above or below preset levels (default 70 for overbought, 30 for oversold), the indicator draws a channel directly on the chart. These channels mark areas where sentiment likely turned and can be observed as potential support or resistance.
See more MT4 version at: RSI Shift Zone MT4 Scanner
See more products at: All Products
-
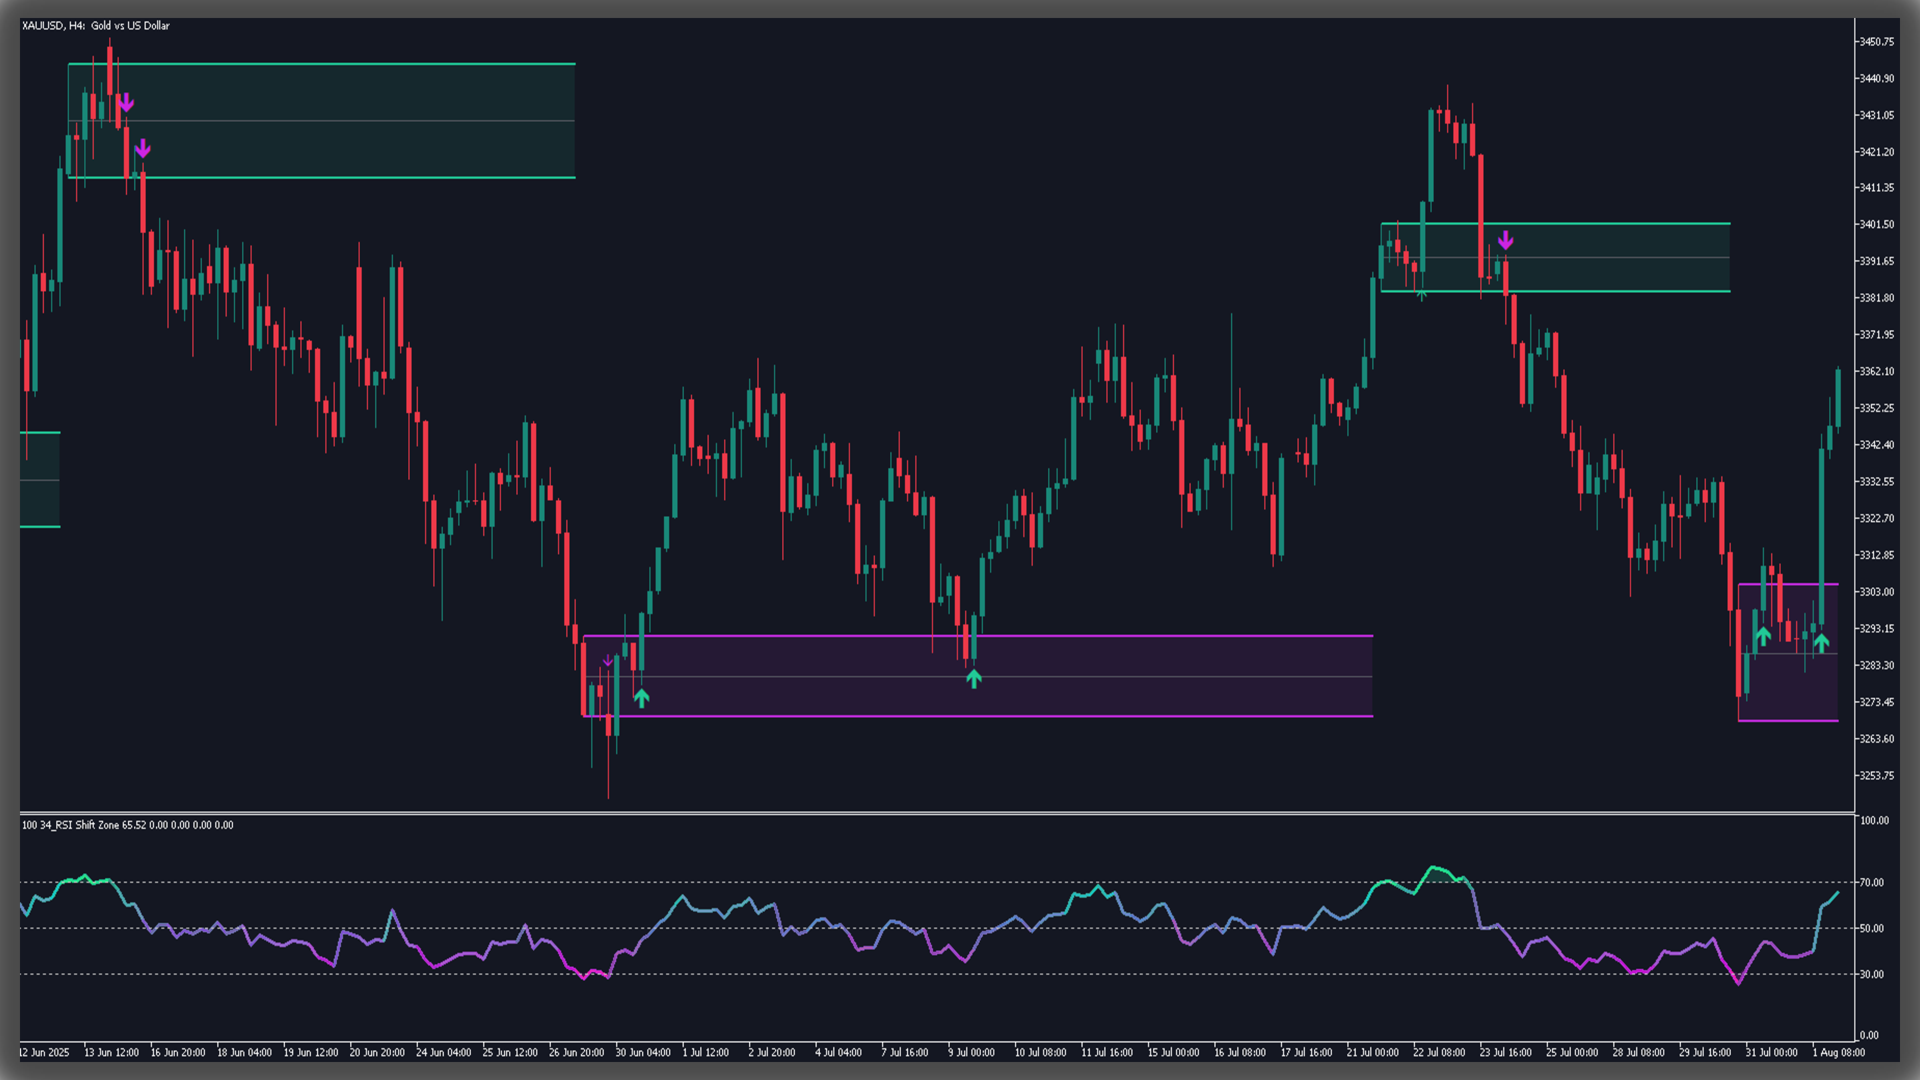
When the RSI crosses an upper or lower level, a new channel appears.
-
The channel’s boundaries are fixed to the high and low of the crossing candle, with a mid-line showing their average for quick reference.
-
Each channel stays visible for at least a user-defined number of bars (default 15), so only notable shifts remain on screen.
-
Colours indicate bullish or bearish context
-
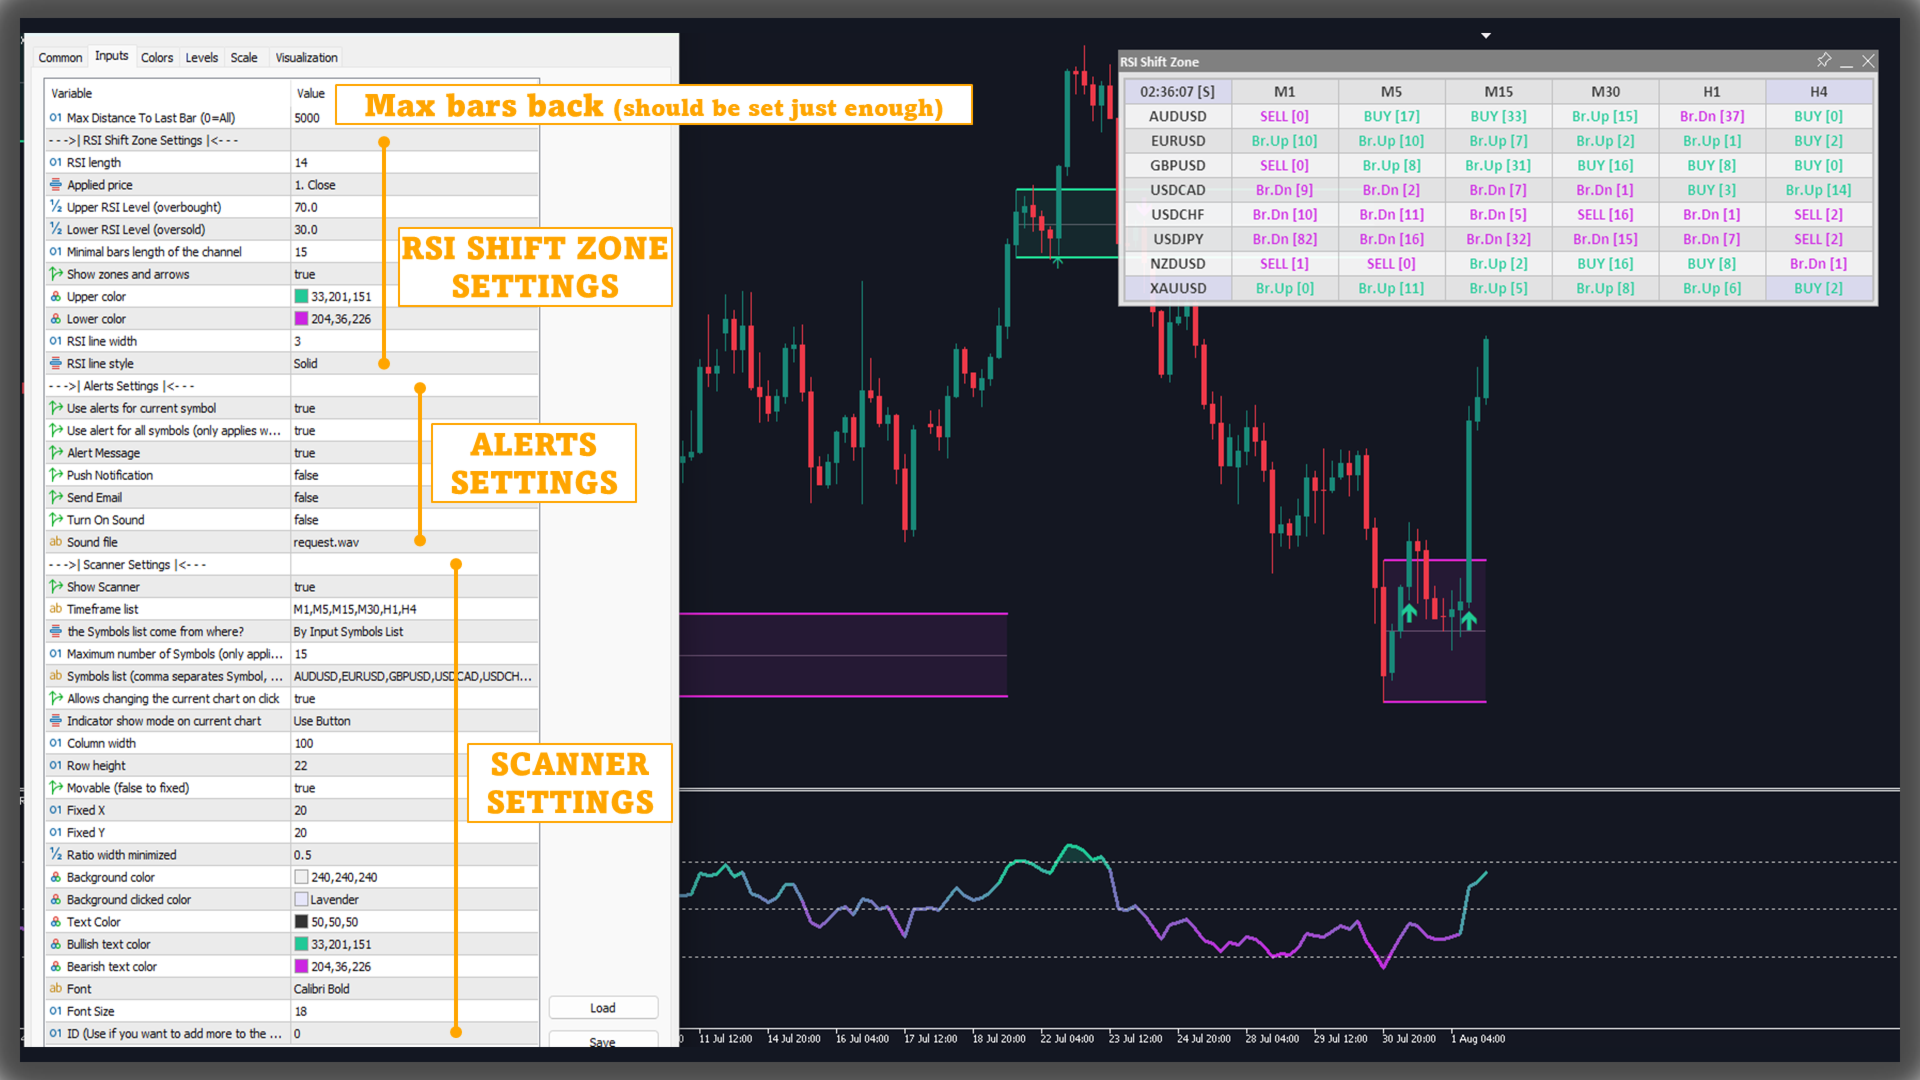
Standard RSI calculation (default length 14).
-
Detects crossovers above the upper level and crossunders below the lower level.
-
Channels are drawn on the main chart, providing a clear historical map of previous sentiment changes.
-
A zone disappears once the minimum bar count is met and a new shift forms.
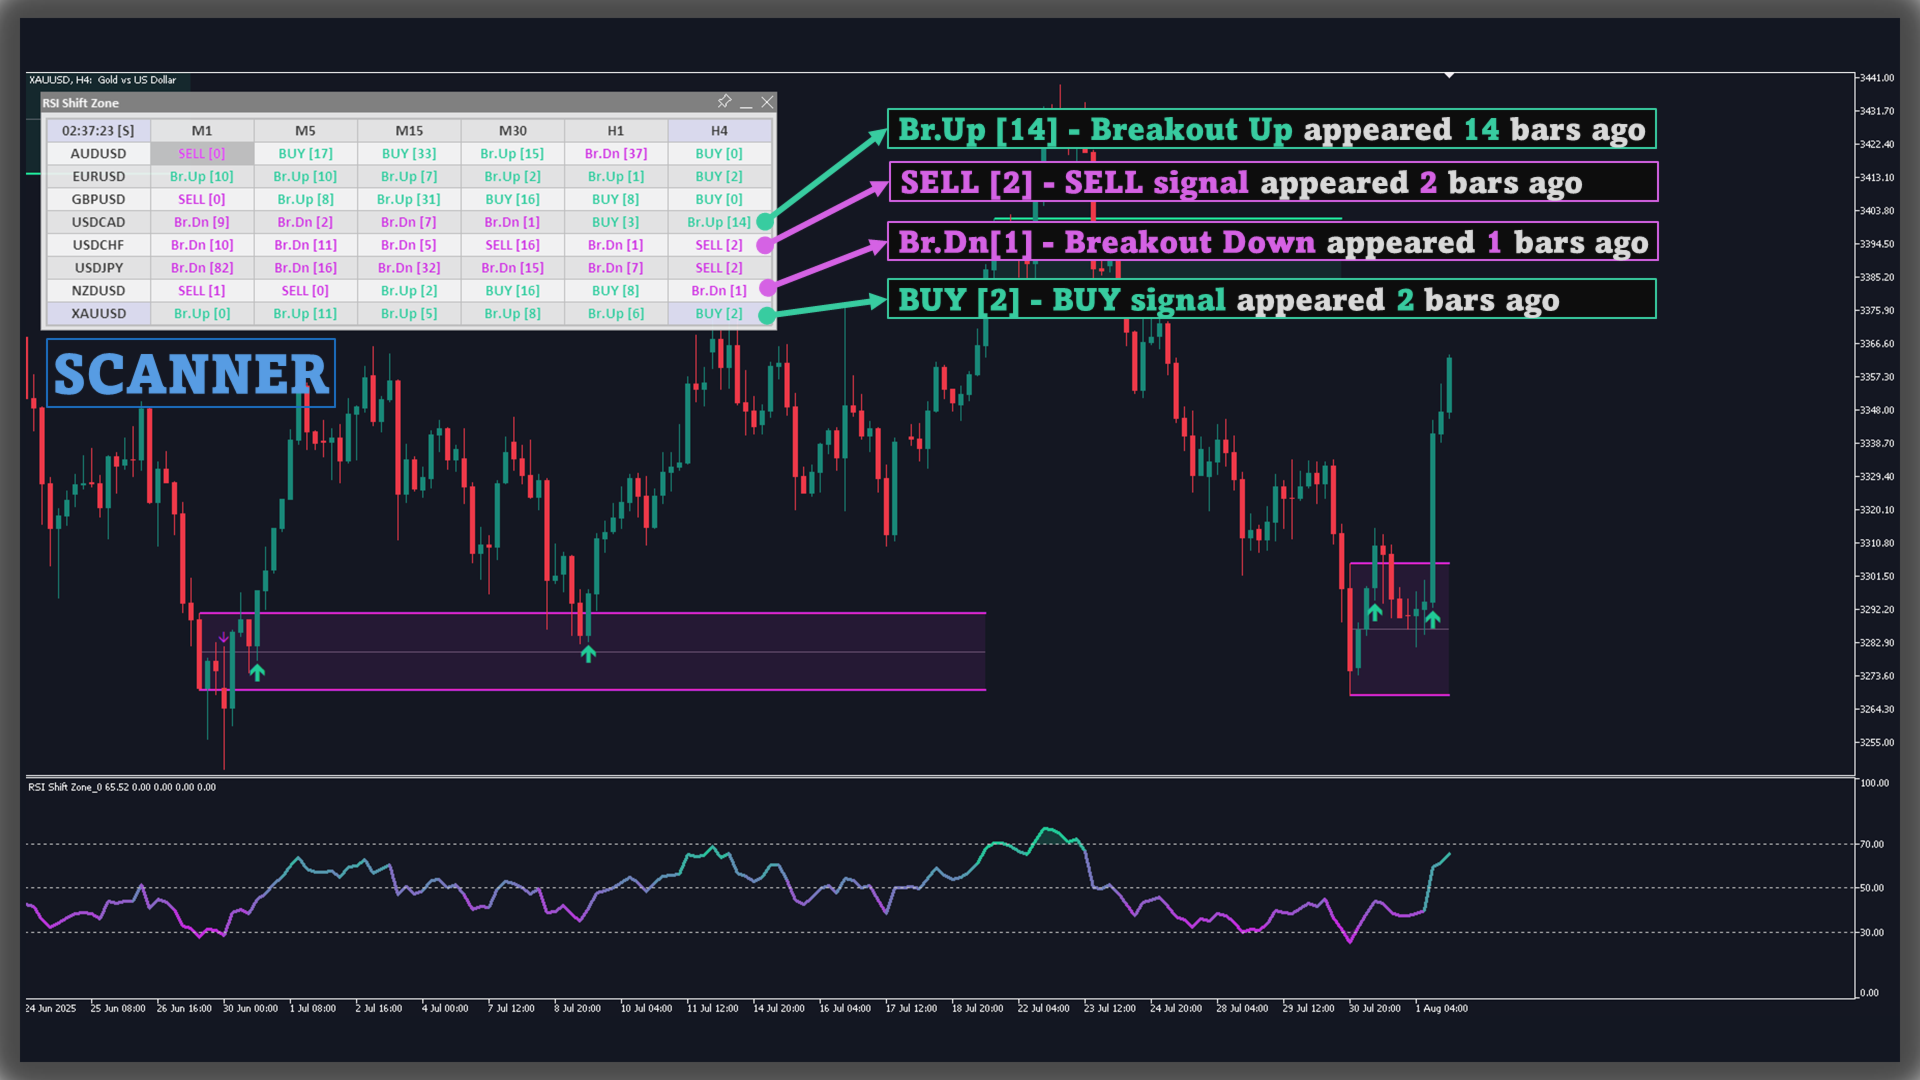
Signal details
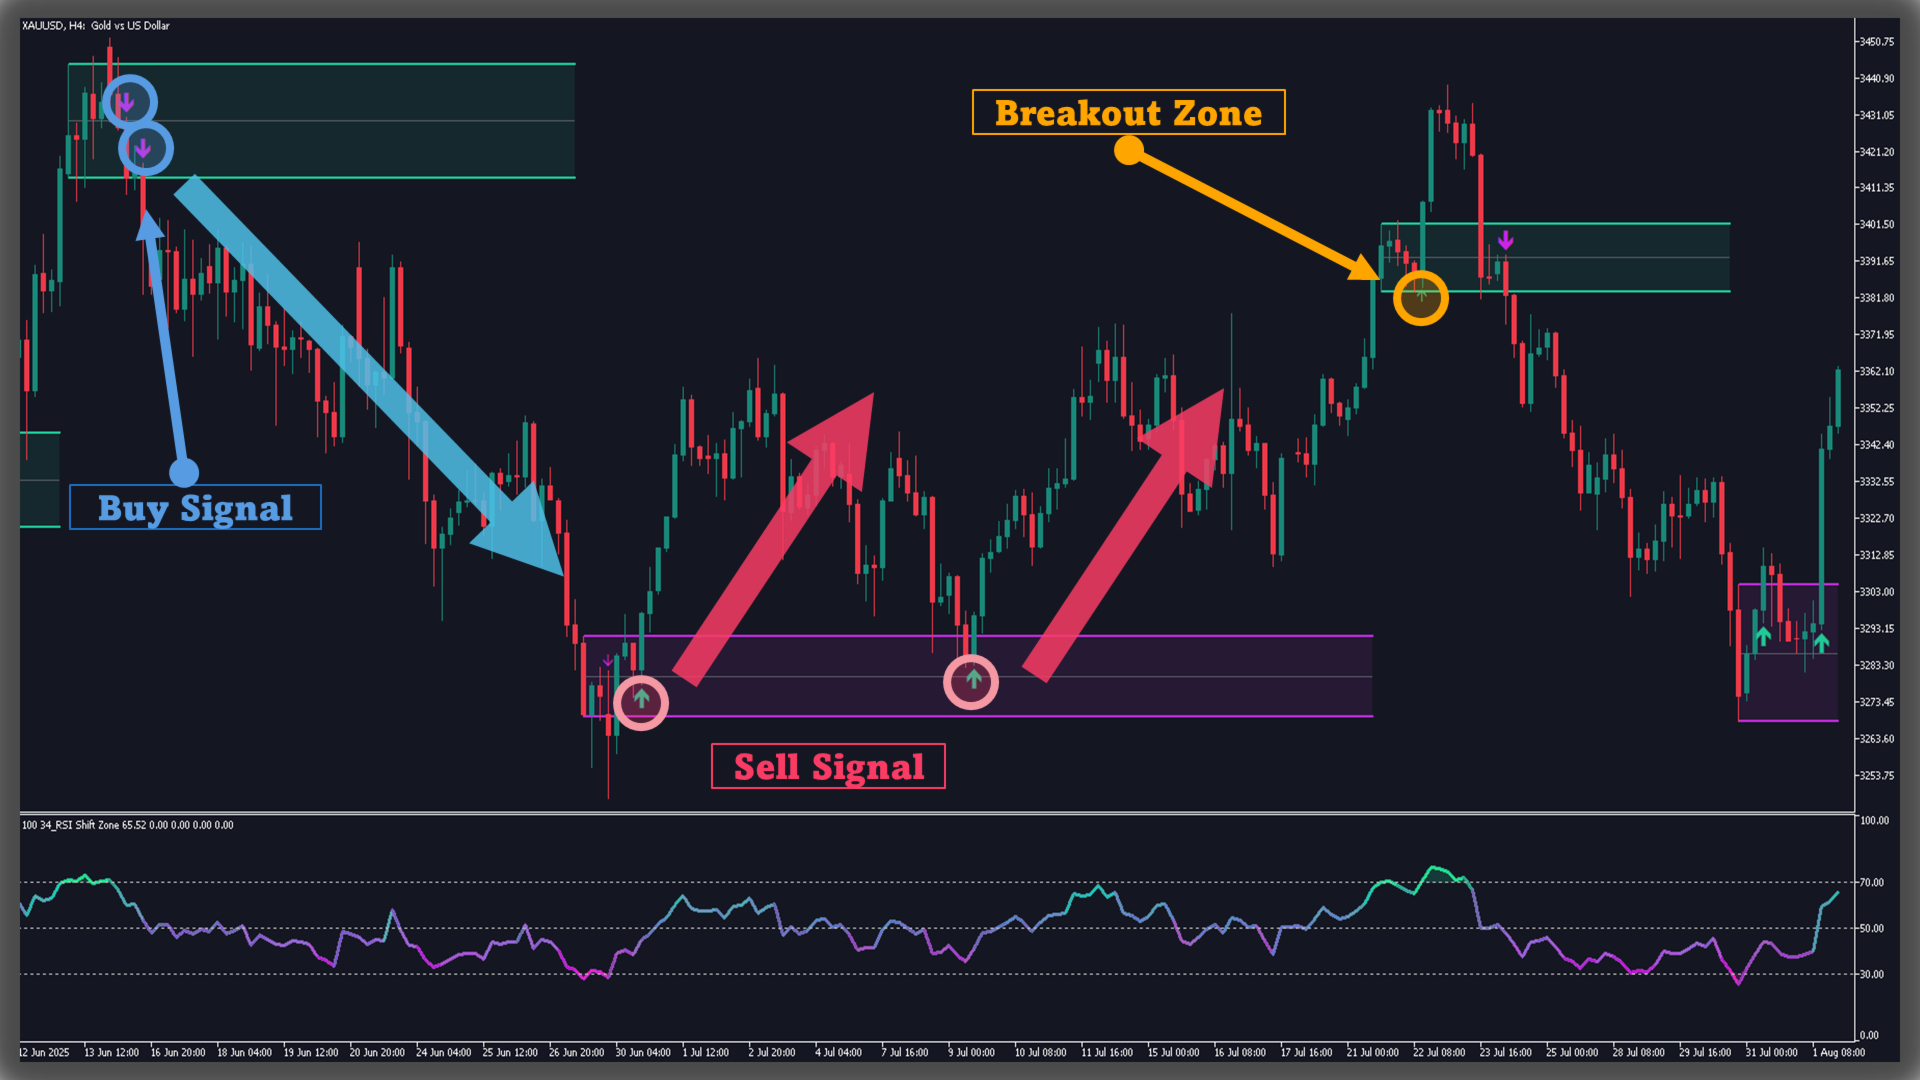
- BUY/SELL signals are determined when the closing bar bounces back from the zone. Bouncing up from the oversold zone (red zone) is considered a BUY signal, bouncing down from the overbought zone (green zone) is considered a SELL signal.
- BREAKOUT arrows are determined when the closing bar continues within the zone. The closing bar below the oversold zone (red zone) is considered a breakout down signal, a bearish continuation sign. The closing bar above the overbought zone (green zone) is considered a breakout up signal, a bullish continuation sign.
Scanner and Alerts
- Users can turn on/off the scanner to monitor other charts quickly.
- The indicator has signal alerts when Buy/Sell appear, Breakout arrows appear, users can easily grasp market information with these alerts (especially when using Scanner)
Practical use
Traders often treat channel boundaries as dynamic reference lines:
-
Use signals to refer to price action.
-
Use the mid-line as a balance point during pullbacks.
-
Use Scanner to capture recent price action on other charts
Summary
RSI Shift Zone Scanner converts basic RSI threshold events into visual structures on the price chart, allowing traders to monitor where momentum-driven turns have occurred and to incorporate those areas into their analysis of support, resistance, breakouts or reversals.
User didn't leave any comment to the rating