Indicadores técnicos para MetaTrader 5 - 4
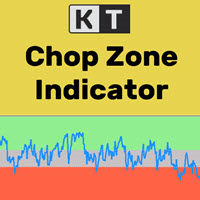
Es bien sabido que los mercados financieros tienden solo el 30% del tiempo, mientras que el otro 70% se mueven dentro de un rango. Sin embargo, la mayoría de los traders principiantes tienen dificultades para identificar si el mercado está en tendencia o atrapado en un rango lateral. KT Chop Zone resuelve este problema al resaltar de manera clara la fase del mercado, dividiéndolo en tres zonas: zona bajista, zona alcista y zona de consolidación (Chop Zone).
Características
Mejore su operativa a

El indicador Boom and Crash Spike Detector está codificado en base a una estrategia avanzada principalmente para detectar Boom and Crash en los precios. Se implantaron algoritmos complejos para detectar auges y caídas de alta probabilidad en los precios. Alerta sobre posibles fases de auge o choque: Fase de auge: cuando el precio aumenta demasiado rápido. Crash Phase: cuando el precio baja demasiado rápido.
OFERTA POR TIEMPO LIMITADO: El indicador está disponible por solo 30 $ y de por vida. C

Presentamos nuestro nuevo indicador Price Retest. Obtenga alertas instantáneas cuando el precio vuelva a probar, dándole una poderosa ventaja en su estrategia de negociación. Recuerde hacer su propio análisis antes de hacer cualquier movimiento en el mercado. Versión MT4 - https://www.mql5.com/en/market/product/118031 Únase para aprender la profundidad del mercado - h ttps:// www.mql5.com/en/channels/suvashishfx
Aquí tiene una explicación detallada de cómo funciona el indicador Price Retest, su
FREE

Antes: 99 $ Ahora: 49 El indicador de Rango Diario de Blahtech muestra el rango medio diario junto con los rangos individuales de la sesión. Utilizando el precio de apertura diario como referencia, el indicador muestra los objetivos de rango fijo y dinámico como líneas en los gráficos. Estas líneas muestran claramente cuándo se ha agotado el rango medio. Los rangos diarios y de sesión pueden ser útiles para confirmar entradas o establecer objetivos y es un excelente potenciador de probabilidades
HTF Power of Three (ICT) - Indicador MT5 - Versión 1.1 Visión general El indicador HTF Power of Three es una implementación profesional del concepto Power of Three del Inner Circle Trader (ICT), inspirado por Larry Williams. Este indicador visualiza en tiempo real el desarrollo de velas en un marco temporal superior (HTF) en cualquier gráfico de un marco temporal inferior, lo que lo convierte en una herramienta esencial para los operadores de ICT que estudian los patrones de movimiento de los pr
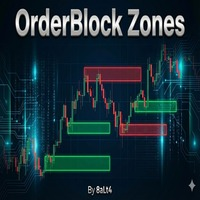
Descripción general OrderBlock Zone es un indicador avanzado de MetaTrader 4 que detecta y visualiza automáticamente las zonas de operaciones institucionales (Order Blocks) en el mercado. Al seguir las huellas dejadas por los grandes actores (bancos, fondos de cobertura), determina los niveles potenciales de soporte y resistencia.
Características principales Detección automática de OrderBlock Análisis basado en fractales: determina puntos de inflexión fuertes con un análisis fractal de 36 perí
FREE

Domina las tendencias del mercado con el SuperTrend Alert MT5, un indicador poderoso diseñado para ofrecer señales precisas de seguimiento de tendencias para el trading de forex, acciones, criptomonedas y materias primas. Aclamado en comunidades de trading como Forex Factory y Reddit’s r/Forex, y elogiado en discusiones en Investopedia y TradingView por su robusta detección de tendencias, este indicador es una herramienta esencial para traders que buscan entradas y salidas confiables. Los usuari
FREE

THE MAGICIAN - Indicador Profesional de Zonas de Oferta y Demanda Convierte el Caos del Mercado en Oportunidades de Trading Cristalinas en Gráficos de Oro de 15 Minutos ¿Tienes Problemas con el Trading de Oro? ¿Cansado de adivinar dónde entrar en operaciones en XAU/USD? ¿Confundido sobre si COMPRAR, VENDER o QUEDARSE FUERA? ¿Perdiendo configuraciones de alta probabilidad en el marco temporal de 15 minutos? "THE MAGICIAN" revela las fuerzas invisibles de oferta y demanda que mueven los mercados!
FREE
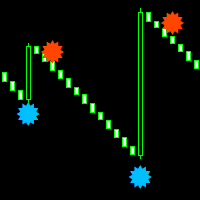
Boom y crash smasher indicador gratuito que funciona en todos los marcos temporales, desde el de un minuto hasta el mensual. el indicador es 100% no-repaint. el indicador viene con alertas de sonido y notificación push por correo electrónico el indicador aparece en el palo de la vela actual para entradas más rápidas se puede utilizar en todos los gráficos y gráficos renko el punto naranja es su señal de venta el punto azul es su señal de compra
FREE

Versión mejorada del indicador gratuito HMA Trend (para MetaTrader 4) con análisis estadístico. HMA Trend es un indicador de tendencia basado en la media móvil de Hull (HMA) con dos periodos. La HMA con un periodo lento identifica la tendencia, mientras que la HMA con un periodo rápido determina los movimientos a corto plazo y las señales en la dirección de la tendencia.
Las principales diferencias con respecto a la versión gratuita: Capacidad de predecir la probabilidad de un cambio de tendenc
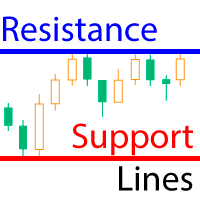
El indicador calcula líneas fractales que son líneas de soporte/resistencia técnicamente psicológicas. De hecho, son los máximos y mínimos del precio durante un periodo de tiempo. El indicador funciona en todos los gráficos y plazos. Esta versión gratuita del indicador Resistance Support Lines Pro ¡viene tal cual! Opciones: Estos ajustes no pueden modificarse en esta versión Fractal Candels = 5 - el número de candeleros en base a los cuales se construye un fractal. Calcula el máximo/mínimo al qu
FREE
Special offer : ALL TOOLS , just $35 each! New tools will be $30 for the first week or the first 3 purchases ! Trading Tools Channel on MQL5 : Join my MQL5 channel to update the latest news from me Maximiza tu ventaja comercial con Follow Line MT5 con escáner, un indicador avanzado basado en la volatilidad diseñado para traders serios. Esta herramienta combina el poder de las Bandas de Bollinger con configuraciones personalizables, ofreciendo información precisa sobre los movimient
FREE
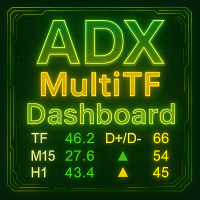
ADX MultiTF Dashboard Descripción General ADX MultiTF Dashboard es un indicador multi-temporal que muestra información clave sobre la fuerza y dirección de la tendencia simultáneamente en tres períodos temporales seleccionados. El indicador presenta los datos en un formato de panel compacto, mostrando valores ADX, indicadores de movimiento direccional y lecturas RSI para un análisis completo del mercado. El panel proporciona información crítica para las decisiones de trading, incluyendo la fuer
FREE
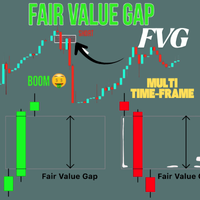
Crystal FVG Touch Detector – Indicador profesional de Smart Money Concept Crystal FVG Touch Detector es un indicador profesional diseñado para traders que aplican los conceptos Smart Money (SMC) y la metodología ICT.
Detecta automáticamente los Fair Value Gaps (FVG) en cualquier símbolo y timeframe, mostrándolos con colores y detección de contacto en tiempo real.
Con lógica no repintada y alto rendimiento, revela zonas de desequilibrio institucional. Características principales Detección precisa
FREE
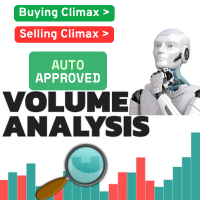
Spanish Crystal Volume Indicator — Herramienta de Análisis de Volumen para MT5 Descripción general
Crystal Volume Indicator es un indicador avanzado para MetaTrader 5 diseñado para analizar la dinámica del volumen detrás del precio. Identifica eventos clave como Clímax de Compra, Clímax de Venta y Velas Débiles, permitiendo detectar zonas de posible reversión o continuación. Funciones principales Compatible con Tick Volume y Real Volume (si el bróker lo permite) Histograma codificado por
FREE

Solución innovadora para la negociación y filtrado de tendencias con todas las funciones importantes integradas en una sola herramienta. El algoritmo inteligente de Trend PRO detecta la tendencia, filtra el ruido del mercado y da señales de entrada con niveles de salida. Las nuevas características con reglas mejoradas para el cálculo estadístico mejoraron el rendimiento general de este indicador.
Información importante revelada Maximice el potencial de Trend Pro, por favor visite www.mql5.com
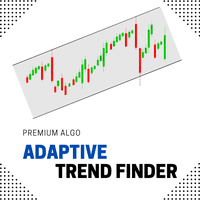
Presentamos el Adaptive Trend Finder , un indicador de Forex de última generación que identifica y traza automáticamente líneas de tendencia con una precisión milimétrica. Diseñado para adaptarse a las condiciones cambiantes del mercado, esta potente herramienta ayuda a los operadores a descubrir las tendencias más significativas, lo que les permite aprovechar las oportunidades emergentes y confirmar la fuerza de los movimientos del mercado en curso. El Buscador de Tendencias Adaptativo utiliza
FREE

Zonas de oferta/demanda: áreas observables donde el precio se ha acercado muchas veces en el pasado. Utilidad multifuncional: 66+ características , incluyendo este indicador | Contáctame para cualquier pregunta | Versión MT4 El indicador muestra dónde el precio podría potencialmente revertirse nuevamente. Normalmente, cuanto más veces el precio ha sido rechazado desde el nivel, más significativo es. En la configuración de entrada puedes ajustar: Activar o desactivar zonas débiles; Most

Antes: $49 Ahora: $33 Blahtech Better Volume proporciona una versión mejorada de las barras verticales de volumen. Cada barra se compara con las 20 anteriores. Dependiendo de su volumen, rango y densidad de volumen se le asignará un estado y color. Volumen bajo - Volumen mínimo Alto Volumen - Volumen significativo con movimiento limitado Climax Neutral - Volumen alto con dirección poco clara
Climax Up - Volumen alto con dirección alcista Climax Dn - Volumen alto con dirección bajista Climax Chu

El indicador M5 definitivo para Boom 300 indx, que proporciona señales de compra/venta claras y filtradas para eliminar el ruido del mercado y mejorar la precisión de sus operaciones. Centrado en el beneficio alerta de spike a tiempo
señales de spike
spike trade sl 5 candels
tablero de seguimiento de tendencia para conocer la fuerza y dirección de la tendencia
úselo en cualquier condición de mercado y le ayudará a mantenerse rentable y consistente envía alerta de notificación a mt5 y móvil ju

El indicador dibuja líneas de tendencia en el gráfico. Este indicador tiene seis entradas. El usuario puede especificar etiquetas alternativas para ambas líneas. Si se utilizan varias instancias del indicador, las etiquetas deben ser diferentes. El usuario puede establecer el ancho y el color de las líneas y la profundidad, lo que especifica qué picos significativos deben usarse. Por ejemplo, Depth = 10 establece líneas de tendencia utilizando los picos y valles actuales que tienen al menos 10 b
FREE

Antes: $69 Ahora: $49 Blahtech VWAP - Precio medio ponderado por volumen (VWAP) es la relación entre el precio y el volumen total. Proporciona un precio medio en un intervalo de tiempo especificado. Enlaces [ Instalar | Actualizar | Documentación ] Características destacadas
Línea VWAP configurable Sesiones, intervalos, anclado o continuo Línea de liquidación del día anterior Bandas de desviación estándar Alertas al cierre de barra o en tiempo real Volúmenes automáticos de Broker o Tick Uso de

Setup Tabajara fue creado por un comerciante brasileño conocido como "El OGRO de Wall Street".
La idea de esta configuración es indicar al comerciante la tendencia actual de los precios y el tipo de operación que debe buscar en el gráfico.
Operación Lo hace mediante el posicionamiento del cierre de las velas y el VWAP hasta las 10:40 am y luego mediante la media aritmética de 20 periodos pintando las velas en 4 colores posibles: Verde -> Precio subiendo en tendencia alcista (Buscar puntos de
FREE

TRUE ANTI SPIKES DERIV
Find the user manual here, as well as settings fro boom 1000, crash 500, crash 1000 https://t.me/automated_TLabs DM: https: //t.me/gg4rex
Indicador Profesional de Detección de Reversiones Sistema Avanzado de Detección de Reversiones Multi-Timeframe para Índices Boom & Crash
Descargue aquí el manual de usuario del producto:
¿QUÉ ES TRUE ANTI-SPIKES? True Anti-Spikes es un indicador de detección de reversiones diseñado específicamente para índices sintéticos Boom y Cr
FREE

MT4 version | Indicador Owl Smart Levels | Estrategia Owl Smart Levels | FAQ El Indicador Fractals es uno de los elementos de la estrategia comercial del autor de Bill Williams. Se utiliza para buscar puntos de inversión de precios en el gráfico de precios y, en consecuencia, niveles de soporte y resistencia. El Indicador Full Fractals es un Fractals mejorado que está disponible en el conjunto de herramientas de casi todos los terminales comerciales. Su única diferencia es que pa
FREE
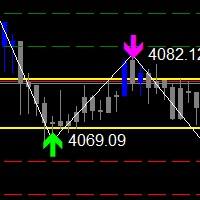
El indicador Zigzag Price Arrow es una versión mejorada del clásico indicador Zigzag, que combina el patrón de zigzag tradicional con características visuales avanzadas. No sólo identifica los principales puntos de inflexión del mercado, sino que también proporciona señales de trading claras a través de: - Flechas direccionales: Muestra flechas de colores (verde para comprar, magenta para vender) que indican posibles direcciones de tendencia.
- Etiquetas de precios: Muestra los valores exactos
FREE
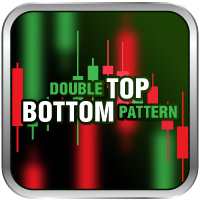
¿Qué es la doble parte superior e inferior?
Los patrones de doble techo y suelo son patrones gráficos que ocurren cuando la inversión subyacente se mueve en un patrón similar a la letra "W" (doble fondo) o "M" (doble techo). El análisis doble superior e inferior se utiliza en el análisis técnico para explicar los movimientos en un valor u otra inversión, y se puede utilizar como parte de una estrategia comercial para explotar patrones recurrentes.
Puedes encontrar la versión MT4 aquí.
El indi

El indicador identifica cuando ocurre una divergencia entre el precio y un indicador u oscilador. Identifica divergencias tanto regulares como ocultas. Combinado con sus propias reglas y técnicas, este indicador le permitirá crear (o mejorar) su propio sistema poderoso. Características
Puede detectar divergencias para los siguientes osciladores / indicadores: MACD, OsMA, estocásticos, RSI, CCI, RVI, Awesome, ADX, ATR, OBV, índice compuesto, MFI y Momentum. Solo se puede seleccionar un osc
FREE

EL PREDICTOR: Aprendizaje automático avanzado y potencia TIC Transforma tu trading de conjeturas a precisión basada en datos. El Predictor no es un indicador más; es un sofisticado motor de análisis de mercado que combina la IA de Reconocimiento de Patrones con el poder institucional de las estrategias ICT (Inner Circle Trader) . Diseñado para traders profesionales que demandan señales de alta precisión para Forex, Boom/Crash e Índices de Volatilidad. ¿Por qué elegir "The Predictor"? A di

Descubra el Método MSG: Domine la Brecha de la Sesión Principal para Obtener Ganancias Consistentes en Forex Libere el poder del Método MS G, nuestra estrategia patentada de Brecha de Sesión Principal diseñada para capturar operaciones de alta probabilidad durante las transiciones clave de las sesiones de mercado. Desarrollado por el equipo de T1 FX, este enfoque innovador aprovecha la precisión algorítmica para identificar y explotar las brechas de precios entre las principales sesiones de nego

Este tablero muestra los últimos patrones armónicos disponibles para los símbolos seleccionados, por lo que ahorrará tiempo y será más eficiente / versión MT4 . Indicador gratuito: Basic Harmonic Pattern
Columnas del indicador
Symbol: aparecerán los símbolos seleccionados Trend : alcista o bajista Pattern : tipo de patrón (gartley, mariposa, murciélago, cangrejo, tiburón, cifrado o ABCD) Entry : precio de entrada SL: precio de stop loss TP1: 1er precio de toma de beneficios
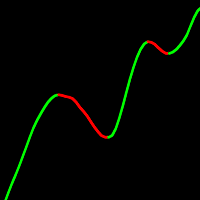
Media móvil con enormes posibilidades de personalización. 10 tipos de suavizado. 12 opciones de precio para construir. Posibilidad de muestrear el movimiento resultante. Código rápido. Posibilidad de uso en expertos sin restricciones. El indicador UniversalMA combina los métodos de construcción más populares utilizados en el comercio moderno. Por lo tanto, ya no es necesario tener muchos indicadores diferentes. Asesor experto basado en indicadores Los promedios móviles son indicadores rezagados
FREE

Haven Stop Loss Hunter Indicator
Herramienta precisa para analizar niveles clave. Desarrollado para traders que buscan comprender más profundamente la dinámica de precios y mejorar sus decisiones comerciales.
Otros productos -> AQUÍ Funciones clave: Ayuda a encontrar rápidamente importantes extremos de precios.
Identificación de niveles de ruptura potencial (sweep)
Detecta momentos en que el precio intenta romper un nivel, pero no puede hacerlo, señalando una posible reversión o continuación
FREE

Bill Williams Advanced está diseñado para el análisis automático de gráficos utilizando el sistema "Profitunity" de Bill Williams. El indicador analiza cuatro marcos temporales a la vez.
Manual (Be sure to read before purchasing)
Ventajas
1. Analiza el gráfico utilizando el sistema "Profitunity" de Bill Williams. Las señales se muestran en una tabla en la esquina de la pantalla y en el gráfico de precios. 2. Encuentra todas las señales AO y AC conocidas, así como las señales de zona. 3 . Equipa

Volume & Liquidity Hunter – Scalping es un indicador profesional de scalping diseñado para rastrear en tiempo real aumentos repentinos de volumen y zonas de liquidez en múltiples marcos temporales.
Combina conceptos de "dinero inteligente" (smart money) con condiciones reales de trading, convirtiéndose en la herramienta ideal para operar con scalping preciso. Ya sea que estés operando en reversiones, rupturas o huecos de valor justo (FVG) — este indicador te ayuda a identificar en dónde se conc

Buscador de Sesiones - Siga las Sesiones del Mercado Forex con Precisión
Adelántese al mercado con Session Finder , un elegante diseño estilo HUB para MetaTrader 5. Proporciona visibilidad en tiempo real de las principales sesiones bursátiles del mundo -Sídney, Tokio, Londres y Nueva York- para que siempre sepa qué mercados están abiertos, cerrados o a punto de cambiar. Características principales: Estado de la sesión en tiempo real: Vea de un vistazo si una sesión está abierta o cerrada. Cuent
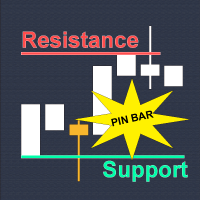
¿Por qué no funcionan los indicadores técnicos?
Muchos operadores pierden dinero por culpa de cruces de indicadores retrasados y rupturas falsas. Los indicadores son espejos retrovisores. No son más que bonitas ecuaciones matemáticas de datos PASADOS. ¿Conduciría usted hacia adelante mirando su espejo retrovisor? Absolutamente NO. El indicador del "Santo Grial" no existe. Decodificación de la Acción del Precio: ¿Cómo opera REALMENTE el dinero inteligente?
Al mercado no le importan sus indicador
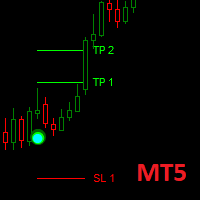
Dark Point es un indicador para operaciones intradía. Este indicador se basa en la estrategia de seguimiento de tendencia , también adoptando el uso de la atr para determinar la volatilidad correcta. Podemos entrar en buen precio con este Indicador, con el fin de seguir la tendencia fuerte en el instrumento actual. If you love Dark Point, consider adding some power: Dark Power
Principales ventajas
Líneas take profit/stop loss fácilmente visibles Puntos/flechas direccionales intuitivos por color
FREE

Oferta especial : ALL TOOLS , ¡solo $35 cada uno! Nuevas herramientas costarán $30 durante la primera semana o para las primeras 3 compras ! Canal de Trading Tools en MQL5 : únete a mi canal de MQL5 para recibir mis últimas novedades Este indicador traza zonas de detección de ruptura, denominadas “Smart Breakout Channels”, basadas en el movimiento de precios normalizado por volatilidad. Estas zonas se muestran como cajas dinámicas con superposiciones de volumen. La herramienta dete
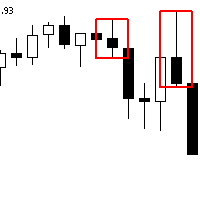
El Indicador Avanzado de Bloqueo de Órdenes para MetaTrader 5 está diseñado para mejorar el análisis técnico mediante la identificación de bloques de órdenes significativos que barren la liquidez y crean Fair Value Gaps (FVG) al alejarse. Este indicador es ideal para operadores que se centran en conceptos de negociación institucional y desean incorporar estrategias avanzadas de flujo de órdenes y acción del precio en su rutina de negociación. Visión general Identificación de bloques de órdenes :
FREE
Muchos operadores profesionales utilizan señales de divergencia de alta calidad como parte de su estrategia para entrar en una posición. Detectar rápidamente las divergencias correctas puede ser difícil, especialmente si su ojo aún no está entrenado para ello. Por esta razón hemos creado una serie de indicadores de divergencia de osciladores profesionales fáciles de usar que son muy personalizables para que usted obtenga sólo las señales que desea operar. Tenemos este indicador de divergencia pa
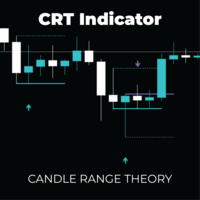
CRT Pro: Sistema de Inversión Multi-Tiempo Desbloquee las configuraciones de inversión de alta probabilidad con la precisión de la Teoría del Rango de Velas (CRT) combinada con el Análisis de Tendencia DSL Avanzado. El sistema CRT Multi-Timeframe no es sólo un indicador de señales; es un marco de trading completo diseñado para identificar "Barridos de Liquidez" y falsas rupturas, los momentos exactos en los que el dinero institucional entra en el mercado. Al filtrar estos potentes patrones de in

Position Size Calculator Lite MT5 – Indicador gratuito de gestión de riesgo Importante Si necesita zonas de Stop Loss y Take Profit interactivas (desplazables con el ratón sobre el gráfico), un panel avanzado con margen, break-even y métricas de riesgo detalladas, busque en el Market: Position Size Calculator PRO MT5 . Esta versión Lite es una edición gratuita y simplificada centrada en el cálculo del tamaño de la posición. Presentación Position Size Calculator Lite MT5 es un indicador gratuito
FREE

* Debido a la autenticidad de los datos para las principales divisas, se recomienda el uso de gráficos en vivo.
¿Qué es UEX Pure USD Euro Index ? Descripción en inglés: https://www.mql5.com/en/market/product/152936
Descubra el verdadero pulso del mercado forex con Pure USD & Euro Index, un indicador innovador que revela la fortaleza y la debilidad ocultas entre las dos divisas más poderosas del mundo.
En lugar de basarse en un solo par como el EURUSD, esta herramienta mide el rendimiento ag

Crystal Quantum Flow
Indicador avanzado de inteligencia de mercado Crystal Quantum Flow es un indicador profesional de trading de nueva generación diseñado para traders que exigen claridad, precisión y una visión del mercado de nivel institucional.
Este indicador está construido como un sistema completo de apoyo a la toma de decisiones, combinando análisis multidimensional del flujo del mercado, inteligencia sincronizada por marcos temporales y una interpretación visual avanzada en un único en
FREE
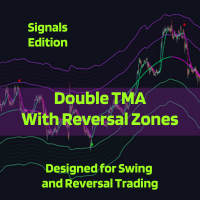
La herramienta de análisis técnico Double TMA with Bands - Signals Edition v4.0 está diseñada para MetaTrader 5 y combina dos medias móviles triangulares (TMA) con zonas de inversión basadas en ATR para ayudar a identificar la dirección de la tendencia y los posibles puntos de inflexión. Incluye visualización opcional de indicadores, múltiples tipos de señales y alertas flexibles para garantizar que nunca se pierda la operación.
Notas del desarrollador:
Las correcciones de errores y la impleme
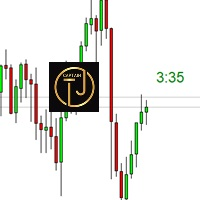
El indicador CTJM Candle Timer es una robusta herramienta desarrollada para los operadores que utilizan MetaTrader 5. Diseñado con precisión, muestra el tiempo restante para la vela actual en un gráfico de negociación, lo que permite a los operadores supervisar el mercado de manera más eficaz y tomar decisiones oportunas. Con una interfaz visual personalizable, los usuarios pueden ajustar los colores, tamaños de fuente y posicionamiento para adaptarse a sus preferencias. Algunas de las principa
FREE
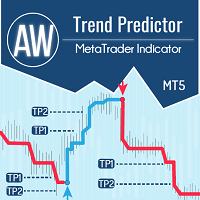
La combinación de niveles de tendencia y ruptura en un sistema. Un algoritmo de indicador avanzado filtra el ruido del mercado, determina la tendencia, los puntos de entrada y los posibles niveles de salida. Las señales indicadoras se registran en un módulo estadístico, que le permite seleccionar las herramientas más adecuadas, mostrando la efectividad del historial de señales. El indicador calcula las marcas Take Profit y Stop Loss. Manual e instrucciones -> AQUÍ / Versión MT4 -> AQUÍ Có
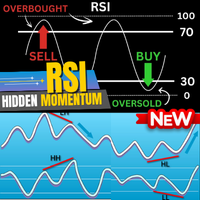
The Real RSI – Cazador de Divergencias Profesional Descripción general The Real RSI es un indicador profesional de detección de divergencias diseñado para traders que buscan precisión de nivel institucional al identificar señales de reversión y continuación basadas en RSI.
Detecta automáticamente divergencias regulares y ocultas entre el precio y el RSI, confirmando cada configuración mediante una lógica inteligente de pivotes y validación estructural en tiempo real.
Este indicador está desarrol
FREE

El indicador de zonas de consolidación es una potente herramienta diseñada para que los operadores identifiquen y aprovechen las pautas de consolidación del mercado. Este innovador indicador detecta las zonas de consolidación y proporciona alertas oportunas cuando el precio rompe por encima o por debajo de estas zonas, lo que permite a los operadores tomar decisiones comerciales informadas. Versión MT4 : https://www.mql5.com/en/market/product/118734 Únete para aprender profundidad de mercado -
FREE
- El precio real es de 200$ - Descuento del 50% (Ahora es de 99$) - Está habilitado para 4 compras. ¡Póngase en contacto conmigo para el bono extra (indicador de tendencia de Gann), instrucción o cualquier pregunta! - No repintado, No lag - Yo sólo vendo mis productos en Elif Kaya Perfil, cualquier otro sitio web son robados versiones antiguas, Así que no hay nuevas actualizaciones o apoyo. - Actualización de por vida libre Gann Oro EA MT5 Introducción Las teorías de W.D. Gann en el análisis té

nota: este indicador es para METATRADER4, si quieres la versión para METATRADER5 este es el enlace: https://www.mql5.com/it/market/product/108106 TRENDMAESTRO ver 2.5 TRENDMAESTRO reconoce una nueva TENDENCIA desde el principio, nunca se equivoca. La certeza de identificar una nueva TENDENCIA no tiene precio. DESCRIPCIÓN TRENDMAESTRO identifica una nueva TENDENCIA de raíz, este indicador examina la volatilidad, los volúmenes y el momentum para identificar el momento en el que se produce una expl
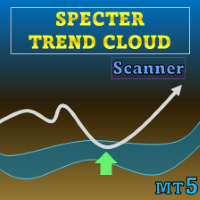
Oferta especial : ALL TOOLS , solo $35 cada uno. Nuevas herramientas costarán $30 durante la primera semana o para las primeras 3 compras ! Trading Tools Channel on MQL5 : Únete a mi canal de MQL5 para recibir mis últimas novedades Specter Trend Cloud es una herramienta de visualización de tendencia basada en medias móviles diseñada para resaltar la dirección del mercado y las oportunidades clave de retesteo. Al combinar medias adaptativas con un ajuste por volatilidad, crea una “n
Spike Trap es una herramienta simple pero poderosa que identifica picos agudos en el mercado y espera retrocesos de precios para resaltar zonas de entrada y salida de alta probabilidad. Al combinar la detección de volatilidad con una lógica de retroceso inteligente, ayuda a los traders a capitalizar movimientos de precios rápidos con precisión y riesgo reducido. Ideal para scalping o trading a corto plazo en mercados volátiles. Spike Trap se puede utilizar para operar índices sintéticos como
Timer Candle MT5 es un indicador ligero que muestra una cuenta atrás hasta el cierre de la vela actual. Este indicador ayuda a los operadores visuales a controlar el tiempo restante antes de que la vela se cierre, especialmente en los marcos de tiempo más bajos. Características principales: Cuenta atrás en segundos o minutos:segundos. El color del texto cambia automáticamente a medida que se acerca a los segundos finales (color de advertencia). El texto se muestra en negrita simulada para una m
FREE
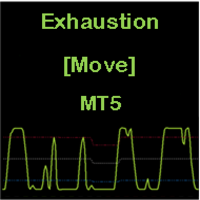
CONSTITUCIÓN El agotamiento [Move] es un indicador compuesto por un oscilador y tres niveles dinámicos (superior, medio e inferior). Las entradas se pueden utilizar para ajustar el oscilador, los niveles dinámicos y las señales de advertencia. Está diseñado únicamente para la plataforma MT5. APLICACIÓN Este indicador debe utilizarse con un filtro de tendencia [por ejemplo, medias móviles, MA 200]. Detecta el agotamiento de los movimientos de corrección dentro de una tendencia, dando así puntos d

INTRODUCCIÓN La Autolínea de Fibra es una herramienta básica que los analistas utilizan para averiguar cuándo se está invirtiendo la tendencia de un valor. Al determinar las zonas de soporte y resistencia , ayuda a identificar cambios significativos en el precio al tiempo que filtra las fluctuaciones a corto plazo, eliminando así el ruido de las condiciones cotidianas del mercado. Es una herramienta excelente para cualquier operador que siga indicadores que utilicen máximos y mínimos oscilantes

Auto Fibo es un indicador desarrollado para mejorar sus operaciones manuales. Dibujará la proporción áurea de forma automática, ahorrando tiempo y facilitando su operativa. Adjunta el indicador a el gráfico y automáticamente se dibujará la proporción áurea exacta, ahorrándose el trabajo de tener que encontrar el punto crítico. La interfaz se ajusta según su ordenador a los puntos altos y bajos aproximados de la banda Este indicador corregirá la mayoría de los errores de selección de los punto
FREE

El indicador KT Momentum Arrows se basa en una ruptura momentánea que se calcula mediante la desviación de las bandas y la volatilidad emergente en una dirección determinada. Se genera una señal de compra cuando el precio cierra por encima de la banda superior y una señal de venta cuando el precio cierra por debajo de la banda inferior. Se utiliza un coeficiente de magnitud como parámetro de entrada, el cual afecta tanto la desviación de las bandas como la medición de la volatilidad. Este valor

Funciones
Indicador para el Trading de Retroceso de Fibonacci Se dibuja un gráfico de Fibonacci basado en la barra previa seleccionada entre 1H, 4H, 1D y 1W. Cuando el precio del mercado toca el nivel de Fibonacci, cambia el color y se muestra la hora del toque. El gráfico de Fibonacci se dibuja en los niveles -23.6, 0, 23.6, 38.2, 50, 61.8, 76.4, 100 y 123.6, y el gráfico se refresca cuando se actualiza la barra.
Variables
Marco de tiempo: Se dibuja un gráfico de Fibonacci con el marco de t
FREE

** NOTA: Este indicador utiliza datos en tiempo real. Por lo tanto NO descargue la versión Demo. Si todavía necesita la versión demo, por favor consulte la versión de prueba .
Symbol Chart Changer es un indicador/utilidad que le ofrece la opción de cambiar entre símbolos y marcos temporales.
Puede elegir cualquier símbolo y marco temporal en el mismo gráfico con sólo unos clics. Además, este indicador también muestra el beneficio del símbolo a través del color de los botones.
Características

¡La mejor solución para cualquier operador novato o experto!
Este indicador es una herramienta única, de alta calidad y asequible porque hemos incorporado una serie de características propias y una nueva fórmula. ¡Con sólo UN gráfico puede leer la Fuerza de la Divisa para 28 pares de Divisas! Imagínese cómo mejorará su operativa porque podrá señalar el punto exacto de activación de una nueva tendencia o de una oportunidad de scalping.
Manual del usuario: haga clic aquí
Ese es el primero, ¡
El indicador Pain & Gain Spike de SyntheticaFX es una herramienta especializada diseñada para identificar posibles oportunidades de picos en el mercado, exclusivamente para operadores que se centran en los pares Pain y Gain de Weltrade. Este indicador está optimizado para operar en los marcos temporales de 1 minuto (M1), 2 minutos (M2), 3 minutos (M3) y 5 minutos (M5) y sólo admite los siguientes pares: PainX 1200, PainX 999, PainX 800, PainX 600, PainX 400, GainX 1200, GainX 999, GainX 800, Gai
Special offer : ALL TOOLS , just $35 each! New tools will be $30 for the first week or the first 3 purchases ! Trading Tools Channel on MQL5 : Join my MQL5 channel to update the latest news from me El indicador Volumetric Order Blocks Multi Timeframe es una herramienta poderosa diseñada para traders que buscan una comprensión más profunda del comportamiento del mercado al identificar áreas clave de precios donde los principales participantes del mercado acumulan órdenes. Estas área

El indicador Supertrend fue creado originalmente por un francés llamado Olivier Seban , y su objetivo es identificar la Tendencia Primaria de los precios . Su cálculo es sencillo y se basa en la media de Máximos y Mínimos y luego le añadimos la volatilidad de un periodo personalizado, más un multiplicador. De esta forma obtenemos la Línea de Supertendencia. Puedes encontrar en la web varios enfoques y estrategias de trading utilizando este indicador tan útil.
CÓMO "LEER" ESTE INDICADOR
Si los p
FREE
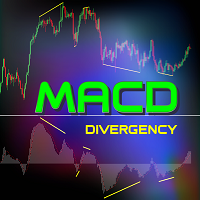
Este indicador identifica con precisión las divergencias alcistas y bajistas entre los movimientos de los precios y el histograma MACD, utilizando períodos de medias móviles exponenciales (EMA) de 5 (rápida), 34 (lenta) y un período de línea de señal de 5. El indicador resalta los puntos donde el momentum se debilita, señalando posibles reversiones de tendencia. Reglas para la correcta identificación de divergencias: La divergencia alcista es válida cuando el precio forma mínimos más bajos y el
FREE

El precio de mercado suele caer entre los límites del canal .
Si el precio está fuera de rango, es una señal de trading o una oportunidad de trading.
Si el precio está fuera de rango, es una señal de negociación o una oportunidad de negociación. Básicamente, el canal de ajuste puede utilizarse para ayudar a determinar las condiciones de sobrecompra y sobreventa en el mercado. Cuando el precio de mercado está cerca del límite superior, el mercado se considera sobrecomprado (zona de venta). Por

RSI Entry Points es la actualización del indicador RSI estándar para evitar el retraso. El indicador dibuja las nubes y las flechas para tener una imagen clara de dónde está el precio y qué esperar. ¿Por qué el RSI estándar se retrasa? porque la mayoría de las veces no lo usamos correctamente y es con una flexibilidad visual muy débil, menos informatividad. Con mi actual actualización intenté solucionar ambos problemas al mismo tiempo y obtuve mejores resultados y entradas más exactas que con el

Indicador RSI v SMA MTF : La ventaja del trading profesional en una sola herramienta Resumen El indicador RSI v SMA MTF es una sofisticada herramienta de análisis del momento en múltiples marcos temporales que transforma el RSI tradicional en un sistema de negociación potente y procesable. Al combinar el análisis de la pendiente del RSI con las señales de cruce de la SMA, la detección de divergencias y la confluencia multitemporal en tiempo real, este indicador proporciona a los operadores una v
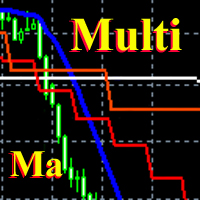
Este es el mismo Ma Multi que antes sólo estaba disponible para Mt4 . Ahora hay una versión para Mt5 . Pertenece a toda una familia de indicadores multi-frame, implementando la idea de mostrar diferentes marcos temporales en una sola escala de tiempo. La fijación horizontal de la escala permite obtener una visión general y proporciona oportunidades adicionales para el análisis técnico. El indicador se prueba en Just2trade Parámetros del indicador: MA_Period - período de promedio de la media móv
MetaTrader Market es el mejor lugar para vender los robots comerciales e indicadores técnicos.
Sólo necesita escribir un programa demandado para la plataforma MetaTrader, presentarlo de forma bonita y poner una buena descripción. Le ayudaremos publicar su producto en el Servicio Market donde millones de usuarios de MetaTrader podrán comprarlo. Así que, encárguese sólo de sus asuntos profesionales- escribir los programas para el trading automático.
Está perdiendo oportunidades comerciales:
- Aplicaciones de trading gratuitas
- 8 000+ señales para copiar
- Noticias económicas para analizar los mercados financieros
Registro
Entrada
Si no tiene cuenta de usuario, regístrese
Para iniciar sesión y usar el sitio web MQL5.com es necesario permitir el uso de Сookies.
Por favor, active este ajuste en su navegador, de lo contrario, no podrá iniciar sesión.