YouTubeにあるマーケットチュートリアルビデオをご覧ください
ロボットや指標を購入する
仮想ホスティングで
EAを実行
EAを実行
ロボットや指標を購入前にテストする
マーケットで収入を得る
販売のためにプロダクトをプレゼンテーションする方法
MetaTrader 5のためのテクニカル指標 - 10

Description. The basis for the formation of the Renko chart is the price range. If the price goes beyond its limits, the chart shows a box above or below the previous one. As a result, we see price movement without additional "noise" and important support and resistance levels. Features.
For use in conjunction with the Expert Advisor, an additional buffer is implemented-a box counter. For convenience and to increase the speed of testing, the user can use the "new box" event, which the indicator
FREE

Fair Value Gap Finder detects fair value gaps and generates a signal when price returns to one. Set the minimum and maximum fvg size, customize the colors, style, and length, then let the indicator highlight them for you.
Key Features: Automatic FVG highlights - The indicator detects all fair value gaps that fit your criteria and marks them on the chart.
Entry Signal - A signal is created whenever price retests a fair value gap.
Notification - Alerts notify you when a fair value gap or a new
FREE

Clear Signal AI — No‑Repaint Trend Confirmation + Trend Dashboard Clear Signal AI is a trend confirmation indicator built for fast, confident decisions. It combines confirmed on‑chart signals (designed to avoid repainting behaviour), SAR trend structure, multi‑timeframe alignment (M15/H1/H4) and a live confidence score — with a clean dashboard and optional alerts. Product overview Clear Signal AI is designed for traders who want clarity, structure and consistency. It provides: Confirmed trend ar
FREE

HarmonicVision Pro MetaTrader 5用 高度なハーモニックパターン投影エンジン 複数の時間足でハーモニックパターンを手動で識別することは、非常に時間がかかり、エラーが発生しやすい作業です。比率の計算を一つ間違えるだけで、トレードセットアップ全体が無効になり、チャンスを逃したり、誤ったエントリーにつながります。 HarmonicVision Proは、Gartley、Bat、Butterfly、Crab、Deep Crab、Shark、Cypher、Nen Star、5-0、AB=CD、3 Drivesなど15種類以上のハーモニックパターンをリアルタイムで自動検出、検証、投影します。マルチウェーブエンジンが異なるピボット長で最大6つのスキャナーを同時に実行し、スキャルピングからポジショントレードまで、1つのチャートで全てのスタイルをカバーします。 経験豊富なハーモニックトレーダーであっても、フィボナッチベースのパターントレードを始めたばかりであっても、HarmonicVision Proはカスタマイズ可能な投影と組み込みのトレード管理レベルによる、即座かつ正確な
FREE

Market Structure ICT インジケーター 1. 自動化された市場構造 (Market Structure) 最大の利点は、主観的な判断によるミスを減らせることです。 正確なトレンド識別: トレンド継続のための BOS (Break of Structure) と、トレンド反転のための CHoCH (Change of Character) を自動的に識別します。 スイングの分類: ユーザーは市場構造のタイプ(短期、中期、長期)を選択でき、スキャルパーにもスイングトレーダーにも適しています。 2. プロフェッショナル・ダッシュボード 他のタイムフレームを確認するために画面を切り替える必要はありません。 一目でわかる分析: ダッシュボードは、1つの画面にすべてのタイムフレーム(M1からW1)のステータスを表示します。 スコアリングシステム: 小さなタイムフレームからのスコアを集計し、 全体的なバイアス (Overall Bias) (例:「強い強気」や「混在」)を要約します。これにより、自信を持ってエントリーできます。 トレンドの鮮度: BOSが「フレッシュブレイク(発生し

「MACD Ribbon Dynamic PRO:ボラティリティをトレンドに変える」
概要: 「単一のラインに頼るのではなく、市場の深みを見極めましょう。ビットコイン、ゴールド、FXに最適化された、スプレッドエラーのない新世代のトレンドフォロワーです。」
製品詳細: MACD Ribbon Dynamicを選ぶ理由 標準的な指標は、ビットコインやゴールドのような高ボラティリティ資産において、誤ったシグナルを生成しがちです。
MACD Ribbon Dynamicは、多層アルゴリズムを用いて市場ノイズを除去します。
主な機能:
多層分析:単一のシグナルではなく、50本以上の動的分析ラインで、トレンドの真の強さを把握できます。
暗号通貨対応(高値修正):BTCUSDのような10万ドルレベルの資産でも、数学的なエラーなく動作する特別なアルゴリズムです。
スプレッドフリー技術:スプレッドの拡大の影響を受けず、終値に焦点を当てたクリーンな計算を実現します。
トレンドの力:バンドが広がった時にトレンドに入り、狭まった時に利益確定しましょう。
どの通貨ペアと最も

Trend Lines Cross This indicator will alert you on any cross of a Trendline. You can draw up to two trend lines and form a channel, a pennant , a triangle or a simple trend and when the price crosses either trend line the indicator will provide you with alerts that you define plus an up or down arrow when the cross happened. How to: Draw the 1st trendline and name it tl1. Draw the 2nd trendline and name it tl2. Select which type of alerts you would like in the indicator properties and you a
FREE

El indicador utiliza múltiples marcos de tiempo para analizar las mejores entradas de compra en el auge 1000. Está diseñado para ayudar a operar únicamente en picos de auge. el indicador tiene dos flechas; los rojos y azules. la formación de la flecha roja indica que debe estar preparado para una flecha azul que es una señal de entrada de compra. el indicador no ofrece puntos de salida. siempre recopile 3 pips, es decir, si ingresó a una operación a 10230,200, puede salir a 10260,200 con SL a 1
FREE

Ritz MOVAR ALL Filter Ritz MOVAR ALL Filter is a professional multi-timeframe moving average filter designed to help traders clearly identify trend direction, bias, and momentum across all trading instruments. This indicator supports a wide range of advanced moving average algorithms — including Super Smoother, Hull MA, Zero-Lag, ALMA, T3, VWMA, and more — combined with flexible price source modes for precise market filtering. The color-coded line dynamically reflects trend state changes , makin
FREE

デュアルラインシグナル、3レベルシステム、マルチタイムフレームサポート、カスタマイズ可能なビジュアルシグナル、高度に設定可能なアラートシステムを備えた高度なストキャスティクスオシレーター。
ストキャスティクスオシレーターとは? ストキャスティクスオシレーターは、特定の期間における証券の終値を価格範囲と比較するモメンタム指標です。このインジケーターは2本の線で構成されています:%K(メインライン)と%D(シグナルライン、%Kの移動平均)。 ストキャスティクスは0から100の間で振動します。高い読み取り値は買われすぎの状態を示し、低い読み取り値は売られすぎの状態を示します。%Kと%Dラインのクロスオーバー、およびレベル境界を通過する動きは、トレーディングシグナルとして一般的に使用されます。 機能: デュアルラインストキャスティクス(%Kと%D)と3レベルシステム(高、中、低) 3つの独立した設定可能なシグナルバッファを備えたビジュアルシグナルマーカー(矢印、垂直線) 高度なシグナル検出:方向変化、ラインクロス、レベルクロス、両方のラインのピーク/バレー 時間範囲フィルタリング付き設定可
FREE
UT Bot with Alerts The UT Bot Alerts Indicator for MetaTrader 5 is a versatile trading tool that generates buy and sell signals based on ATR-based trailing stop logic. It displays signals with arrows, draws an entry price line, and includes a candle countdown timer. The indicator offers customizable alerts (pop-up, email, push notifications) and a text label showing signal details. Users can adjust ATR sensitivity, label positions, and timer settings, making it suitable for various markets and
FREE
Sigma Indicator is used by Sigma Expert advisor for plotting the zones but now its available for members to apply their stratagies on Sigma supply and demand levels.
Instructions:
1- Donot Change time frames instead run several pairs with different time frames with sigma indicator 2- For exness : Search for smaller zone = True
For other brokers keep it False
3- Maximum zone size = 0
4- Minimum zone size = 0
5 - Back candles = 300
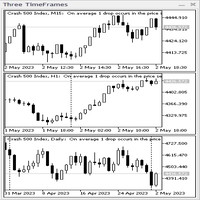
3 つの TimeFrames インジケーター パネル。 インジケーターは、CAppDialog クラスに基づいたパネルの形式で作成されます。パネルは、マウスを使用して最小化したり、現在のチャート上で移動したりできます。 このインジケーターは、パネル内の現在のシンボルの 3 つのタイムフレームを表示します。 現在のバージョンでは、インジケーターには最小限の設定数があります。これらは、「若いタイムフレーム」、「 中間の タイムフレーム 」、「 古い タイムフレーム 」 の 3 つのタイムフレームのパラメーターです 。 インジケーター パネルを起動すると、現在のチャートからすべてのプロパティが自動的にコピーされ、それらが 3 つの時間枠 (たとえば、背景色、バーの色、グリッド、期間区切り記号、ボリュームなど) に適用されます。ただし、インジケーターパネルは、3 つの時間枠のエキスパートアドバイザーやその他のインジケーターをコピーしません。 現在のチャートのプロパティを変更した場合、3 つの時間枠に対する変更は、インジケーター パネルを削除して再接続した後、または現在のチャートの時間枠を切り

このインジケーターは実践的なトレードに最適な自動波動分析のインジケーターです! 場合...
注: Tang Lun (Tang Zhong Shuo Zen) の命名規則の影響で、私は波のグレーディングに西洋の名前を使用することに慣れていません。基本的な波を ペン 、二次波のバンドを セグメント と名付けました。同時に、 セグメント にはトレンドの方向が指定されます (この命名方法は将来のノートで使用されます。最初に言っておきます)。ただし、アルゴリズムは曲がりくねった理論とはほとんど関係がないため、付けるべきではありません。これは、私の市場分析 によって要約された、絶えず変化する複雑な運用ルール を反映しています。
バンドは標準化され、人によって異なることがないよう定義されており、市場参入を厳密に分析する上で重要な役割を果たす人為的な干渉の描画方法が排除されています。
このインジケーターを使用することは、取引インターフェイスの美しさを改善することと同等であり、元の K ライン取引を放棄し、取引の新しいレベルに連れて行きます。また、宣伝の観点から顧客の認識も向上します。 イ

Ekom Spike Detector Pro
Take your trading to the next level with the Ekom Boom and Crash Spike Detector Indicator Pro, designed for serious traders who demand more. This advanced version provides: Key Features: Accurate Spike Detection: Identify high-probability spike patterns in real-time using price action Clear Visual Signals: Displays clear buy and sell arrows on the chart for easy decision-making Alert options : MT5 Alert/Notification to receive alerts on your mobile when signal
すべての無料商品を見るにはここをクリック
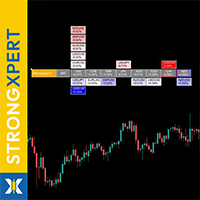
StrongXpert は、世界の通貨市場における リアルタイム強弱を正確に監視するツール です。 このツールは、 資金が実際にどこへ流れ込んでいるのか - そしてどこから市場を離れているのか を示すために開発されました。 このインジケーターは 主要8通貨(USD, EUR, GBP, JPY, AUD, CAD, CHF, NZD)の相対的な強さ を測定し、 複雑な価格変動をシンプルで読みやすいビジュアルパネルへと変換します - しかもチャート上に直接表示されます。 最強通貨と最弱通貨を数秒で識別できます - セットアップの確認、 トレンド方向のフィルタリング、反転ポイントの判断に最適です。 推測も憶測も不要 - 必要なのはリアルタイムの明確な市場構造だけです。 多くの強弱系インジケーターが単純計算や遅延値のみを表示するのに対し、 StrongXpert は 連続リアルタイム分析 を採用し、市場フェーズに応じて動的に適応します。 毎秒更新される正確な通貨間の強弱バランスが表示され - 遅延なし、 リペイントなし、妥協なし。 市場の動
FREE

Improved version of the free HMA Trend indicator (for MetaTrader 4) with statistical analysis. HMA Trend is a trend indicator based on the Hull Moving Average (HMA) with two periods. HMA with a slow period identifies the trend, while HMA with a fast period determines the short-term movements and signals in the trend direction.
The main differences from the free version: Ability to predict the probability of a trend reversal using analysis of history data. Plotting statistical charts for analyzi

Multi timeframe ZigZag indicator. It displays the support/resistance horizontal lines and their breakouts, as well as draws the current targets of the market. It can also display lines of the Fractals indicator and candles from other periods (up to Quarterly). So, you can actually see the supply and demand levels. Indicator – connects key lows and highs to show trend lines. You can also use it as indicator for the Break of Structure(BOS) & Market Structure Shift(MSS). The indicator redraws the

# Simple Fibo MT5 - Professional Fibonacci Indicator A lightweight and efficient Fibonacci retracement indicator designed for professional traders who need clean, automatic technical analysis without chart clutter. This indicator automatically identifies swing highs and lows, draws Fibonacci levels, detects key Support/Resistance zones, and displays a real-time candle countdown timer.
Perfect for day traders, swing traders, and scalpers who rely on Fibonacci retracements and key price levels f
FREE

このインジケーターは、ジグザグインジケーター、取引セッション、フラクタル、またはローソク足(非標準の時間枠:年、6 か月、4 か月、3 か月、2 か月を含む)に基づいてフィボナッチ レベルを自動的に描画します(自動フィボ リトレースメント)。 フィボナッチ計算には、より高い時間枠を選択できます。 現在のバーが閉じるたびにレベルが再描画されます。 指定したレベルを超えたときにアラートを有効にすることができます。
履歴のレベルを分析することもできます。 これを行うには、「過去の Fibo レベルの数」パラメーターで Fibo レベルの数を指定する必要があります
パラメーター Calculate Fibo according to — フィボナッチ計算モード: Candles (High-Low) — 高値-安値に基づいてフィボナッチを構築します。 Candles (Close-Close) — 終値-終値に基づいてフィボナッチを構築します。 ZigZags — ZigZag ポイントによって Fibo を構築します。 Sessions — 取引セッションごとに Fibo を構築し
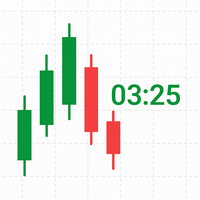
TimeLeftCandle – Countdown Clock for Candles in MT5 Overview
TimeLeftCandle is an indicator for MetaTrader 5 that displays in real time the remaining time until the current chart candle closes. Its design is minimalist, clear, and movable, adapting to any type of chart and trading style. Ideal for traders who need to precisely track candle closing times and make timely decisions. Main Advantages Clear and precise display: A digital-style counter to know exactly how much time is left before the
FREE

VR Sync Chartsは、ウィンドウ間レイアウトを同期するためのツールです。 VR Sync Chartsではトレンドレベル、水平レベルとフィボナッチレイアウトが全チャートと同期できます。 本ソフトウェアでMetaTraderターミナルでの各種標準グラフィックオブジェクトを同期し、全てのトレンドやガーン線などを正確に隣接のチャートへコピーできます。 線とレイアウトを手動ではなく、自動的にコピーできます。以下の図とビデオでは、VR Sync Chartsの動作を評価できます。 推薦: インジケーターを全チャートにセットしてください。 ターミナル設定で「ダブルクリックでオブジェクトを選択」を有効にしてください。 ストラテジーテスターではプログラムをテストできないため、以下のビデオをご覧ください。 メリット 各種グラフィックオブジェクトを同期できます チャートを各種時間枠と同期できます 全てのアップデートは無料です 初心者でもプロでもご利用できます 設定が少なく、同期アイテムを選択できます Forex、CFD、Crypto、Metallis、Futuresなどの各種金融ツールがサポート

The indicator that shows the countdown to the change of candles is equipped with an alert when the bar changes (the alert is not active if installed on the M1 time frame). Displays seconds if installed in time frame M1, displays minutes and seconds if installed in time frame above M1, and displays hours and minutes if installed in time frame h1 and above. The time displayed is calculated based on the running time.
FREE

Ritz Trinity Scanner – Reversal & RSI Sentiment Ritz Trinity Scanner is a clean and focused reversal detection indicator powered by RSI sentiment analysis and short-term trend validation. The indicator scans price action to identify early bullish and bearish reversal points , filtering signals with RSI overbought/oversold zones and recent market sentiment. Visual arrows highlight potential reversals directly on the chart, while optional alerts, push notifications, and emails keep traders informe
FREE

The worktime indicator helps you identify the most important times to day to trade the currency pairs. It was created based on the ICT day trading free tutorials that are freely vailable on his youtube channel. You can use this indicator together with my other indicators that i have shared freely with you like the true day, custom periods, daily month, weekly open lines - they together complement each other very well.
Nuggets from this indicator: 1. Draws the asian session box showinng you the
FREE

Nova Oscillator 高度オシレーターマトリックス — 5つの分析レイヤーを1つのインジケーターに統合 ほとんどのオシレーターは市場の一次元しか表示しません。モメンタムまたは出来高は確認できますが、両方を意味のある形で同時に見ることはほとんどありません。これによりトレーダーは複数のインジケーターを重ねることを余儀なくされ、それぞれが異なるストーリーを伝えるため、高確度のセットアップを見つけることが困難になります。 Nova Oscillatorは、5つの強力な分析レイヤーを1つのサブウィンドウに統合することでこの問題を解決します:Hyper Waveモメンタム、Smart Money Flowトラッキング、コンフルエンス検出、リバーサルシグナル、自動ダイバージェンス識別。すべてのコンポーネントが連携して、市場状況の統一された多次元ビューを提供します。 素早いモメンタムシフトを狙うスキャルパーであっても、出来高に裏付けられた高確率リバーサルを求めるスイングトレーダーであっても、Nova Oscillatorは自信を持った取引判断に必要な明確さを提供します。 詳細はこちら: 詳細
FREE
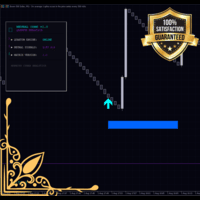
Monet Signal Master - Advanced Neural Trading System Version 1.00 Author: MONETFX Introduction Monet Signal Master is a professional technical indicator for MetaTrader 5 that generates non-repainting buy and sell signals using advanced multi-oscillator analysis. The indicator combines Stochastic and RSI crossovers with SuperTrend filtering to identify high-probability trading opportunities. Features include a cyberpunk-style dashboard, visual risk management zones, and comprehensive alert system
FREE

NeoBull Predictive Rangesは、MetaTrader 5向けの包括的なテクニカル分析システムです。高度なボラティリティ計算とボリュームベースのトレンド分析を1つのインジケーターに統合しています。このツールは、市場構造とオーダーフローに関する正確な情報をトレーダーに提供するために開発されました。 このプロフェッショナルなツールをコミュニティに無料で提供します。 コンセプトと背景 この戦略的基盤と特定のインジケーター(Predictive Ranges & Volumatic VIDYA)の組み合わせは、YouTubeチャンネル「TradingWerkstatt」の分析に基づいています。このロジックはMetaTrader 5用に正確に移植され、技術的に最適化されています。 機能と技術的詳細: Predictive Ranges (動的ボラティリティチャネル) インジケーターは、適応型のサポートおよびレジスタンスゾーンをチャート上に投影します。計算はRMA平滑化されたAverage True Range (ATR)に基づいています。 Volumatic VIDYA (ト
FREE

Boom and crash Gold Miner v2 trend histogram which works in conjunction with the indicator above that has arrows as shown in the video. PLEASE Note: That the top indicator and the bottom indicator are two separate indicators. the top indicator is https://www.mql5.com/en/market/product/98066 the bottom one is free. which is the histogram at the bottom. the trend histogram trading tool that helps to easy detect the trend blue color indicates an uptrend. Orange color is a down trend.
FREE

Description:
The Dynamic Color Stochastic is an enhanced version of the classic Stochastic Oscillator that provides instant visual feedback on market momentum through color-coded line transitions. Unlike the standard indicator, this version automatically changes the color of both the Main (%K) and Signal (%D) lines based on their relative positions. This allows traders to identify bullish and bearish crossovers instantly without squinting at the lines. Bullish Momentum (Green): When the Main
FREE
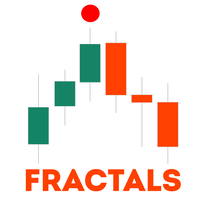
このインジケーターは、価格チャート上にフラクタルを表示し、トレーダーが重要な局所的な高値・安値を特定するのに役立ちます。フラクタルとは、クラシックな定義に基づいた特別なポイントであり、中央のローソク足が両隣の2本のローソク足よりも高い場合に局所的な高値が形成され、中央のローソク足が両隣の2本よりも低い場合に局所的な安値が形成されます。 その他の製品 -> こちら 主な機能と利点 : 柔軟な表示 — インジケーターは、上位・下位のフラクタルを円、四角形、三角形などのさまざまなシンボルで視覚化できます。 カスタマイズ可能な色 — チャート上の視認性を向上させるためにカラースキームを調整できます。例えば、上昇フラクタルを緑、下降フラクタルを赤に設定することが可能です。 調整可能なオフセット — 垂直方向のオフセットを設定することで、フラクタルマーカーを適切に配置し、ローソク足との重なりを避けることができます。 すべての時間枠に対応 — インジケーターは、1分足(M1)から月足(MN)まで、すべての時間枠で正しく動作するため、汎用的なツールとして使用できます。 あらゆる金融資産に適用可能 —
FREE

Overview
The Fair Value Gap (FVG) Indicator v3.0 is a professional tool for MetaTrader 5 designed to detect and visualize market imbalances (inefficiencies) in real time. This indicator identifies areas where the price has left liquidity gaps, which often act as price magnets or support/resistance zones.
Key Features
Automatic Detection: Accurately identifies bullish and bearish FVGs. Multi-Timeframe (MTF): Monitors up to 8 timeframes simultaneously on a single chart. Inverse FVG (IFVG): Det
FREE

Understanding the levels of the previous day or week is very important information for your trading.
This indicateur allow to draw Previous day High/Low Previous week High/Low
Congifuration High & Low for: Previous day, week Line Style, color Label position, size, color Any questions or comments, send me a direct message here https://www.mql5.com/en/users/mvonline
FREE
Trader Dynamic Index Added Signal – 市場コンテキストを重視した科学的アプローチによるオシレーター分析 1. はじめに 現代のテクニカル分析において、 従来のオシレーターは孤立したシグナルを提供することが多く 、 市場のコンテキスト から切り離されているため、誤ったシグナルや信頼性の低いシグナルが多発します。
Trader Dynamic Index Added Signal (TDI-AS) はこの問題を解決するために開発され、 オシレーターによるシグナル生成を再定義し、市場コンテキストをシグナル検証の最重要条件 としています。 2. 理論的枠組み 2.1. コンテキスト – 信頼できるシグナルの鍵 TDI-AS におけるコンテキストは、 価格モメンタムの動的閾値 として定義され、 支配的なトレンド、市場リズム、価格の歪み、ノイズレベル を含みます。 コンテキストがない場合 、売買シグナルは構造的裏付けのない局所反応となり、 勝率が大幅に低下 します。 コンテキストがある場合 、シグナルは市場の主要な波動と同期し、精度と安定性が向上します。 2.2.

Weis Wave Scouter Basic は、MetaTrader 5 用に設計された当社の有名なインジケーターの基本バージョンであり、Wyckoff 手法と VSA(ボリュームスプレッド分析)の概念を手軽かつ効率的に探求したいトレーダー向けに設計されています。ボリュームウェーブの読み取りに基づいており、市場の動きを明確に特定でき、リチャード・ワイコフが教えた「労力と結果」「需給」の原則に焦点を当てています。 Weis Wave Scouter Basic を使用すると、標準カラー(Classic)テーマの直感的なヒストグラムで上昇波と下降波を視覚化でき、トレンドや反転を簡単に解釈できます。Brick Size や Volume Scale Factor などの基本的な調整が可能で、ティックボリュームまたは実際のボリュームを選択できるため、FX、株式、暗号資産などさまざまな市場で柔軟に使用できます。初心者やシンプルなツールを求めるトレーダーに最適な Weis Wave Scouter Basic は、Wyckoff と VSA の技術を取引に活かすための理想的な出発点です。 We
FREE

KT Price Border は、3本のバンドで構成された価格チャネルを作成し、市場のスイングハイとスイングローの可能性がある領域を特定します。これらのレベルは、動的なサポートおよびレジスタンスとしても使用できます。 中央のバンドは、トレンドの方向を識別するためにも使用できます。そのため、このインジケーターはトレンドフォロー型の指標としても機能します。さらに、使いやすさとシンプルなトレードシグナルにより、初心者トレーダーにとって非常に有益です。
特徴
ほとんどの FX 通貨ペアで優れたパフォーマンスを発揮します。 短時間足と長時間足の両方で使用可能です。 スキャルピング、デイトレード、スイングトレードに適しています。 トレンドフォロー戦略と逆張り戦略の両方に対応しています。 価格がバンドを超えたときにアラートを送信できます。 価格バンドは、動的なサポートおよびレジスタンスレベルとして機能します。
価格境界の概念を理解する このインジケーターは、ボリンジャーバンドと同様に機能します。下部バンドは、市場の売られ過ぎ状態を示し、動的なサポートとして機能します。 上部バンドは、市場の
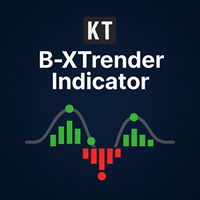
KT B-Xtrender は、元々 Bharat Jhunjhunwala 氏が IFTA ジャーナルで紹介したトレンド追随型ツールを元に改良された高度なバージョンです。私たちはそのコンセプトを洗練し、より正確なシグナルと内蔵アラートを組み込むことで、トレンド相場でより有利なチャンスを見つけやすくしました。 さまざまな時間足で使用できますが、特に4時間足(H4)や日足(Daily)などの高い時間足で最も優れた性能を発揮します。
特徴
二重トレンド視点: 短期と長期の両方のトレンドを同時に分析し、小さな押し目なのか、本格的なトレンド転換なのかを分かりやすく判断できます。 明確なシグナル: シンプルな買い・売りシグナルに加えて、ポジション増減のポイントも示し、取引管理をより自信をもって行えます。 短期ヒストグラム: 大きなトレンドの中における短期的な調整局面を視覚化します。緑は強いモメンタム、赤は短期的な弱さを示します。 長期ヒストグラム: RSI で滑らかにした複数の移動平均を組み合わせ、市場の主要トレンド方向を追跡します。 トレンド一致確認: 両方のヒストグラムが同じ方向を示し

Did You Have A Profitable Trade But Suddenly Reversed? In a solid strategy, exiting a trade is equally important as entering.
Exit EDGE helps maximize your current trade profit and avoid turning winning trades to losers.
Never Miss An Exit Signal Again
Monitor all pairs and timeframes in just 1 chart www.mql5.com/en/blogs/post/726558
How To Trade You can close your open trades as soon as you receive a signal
Close your Buy orders if you receive an Exit Buy Signal. Close your Sell orders if

ブームおよびクラッシュスパイク検出器インジケーターは、主に価格のブームおよびクラッシュを検出するための高度な戦略に基づいてコーディングされています。 価格の高確率のブームとクラッシュを検出するために、複雑なアルゴリズムが組み込まれました。 ブームまたはクラッシュフェーズの可能性について警告します。
ブームフェーズ:価格の上昇が速すぎる場合。 クラッシュフェーズ:価格の低下が速すぎる場合。
期間限定オファー:インジケーターは30ドルと生涯でのみご利用いただけます。
主な機能
プッシュ通知を携帯電話に送信します コンピューターまたはラップトップでポップアップしてアラートを鳴らします 再描画されない矢印を表示します(潜在的なブームの場合は上向きの矢印、潜在的なクラッシュの場合は下向きの矢印) すべてのペアでの作業。
おすすめ
時間枠:H1およびH4 ペアの推奨:トレンドフェーズのペア。
コンタクト
ご不明な点がある場合やサポートが必要な場合は、プライベートメッセージでご連絡ください。
著者
SAYADI ACHREF、fintechソフトウェアエンジニアおよびFinansyaの

The indicator plots a trend channel using the technique by Gilbert Raff. The channel axis is a first-order regression. The upper and lower lines show the maximum distance the Close line had moved away from the axis line. Therefore, the upper and lower lines can be considered as resistance and support lines, respectively. A similar version of the indicator for the MT4 terminal
As a rule, most movements of the price occur within a channel, going beyond the support or resistance line only for a sh
FREE
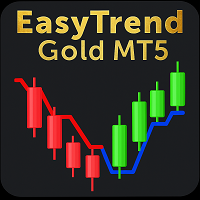
複雑なインジケーター、特にボラティリティの高いゴールド市場での取引にうんざりしていませんか?EasyTrend Gold MT5は、あらゆる時間足でゴールドのボラティリティを抑制するために設計されました。ATRの力を活用して、ゴールドの急激な動きを、ノイズを排除した一本の明確でダイナミックなトレンドラインに変換します。 M1でのスキャルピングであれ、H4でのスイングトレードであれ、トレンドの方向性と強さを視覚化し、レンジ相場(持ち合い期間)を容易に特定し、XAU/USDでいつ行動すべきかについての直感的な洞察を得ることができます。 その他の推奨資産 EasyTrendはゴールドのようなボラティリティの高い資産に最適化されていますが、そのロジックは、強いトレンドで知られる様々な市場でも非常に効果的です。 主要FX通貨ペア: EUR/USD, GBP/USD, USD/JPY 株価指数: US500 (S&P 500), US100 (NASDAQ), GER30 (DAX) 暗号資産: BTC/USD (ビットコイン), ETH/USD (イーサリアム) 商品 (コモディティ
FREE

Supply or demand zones refer to price areas where a significant amount of supply or demand had previously entered the market, causing prices to either fall or rise. If the price returns to the demand or supply zone, it is likely to bounce off due to the large number of orders previously placed within the zone. These orders will be defended in these areas.
The Fair Value Gap (FVG) is a concept used to identify imbalances in the equilibrium of buying and selling. Fair Value Gaps are formed in a t
This indicator helps you monitor multiple currency pairs and timeframes all at once. It displays the occurrence of divergences between price and the MACD indicator in a clear and easy-to-read table. Monitoring multiple timeframes and currency pairs in one place helps traders identify a divergence without needing to switch between charts. Divergences can be bullish or bearish. For example, if the price forms a higher high while the MACD forms a lower high, this indicates bearish divergence. On th

MTF VWAP Indicator - Quick Overview This indicator shows you where institutional money is flowing across multiple timeframes using Volume Weighted Average Price (VWAP) to identify high-probability trading zones. What It Actually Does: 1. Tracks Smart Money Levels: - Shows Daily, Weekly, and Monthly VWAP lines where big players (banks, funds) are trading - Tells you if price is above or below these key institutional levels - Shows distance from VWAP as a percentage (tells you how extend

The indicator returning pivot point based trendlines with highlighted breakouts . Trendline caculated by pivot point and other clue are ATR, Stdev. The indicator also includes integrated alerts for trendlines breakouts and foward message to Telegram channel or group if you want. Settings · Lookback bar: Default 200 is number of bar caculate when init indicator. · Length: Pivot points period · Slope Calculation Method: Determines how this lope is calculated. We supp
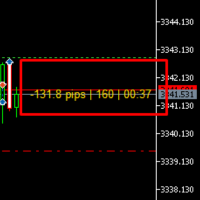
Ultimate Trading Companion Indicator for MT5
Hi there!
This intelligent and easy-to-use indicator is designed to give you a clear edge in the market. It shows: Live Pips of Open Trades – Instantly see how much you're gaining or losing in pips. Candle Countdown Timer – Know exactly when the current candle will close. Real-Time Spread Display – Stay aware of market conditions and avoid bad entries. Fully Customizable Colors – Choose your own Profit, Loss, and Neutral display colors for a clean a

Description :
VWAP (Volume-Weighted Average Price) is the ratio of the value traded to total volume traded over a particular time horizon. It is a measure of the average price at which pair is traded over the trading horizon. Read More.
All Symbols and All Timeframes are supported.
Indicator Inputs :
VWAP Mode : Mode of VWAP Calculation. Options can be selected : Single,Session,Daily,Weekly,Monthly
Volumes : Real Volumes,Tick Volumes
Price Type : Used price for calculating. O

It predicts the most likely short-term price movement based on advanced mathematical calculations.
Features Estimation of immediate price movement; Calculation of the real market trend; Calculation of the most important support and resistance levels; Algorithms optimized for making complex mathematical calculations with a minimal drain of system resources; Self-adjusting for better performance, so it’s able to work properly at any symbol (no matter how exotic it is) and any timeframe; Compatibl
Ekom Spike Detector
Navigate the volatile world of Boom and Crash indices with the Ekom Spike Detector Indicator. This powerful tool detects explosive price movements, providing traders with precise buy and sell signals 24/7.
Key Features:
Spike Detection : Identify high-probability spike patterns in real-time Clear Visual Signals : Displays clear buy and sell arrows on the chart for easy decision-making Customizable : Easily switch from either Boom based on individuals choice Reliable : Te
FREE

Fractals Dynamic Fractals Dynamic – これで、フラクタルダイナミックインジケーターに基づく、またはそれに基づくすべての取引戦略に追加のシグナルが表示されます。 さらに、フラクタルはサポートレベルと抵抗レベルとして機能することができます。 そして、いくつかの取引戦略では、流動性レベルを示しています。 この目的のために、このバージョンのマルチフラクタルおよびマルチフレームインジケータ MultiFractal Levels でレベルが導入されました。 あなたは、この指標は、より有益な視覚的かつ任意の価格チャート上のあなたの取引のアシスタントとして有用であることがわかります。 あなたの取引システムへの追加として Fractals Dynamic 指標を使用してください
また、市場で私の他の製品を試してみてください https://www.mql5.com/ru/users/capitalplus/seller
インジケーターが気に入った場合は、評価してレビューを残してください。私にとって非常に重要です。
取引で大儲け!
FREE

AW スーパー トレンド - これは、最も人気のある古典的なトレンド インジケーターの 1 つです。シンプルな設定で、トレンドだけでなく、このインジケーターによって計算されるストップロスレベルも表示できます。 利点:
楽器: 通貨ペア 、株、商品、指数、暗号通貨。 時間枠: М15 以上。 取引時間:24時間。 現在のトレンドの方向を示します。 ストップロスを計算します。 取引を行うときに使用できます。 3 種類の通知: プッシュ、メール、アラート。 MT4版 -> HERE / ニュース - HERE 機能:
インジケーターは、現在のトレンド方向を対応する色で表示します。
- 青色は、現在の時間枠で使用されているシンボルの上昇トレンドを示します。
- 線の赤い色は、選択したシンボルで使用された時間枠の下降トレンドを示します。
インディケータはストップロスを設定するために使用できます。
指標線はバーの上ではなく、バーに対していくらかシフトして表示されます。トレンド ラインが表示されるこの場所は、トレーダーがストップ ロスを設定するために使用できます。 ト
FREE

FTU Moving Average Alert mt5
Alert for price touch and close of moving average Any moving average type Alert sound file option Alert on touch or close over
Usage : Attach indicator from market folder, change type of moving average, style etc
Set alert type
Note: sound folder location is within appdata folder see image, copy wav file into this folder, then change file name within input eg: news.wav / chime.wav / 'anysound'.wav
FREE
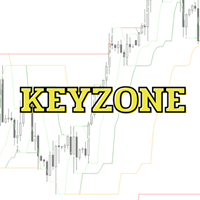
Keyzoneは、 サポートとレジスタンスレベルを識別するために設計されたインジケーター であり、 4つの主要レベル (3、8、21、89) に分類されます。これらのレベルは、 Smart Money Concept (SMC) を高度に応用したもので、高い効率性を保ちながらシンプルに使用できます。 その シンプルかつ強力な設計 により、Keyzoneはさまざまなトレードスタイルに適用できます:
スキャルピング – 短時間での高頻度トレード スイングトレード – 中期的な値動きを狙う トレンドフォロー – 長期の市場トレンドを追う たった4本のライン だけで、市場分析が可能になり、 複雑なSMCの概念を使わずに取引ができる ようになります。初心者でも 素早く学び、Keyzoneを活用することが可能 です!
Keyzone インジケーターの使い方 レンジ相場(ボックス相場の取引) レンジ相場では、Keyzone のレベルが サポートとレジスタンスのゾーン として機能します。 買いエントリー :価格が下位の Keyzone で反転したとき。 売りエントリー :価格が上位の Keyzone
FREE

This indicator draws regular bullish and bearish divergences in real-time onto the charts. The algorithm to detect those divergences is based on my 10+ years experience of detecting divergences visually. The divergences are drawn as green and red rectangles on the charts. You can even do forward testing in the visual mode of the strategy tester.
Parameters Fast EMA Period: The period of the fast EMA of the MACD. Default value is 12.
Slow EMA Period: The period of the slow EMA of the MACD. Defau
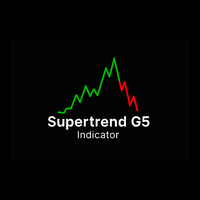
Supertrend G5 Indicator Supertrend G5 is a high-performance trend-following tool designed to accurately identify market reversal points. By displaying a color-coded line directly on the chart, this indicator helps you quickly recognize bullish trends (green) and bearish trends (red), supporting optimal entry and exit points. Key Features: Clear Buy/Sell Signals Buy when the Supertrend line changes from red to green (beginning of an uptrend). Sell when the Supertrend line changes from green to re
FREE

This indicator converted from 5 min Buy and Sell Range Filter - guikroth version on TradingView Popularity of the Range Filter
The Range Filter is a very popular and effective indicator in its own right, with adjustments to the few simple settings it is possible to use the Range Filter for helping filter price movement, whether helping to determine trend direction or ranges, to timing breakout or even reversal entries. Its practical versatility makes it ideal for integrating it's signals into a

「Agulhadas」戦略を発見しよう この戦略は、ブラジル市場で人気のあるコンセプトに着想を得たもので、トレンド、市場の強さ、モメンタムに基づいてエントリーおよびエグジットポイントを特定するために、5つのテクニカル指標を組み合わせています。使用されている指標の中には、有名なDidiインデックスもあり、これは移動平均線のクロスを示すことで知られており、Odair Aguiarによって開発されました。 株式スキャナーをこちらからダウンロード 使用されている指標 Didiインデックス ADX ボリンジャーバンド Trix ストキャスティクス この戦略の仕組み あらかじめ定義された条件に基づいて、チャート上に買いと売りの矢印を表示します。また、エグジットポイントには「X」を表示します。 買いシグナル エントリーポイントを確認するために、以下の3つの条件が観察されます: ADXが上昇トレンド ADXが32以上、または上昇中で、DI+がDI-を上回っている。 Didiインデックスのゴールデンクロス 短期平均線が中期平均線を上抜け。 ボリンジャーバンドが拡大 上下のバンドが同時に広がっている。 売
FREE

The Heikin Ashi indicator is our version of the Heikin Ashi chart. Unlike competitor products, this indicator offers extensive options for calculating Heikin Ashi candles. In addition, it can be displayed as a classic or smoothed version.
The indicator can calculate Heikin Ashi with moving average by four methods: SMA - Simple Moving Average SMMA - Smoothed Moving Average EMA - Exponential Moving Average LWMA - Linear Weighted Moving Average
Main features The indicator shows Heikin As
FREE

SHOGUN Trade - 16年間無調整の衝撃。戦略的市場構造と損小利大の極意 2月スペシャルセール – 特別価格 $99(通常価格 $249)! この特別オファーは 2月28日 までの期間限定です。 私たちは現在、 さらなる製品開発と最適化 に注力しております。皆様からの貴重なフィードバックを製品に反映させるため、レビューへのご協力を条件にこの割引価格で提供させていただきます。皆様からいただくご意見は、次回のアップデートや新機能の追加に直接活用させていただきます。 ショーグントレードプロ ~「迷い」を断ち切り、将軍の視座を手に入れる。ダウ理論・市場構造分析スイート~ MT4版はこちらをクリックしてください https://www.mql5.com/ja/market/product/158467 1. はじめに:なぜ、多くのトレーダーは「森」で迷うのか? あなたは、目の前の1分足の値動きに翻弄され、感情的なエントリーで資金を減らしていませんか? 戦場で地図を持たずに走り回る兵士は生き残れません。生き残るのは、高台から戦況全体を俯瞰し、勝てる局面でのみ兵を動かす**「将軍(Com
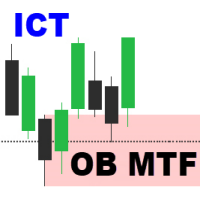
Order Block Multi Timeframe The Order Block Multi Timeframe is a powerful tool for Smart Money Concept (SMC) traders, combining high-accuracy Order Block detection with real-time Break of Structure (BOS) and Change of Character (CHoCH) analysis across multiple timeframes. Smart Money Insight, Multi-Timeframe Precision This indicator automatically identifies institutional Order Blocks —key price zones where large players have entered the market—and plots them directly on your chart. It also track

Pure Trend Logic MT5 — Профессиональный алгоритм следования за трендом Pure Trend Logic MT5 — это воплощение классической торговой стратегии в современной интерактивной оболочке. Индикатор предназначен для трейдеров, которые ценят чистоту графиков и математическую точность. Система объединяет три уровня анализа цены, позволяя находить точки входа с математическим преимуществом. ### Философия индикатора: В основе лежит «золотое правило» трейдинга: торгуй по направлению основного потока. Мы взяли
FREE
REVERSAL POWER PRO
The ONLY Indicator That Shows You Where Markets WILL Reverse - BEFORE They Move
WELCOME TO THE NEXT LEVEL OF TRADING PRECISION
Tired of guessing where the market will turn? Missing entries because you don't know where support/resistance REALLY is? Getting stopped out at "fake" levels? Wondering if your bias is correct before entering?
What if you had: Crystal-clear Supply/Demand Zones that markets RESPECT Daily Bias Engine telling you market directio
FREE

Currency Strength Meter is the easiest way to identify strong and weak currencies. This indicator shows the relative strength of 8 major currencies + Gold: AUD, CAD, CHF, EUR, GBP, JPY, NZD, USD, XAU. Gold symbol can be changed to other symbols like XAG, XAU etc. By default the strength value is normalised to the range from 0 to 100 for RSI algorithm: The value above 60 means strong currency; The value below 40 means weak currency;
This indicator needs the history data of all 28 major currency
The VSA (Volume Spread Analysis) Volume Indicator is a powerful technical tool used by traders to analyze the relationship between price movement and trading volume. Rooted in the Wyckoff methodology, VSA helps identify imbalances between supply and demand, revealing the hidden actions of institutional players—often referred to as “smart money.” This indicator evaluates three key elements: volume, price spread (the difference between high and low), and closing price. By interpreting these facto
FREE
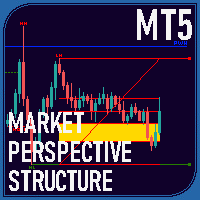
Overview The Market Perspective Structure Indicator is a comprehensive MetaTrader indicator designed to provide traders with a detailed analysis of market structure across multiple timeframes. It identifies and visualizes key price action elements, including swing highs and lows, Break of Structure (BOS), Change of Character (CHOCH), internal structures, equal highs/lows, premium/discount levels, previous levels from higher timeframes, and trading session zones. With extensive customization opt

Super Signal Series – V2 PRO Falcon Real Time Trend Rider Signals – Professional MT4 Dashboard Exclusive FREE Bonus Exclusive Bonus When you purchase this indicator, you receive 2 professional Gold EAs: MT4 Gold EA
XAU Trend Matrix EA – Worth $150 : See the EA https://www.mql5.com/en/market/product/162870 MT5 Gold EA
XAU Steady Gain Pro – Worth $150 : See the EA https://www.mql5.com/en/market/product/162861 Total Bonus Value: $300 Product Description Falcon Trend Rider Signals is a
hello,
king binary sureshot mt5 binary indicator,
1 minute candle
1 minute expire
Alright. This indicator works on MT5 and is very easy to use. When you receive a signal from it, you wait for that candle with the signal to close and you enter your trade at the beginning of the next new candle. A red arrow means sell and a green arrow means buy. All arrows comes with a long dotted like for easy identification of trade signal. Are you okay with that?
FREE

Advanced Trend Analyzer Pro MT5 The Ultimate Multi-Strategy Trend Analysis System That Never Repaints Transform Your Trading with Professional-Grade Market Analysis Advanced Trend Analyzer Pro MT5 is a revolutionary indicator that combines Fuzzy Logic , Multi-Timeframe Analysis , and Currency Strength Technology into one powerful trading system. Designed for serious traders who demand precision, reliability, and consistent performance across all market conditions. Why Choose Advanced Tr
My other indicators: https://www.mql5.com/en/market/product/156702 https://www.mql5.com/en/market/product/153968 (FREE) https://www.mql5.com/en/market/product/153960 (FREE)
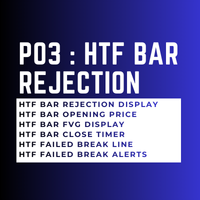
This indicator displays higher timeframe candles directly on your lower timeframe chart. It allows you to monitor higher timeframe price action without switching between charts. What This Indicator Does: The indicator places candles from a selected higher timeframe (such as H4, Daily, or Weekly) onto your current chart. This
FREE

[Power Volume Candle] - Indicator to see the comparison of bullish and bearish volume
Volume comparison indicator on candlestick, by calculating the volume value of the specified candle history to determine the percentage of volume strength. calculates the percentage comparison of each time frame displayed on 1 screen. Subscribe the MQL5 channel for other interesting information : (Automatic) Forex Tools Join new Public Group to Expressing Opinions and Sharing: Auto Fx Investment See other
FREE
MetaTraderプラットフォームのためのアプリのストアであるMetaTraderアプリストアで自動売買ロボットを購入する方法をご覧ください。
MQL5.community支払いシステムでは、PayPalや銀行カードおよび人気の支払いシステムを通してトランザクションをすることができます。ご満足いただけるように購入前に自動売買ロボットをテストすることを強くお勧めします。
取引の機会を逃しています。
- 無料取引アプリ
- 8千を超えるシグナルをコピー
- 金融ニュースで金融マーケットを探索
新規登録
ログイン