适用于MetaTrader 5的技术指标 - 10

Easy Trend , as the name implies, is an indicator that easily shows the prevailing trend by bringing several indicators into one. The strategy is: when all indicators point in the same direction a signal is triggered. When red, is a signal to sell, when blue, signal to buy. It is that simple :) There are a total of 9 indicators: Moving Average, RSI, CCI, Parabolic SAR, William's Range, Stochastic, MACD, ADX and Heiken Ashi. It is possible to configure each of these indicators to suit your way of
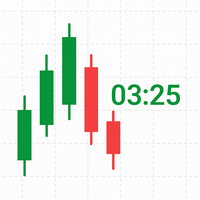
TimeLeftCandle – Countdown Clock for Candles in MT5 Overview
TimeLeftCandle is an indicator for MetaTrader 5 that displays in real time the remaining time until the current chart candle closes. Its design is minimalist, clear, and movable, adapting to any type of chart and trading style. Ideal for traders who need to precisely track candle closing times and make timely decisions. Main Advantages Clear and precise display: A digital-style counter to know exactly how much time is left before the
FREE

Renko是一个永恒的图表,也就是说,它不考虑时间段,而是考虑价格变化,这使得图表上的价格变化更加清晰。
Hyper Renko是提供此功能的指标。
要进行配置,您只有一个参数,即您要使用的对号*中蜡烛的大小。
*勾号:是资产的最小可能变化。
感谢您选择超级交易者指标。
维基百科: 连环图表示变量值(例如金融资产的价格)随时间变化的最小变化。仅当所考虑的值(例如价格)变化了某个最小数量时,图形才会随着时间前进。例如,在考虑资产价格R $ 1变动的Renko图表上,仅当变动发生时(向上或向下)才绘制新的“砖”-不管变动发生了多长时间以及交易量。因此,如果在水平轴上绘制时间,在垂直轴上绘制价格变化,则所有“砖”的高度都相同(价格变化相同),尽管它们在视觉上相同,但它们之间的间距却代表不同的时间量。
FREE

Stargogs Spike Catcher V4.0 This Indicator is Developed To milk the BOOM and CRASH indices .
Now Also work on weltrade for PAIN and GAIN indices. Send me Message if you need any help with the indicator. CHECK OUT THE STARGOGS SPIKE CATCHER EA/ROBOT V3: CLICK HERE ALSO CHECK OUT SECOND TO NONEFX SPIKE CATCHER: CLICK HERE STARGOGS SPIKE CATCHER V4.0 WHATS NEW! Brand New Strategy. This is the Indicator you need for 2025. New Trend Filter to minimize losses and maximize profits. New Trendline th

Introduction The "Ultimate Retest" Indicator stands as the pinnacle of technical analysis made specially for support/resistance or supply/demand traders. By utilizing advanced mathematical computations, this indicator can swiftly and accurately identify the most powerful support and resistance levels where the big players are putting their huge orders and give traders a chance to enter the on the level retest with impeccable timing, thereby enhancing their decision-making and trading outcomes.
FREE

MT5 Version : Pre Note : The indicator uses the Open price value for calculations.
This indicator represents a genuine momentum oscillator according to the true definition of "Momentum", and as realised by the techniques of digital filters. Scholarly papers on the subject by the current developer can be found here and here , but in this description we shall borrow only the minimum of conceptual and mathematical framework needed. In the process, we expose some long-held myths about indica
FREE

Trend Scanner PRO First of all, it’s worth emphasizing that this trading system is 100% Non-Repainting, Non-Redrawing, and Non-Lagging ,
which makes it ideal for both manual and algorithmic trading setups. Online course, user manual, and downloadable presets included. The Trend Scanner Dashboard is a professional multi pair scanner that analyzes multiple symbols and timeframes at once, giving you an instant market scanner view of the real trend direction. Instead of switching charts endl

Divergence Force 背离指标 描述 Divergence Force 是一个旨在识别资产价格与MACD(移动平均收敛/发散)之间背离的指标。此指标自动绘制价格和MACD的高点和低点上的趋势线,突出潜在的交易机会。 主要功能 自动识别背离 :该指标自动检测价格与MACD之间的看涨和看跌背离。 趋势线跟踪 :自动绘制价格的连续高点和低点上的趋势线,并与MACD的高点和低点进行比较。 买入和卖出信号 :在图表上清晰显示买入("Buy")和卖出("Sell")信号,当检测到背离时显示。当未检测到背离时显示"Neutral"。 标准MACD参数 :使用标准的MACD参数(12, 26, 9)进行计算,确保结果可靠和被认可。 兼容不同时间框架 :优化为在1小时时间框架上运行,但可以根据用户的偏好应用于其他时间框架。 使用方法 安装 :将指标添加到MetaTrader 5平台的 Indicators 文件夹中。 应用到图表 :将指标加载到所需的图表中。该指标将自动开始绘制趋势线并识别背离。 信号解释 : Buy :当检测到看涨背离时,指标将显示"Buy"信号。 Sell :当检测到
FREE
Introdução O Precision Spike Detector V2 é um indicador avançado para MetaTrader 5 (MT5) projetado para identificar potenciais picos de preço (movimentos bruscos de mercado) em índices sintéticos (DERIV: Boom, Crash; WELTRADE: GainX e PainX).
Ele combina análises de RSI (Índice de Força Relativa) e ATR (Amplitude Média Real) para fornecer sinais precisos e confiáveis. Funciona apenas no período M5 (5 minutos) . Em outros períodos, nenhuma seta será exibida. Principais características Filtro ba

The Heikin Ashi indicator is our version of the Heikin Ashi chart. Unlike competitor products, this indicator offers extensive options for calculating Heikin Ashi candles. In addition, it can be displayed as a classic or smoothed version.
The indicator can calculate Heikin Ashi with moving average by four methods: SMA - Simple Moving Average SMMA - Smoothed Moving Average EMA - Exponential Moving Average LWMA - Linear Weighted Moving Average
Main features The indicator shows Heikin As
FREE

改进版 MACD Histogram(基于动能变化) MT5 自带的 MACD 指标,量柱使用的是 MACD 线本身的数值 。在快速波动或震荡行情中,这种量柱往往变化较慢,难以直观反映短期多空动能的加速或减速,尤其在价格尚未出现明显反转前,信号滞后较明显。 本版本采用更经典的 MACD Histogram 定义方式 : 量柱 = MACD − Signal 这种设计可以更敏感地捕捉 多空动能的变化趋势 ,帮助交易者直观观察动能的加速或减速。量柱由负向(空头)到正向(多头)的过渡,将比默认 MACD 更早地提示潜在的趋势动向。 请注意: 本指标 不是独立交易系统 ,不用于自动开平仓 不预测价格 ,仅提供动能观察工具 建议结合 支撑阻力、趋势结构、其他指标 一起使用,以辅助交易决策 本指标 免费发布 ,旨在为 MT5 用户提供一种更直观的动能分析方法 此外,本版本提供了更清晰的颜色区分和柱体视觉效果,负向动能区以红色标示,正向动能区以绿色显示,使交易者能够快速判断市场多空力度和潜在动能转折点。 通过这种方式,交易者可以在保持 MT5 操作习惯的同时,获得比默认 MACD 更敏感的动能提示
FREE

Contact me to send you instruction and add you in group.
QM (Quasimodo) Pattern is based on Read The Market(RTM) concepts. The purpose of this model is to face the big players of the market (financial institutions and banks), As you know in financial markets, big traders try to fool small traders, but RTM prevent traders from getting trapped. This style is formed in terms of price candles and presented according to market supply and demand areas and no price oscillator is used in it. RTM conc

This is the forex visual orders tool & forex position size (lot) calculator with intuitive panel. Risk Reward Ratio Indicator works on all kind of symbols: currency pairs, indices, metals, commodities, cryptocurrencies, etc.
If you want to make sure that Risk Reward Ratio Indicator works on your favorite symbols contact us ( visit our profile ) and ask for 7-day free trial to test this tool without limits. If you want to place orders easier, faster and more intuitive? If you like to mark trad

Are you tired of drawing Support & Resistance levels for your Quotes? Are you learning how to spot Support & Resistances? No matter what is your case, Auto Support & Resistances will draw those levels for you! AND, it can draw them from other timeframes, right into you current chart, no matter what timeframe you are using... You can also Agglutinate regions/zones that are too much closer to each other and turning them into one single Support & Resistance Level. All configurable.
SETTINGS
Timefr
FREE

凤凰支撑阻力检测器(MT5)
专为MetaTrader 5设计的专业支撑阻力检测工具。自动从更高周期识别最强支撑阻力位,并通过可视化仪表盘呈现全面强度分析。
概述
凤凰支撑阻力检测器运用更高周期枢轴点分析(默认H4周期,可自定义)识别三大最强支撑阻力位。系统依据测试次数、震荡柱数及距当前价格距离对各价位进行排序,通过简洁的六列仪表盘展示S1、S2、S3、R1、R2、R3的详细指标。
每个价位显示五项关键指标:当前价格、强度分类(基于测试次数划分为强/中/弱)、距离分类(近/中等/远)、震荡柱数量及极性状态。极性检测系统可识别阻力位转为支撑位或支撑位转为阻力位的情形(当价格穿越价位时)。
指标在图表上绘制带自动价格标签的水平线,无限延伸至左右两侧以提供清晰视觉参考。区域宽度可自动采用ATR计算或手动设置点差值。所有水平线将随更高周期形成新枢轴点动态更新。
警报选项包含:价格临近水平线时的接近预警、极性反转通知及周期验证警报。系统支持弹出提示、声音通知和移动推送通知。可配置热键实现面板可见性、图表线或两者同时的即时切换。
安装指南
从MQL5市场下载后附加至任意图表。仪表盘
FREE

Did You Have A Profitable Trade But Suddenly Reversed? In a solid strategy, exiting a trade is equally important as entering.
Exit EDGE helps maximize your current trade profit and avoid turning winning trades to losers.
Never Miss An Exit Signal Again
Monitor all pairs and timeframes in just 1 chart www.mql5.com/en/blogs/post/726558
How To Trade You can close your open trades as soon as you receive a signal
Close your Buy orders if you receive an Exit Buy Signal. Close your Sell orders if

Scalper Pro – 高级XAUUSD、EURUSD和JPY剥头皮指标 (M1/M5/M15),带成交量激增+市场结构突破 更聪明地交易,更快速地交易,与Scalper Pro一起交易。 Scalper Pro是一款 高性能MetaTrader 5剥头皮指标 ,专为 专业交易者 打造,适合从事 XAUUSD黄金剥头皮、EURUSD日内交易及JPY突破策略 。
专为 M1图表精确度 设计,并配合 M5和M15多周期确认 ,Scalper Pro可为您提供 准确、实时的买入和卖出信号 ,清晰无比。 Scalper Pro核心优势: XAUUSD剥头皮优化: 为 黄金剥头皮 精准调校,确保最佳入场时机。 适配EURUSD与JPY剥头皮: 高效捕捉包括USDJPY、EURJPY、GBPJPY在内的主要外汇对市场变化。 市场结构突破识别: 自动检测关键 支撑/阻力突破 ,确保精准入场。 成交量激增确认: 通过 订单流激增检测 过滤信号,提高准确率。 多周期面板 (M1, M5, M15): 即时显示主要日内周期趋势一致性。 低延迟执行: 专为 不容延迟的剥头皮交易者 而设计。 为什么选择S

Time Session OPEN-HIGH-LOW-CLOSE This Indicator Will Draw Lines Of OHLC Levels Of Time Session Defined By User. It Will Plot Floating Lines On Current Day Chart. Time Session Can Of Current Day Or Previous Day. You Can Plot Multiple Session Lines By Giving Unique ID To Each Session. It Can Even Show Historical Levels Of Time Session Selected By User On Chart To Do Backdating Test. You Can Write Text To Describe The Lines.
FREE

The VSA (Volume Spread Analysis) Volume Indicator is a powerful technical tool used by traders to analyze the relationship between price movement and trading volume. Rooted in the Wyckoff methodology, VSA helps identify imbalances between supply and demand, revealing the hidden actions of institutional players—often referred to as “smart money.” This indicator evaluates three key elements: volume, price spread (the difference between high and low), and closing price. By interpreting these facto
FREE

Line Profit 存款货币的可视利润线指标。仅当市场上有安装指标的符号的未平仓头寸时才有效。您可以用鼠标移动线或启用自动跟踪买入价。 指标设置说明: colotLine - 线条颜色 WidthLine - 线宽 colotText - 文本颜色 FontSize - 文本的高度 Anchor - 文本的锚点方法 FollowBid - 跟随买入价 Line Profit 存款货币的可视利润线指标。仅当市场上有安装指标的符号的未平仓头寸时才有效。您可以用鼠标移动线或启用自动跟踪买入价。 指标设置说明: colotLine - 线条颜色 WidthLine - 线宽 colotText - 文本颜色 FontSize - 文本的高度 Anchor - 文本的锚点方法 FollowBid - 跟随买入价
FREE

"Pattern 123" is an indicator-a trading system built on a popular pattern, pattern 123.
This is the moment when we expect a reversal on the older trend and enter the continuation of the small trend, its 3rd impulse.
The indicator displays signals and markings on an open chart. You can enable/disable graphical constructions in the settings.
The indicator has a built-in notification system (email, mobile terminal, standard terminal alert).
"Pattern 123" has a table that displays signals from se

According to Bill Williams' trading strategy described in the book "Trading Chaos: Maximize Profits with Proven Technical Techniques" the indicator displays the following items in a price chart: 1.Bearish and bullish divergent bars: Bearish divergent bar is colored in red or pink (red is a stronger signal). Bullish divergent bar is colored in blue or light blue color (blue is a stronger signal). 2. "Angulation" formation with deviation speed evaluation. 3. The level for placing a pending order (

The worktime indicator helps you identify the most important times to day to trade the currency pairs. It was created based on the ICT day trading free tutorials that are freely vailable on his youtube channel. You can use this indicator together with my other indicators that i have shared freely with you like the true day, custom periods, daily month, weekly open lines - they together complement each other very well.
Nuggets from this indicator: 1. Draws the asian session box showinng you the
FREE

The "Breakout Finder" is a technical indicator designed to automatically identify potential price breakouts and breakdowns on a chart. The highlight of this indicator is its robust signal filtering system, which helps traders avoid false signals (fakeouts) and focus on higher-probability trading opportunities. Key Features Automatic Pivot Point Detection: The indicator automatically identifies significant pivot highs and lows on the chart to establish potential support and resistance levels. Bre
FREE

Was: $49 Now: $33 Blahtech Better Volume provides an enhanced version of the vertical volume bars. Each bar is compared to the previous 20 bars. Depending on its volume, range and volume density it will be assigned a state and colour. Low Volume – Minimum volume High Churn – Significant volume with limited movement Climax Neutral – High volume with unclear direction
Climax Up – High volume with bullish direction Climax Dn – High volume with bearish direction Climax Churn – High vol

KT Knoxville Divergence 是一个强大的工具,通过精心结合相对强弱指数(RSI)和动量振荡器,揭示金融市场中独特的价格背离。该指标能够有效捕捉市场动态中的微妙变化,帮助交易者更精准地识别潜在的盈利机会。 Knoxville Divergence 是由 Rob Booker 开发的一种交易背离类型。交易中的背离指的是资产价格的走势与技术指标(振荡器)的方向相反。这种差异通常预示着当前趋势可能正在减弱,并可能即将反转。 这对寻找最佳入场和出场点的交易者非常有用。每当出现背离信号时,该指标会在价格图表上以可视化形式进行提示。
理解 Knoxville Divergence
Knoxville Divergence 既可以用来逆势交易,也可以用于等待小幅回调后顺势进入长期趋势。因此,它被认为是一个逆趋势指标。这个指标的形成依赖于两个关键组成部分的协同工作。 首先是动量指标(Momentum)。当价格持续上涨,但动量指标开始下降时,这就是潜在 Knoxville Divergence 出现的第一信号。然而,仅凭动量变化还不足以确认,需要第二个条件 —— 相对强弱指数(RS

KT Stochastic Alerts 是对随机振荡指标的个性化实现,它根据六种自定义事件提供信号与提醒,帮助交易者及时捕捉市场动向并改进决策效率,在高频或盘整行情中尤为实用。 看涨金叉: 当随机指标主线上穿信号线。 看跌死叉: 当随机指标主线下穿信号线。 随机指标进入超买区时。 随机指标脱离超买区时。 随机指标进入超卖区时。 随机指标脱离超卖区时。
功能亮点
非常适合专注于随机指标金叉、死叉及超买/超卖动态的交易者。 代码精简,占用内存与资源极低,保证平台流畅运行。 集成所有 MetaTrader 提醒:桌面弹窗、声音、邮件及移动推送,一应俱全。
随机振荡指标简史 随机振荡指标由 George Lane 博士于 1950 年提出。Stochastic 一词描述的是当前收盘价在一定时期价格区间中的相对位置。通过比较收盘价与区间高低点,该方法试图捕捉价格拐点并提前预判趋势变化。

欢迎使用双峰指标 MT5 --(双顶/双底)-- 双顶底指标是一种技术分析工具,旨在识别市场中潜在的反转模式。
它确定了价格连续出现两个几乎相等高度的波峰或波谷,随后价格向相反方向移动的区域。
这种模式表明市场正在失去动力,可能已准备好趋势逆转。 *购买后联系我,向您发送 说明和步骤指南。 特征:
自动图表注释:指标自动在图表上标记双顶底形态 易于使用:该指标用户友好,可以轻松应用于 MT5 平台中的任何图表。 可定制:指标具有可定制的设置 自定义警报 。 适用于任何乐器。 该指标可与其他技术分析工具结合使用,以确定趋势方向和反转形态的潜在强度。 总的来说,双顶和双底指标是寻求识别市场潜在趋势逆转的交易者的强大工具。
其可定制的设置、警报和自动图表注释使其易于使用,
而其多时间框架分析和趋势确认功能为交易者提供了对潜在交易机会的宝贵见解。 如果你有任何问题随时问。

Fine Timeframes 是 MT5 的一个亚分钟时间框架指标。它创建 1 到 30 秒间隔的图表,让您能够看到在分钟和小时图表上不可见的市场波动,同时保留完整的交易功能:您可以像在标准时间框架上一样开仓和平仓。 精细时间框架仅适用于实时报价,不适用于策略测试器—— 下载演示版本 ,在欧元/美元和澳元/美元的真实市场条件下测试该指标。 主要特点 • 时间范围从 1 秒到 30 秒,一键即可在不同时间范围之间切换。 • 直接从图表进行完整交易:精细时间框架不会阻止任何内置终端功能——您可以像在任何常规时间框架上一样,直接在基于秒的图表上使用标准的 MT5 控件开仓、下挂单和管理仓位。 • 灵活的显示设置:3 种图表类型(蜡烛图、柱状图、折线图),4 种配色方案。
用例 • 新闻交易——捕捉重要经济数据发布后最初几秒钟的冲动性波动。 • 精确的入场/出场点——在标准时间框架内无法获得的超短时间间隔内找到最佳点位。 • 市场微观结构分析——在做出决策之前,对价格行为进行最细致的研究。 • 超短线交易——是目标金额极低、交易速度极快的理想工具,因为每一秒都至关重要。
技术细节和建议

KT Price Border 创建了一个由三条带组成的价格通道,用于识别市场中的潜在高点和低点。这些水平还可以用作动态市场支撑和阻力。 中间带还可以用于识别趋势方向,因此它也可以作为趋势跟踪指标。此外,其简单易用的特点以及清晰的交易信号,使新手交易者受益匪浅。
功能特点
适用于大多数外汇货币对。 可用于低时间框架和高时间框架。 适用于剥头皮交易、日内交易和波段交易。 支持趋势交易和逆势交易策略。 当价格突破价格带时,可发送提醒通知。 价格带还可作为动态支撑和阻力水平。
理解价格边界的概念 该指标的工作原理类似于布林带。下轨表示市场超卖区域,同时充当动态支撑。 上轨表示市场超买区域,同时充当动态阻力。中间带用于确定趋势方向。 如果价格收于中间带上方,则表明市场仍处于上升趋势;相反,如果价格收于其下方,则表明市场仍处于下降趋势。
专业建议 使用 KT Price Border 进行交易时,可以自由选择自己偏好的入场、止损和止盈方法。 与任何指标一样,应遵循更广泛的市场趋势,并在模拟账户上进行练习,直到完全掌握。请记住,即使是最好的交易指标,在长期交易中也无法保证 100% 的胜

通过 Fibonacci Killer Alert MT5 提升您的交易精准度,这是一款强大的指标,利用斐波那契回撤水平为外汇、股票、加密货币和商品市场提供精确的入场信号。在 Forex Factory 和 Reddit 的 r/Forex 等交易社区中备受推崇,并在 Investopedia 和 TradingView 的讨论中因其在识别趋势反转和延续方面的准确性而受到赞扬,该指标是寻求高概率交易设置的交易者的首选。用户报告称,结合价格行为使用关键斐波那契水平(例如 38.2%、50%、61.8%)时,识别准确率高达90%,许多人指出通过在新K线形成时触发的及时警报,交易时机提高了25-35%。主要优势包括信号精准度高、可定制的斐波那契水平以适应个性化策略,以及轻量级设计,使剥头皮、日内交易和波段交易者无需持续监控图表即可抓住机会。 Fibonacci Killer Alert MT5 利用 ZigZag 指标(默认设置:深度 20,偏差 5,回溯 3)识别显著的价格波动,并在价格接近用户选择的斐波那契水平(默认 Level 3:38.2%,范围从 0% 到 423.6%)时生成信号

随机振荡器多货币扫描仪表板 MT5 是一款功能强大的工具,旨在使用随机振荡器监控多个货币对和时间框架。它以网格格式组织信号,显示每个符号在从 M1 到 MN1 的时间框架上的状态。交易者可以启用或禁用特定时间框架以适应其策略。 MT4版本可在此处找到: Stochastic Oscillator Multicurrency Scanner MT4 详细文档请点击此处: 文档 该工具根据以下随机振荡器策略显示信号: 超买/超卖策略:当随机振荡器进入或退出超买(高于上水平)或超卖(低于下水平)区域时生成信号,表明潜在的反转。 反转水平策略:当随机振荡器回穿用户定义或自动计算的上水平或下水平时触发信号,提示动能的转变。 交叉策略:当随机振荡器的%K线与%D线交叉时激活信号,可针对趋势或区间交易进行定制。 主要功能: 随机振荡器集成:支持四种进场策略,包括进入或退出超买/超卖区域的信号、反转水平和交叉。参数如K周期、D周期、减速因子和水平可完全定制,以进行精确分析。 汇合警报:当多个时间框架在同一方向对齐时,高亮显示汇合信号,增强交易设置的可靠性。 自定义警报:通过弹出窗口、电子邮件或推送通知
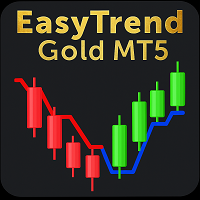
是否厌倦了复杂的指标,尤其是在交易波动剧烈的黄金市场时?EasyTrend Gold MT5 指标专为驾驭黄金在任何时间周期上的波动性而设计。它利用 ATR (平均真实波幅) 的力量,将黄金的剧烈波动转化为一条清晰、动态且能过滤市场噪音的趋势线。 无论您是在 M1 周期上进行剥头皮交易,还是在 H4 周期上进行波段交易,您都可以直观地看到趋势的方向和强度,轻松识别盘整期,并获得关于何时对 XAU/USD 采取行动的直观洞察。 其他推荐资产 虽然 EasyTrend 针对黄金等高波动性资产进行了优化,但其逻辑在众多以强劲趋势著称的市场中同样非常有效: 主要外汇对: EUR/USD, GBP/USD, USD/JPY 股票指数: US500 (标准普尔500指数), US100 (纳斯达克100指数), GER30 (德国DAX指数) 加密货币: BTC/USD (比特币), ETH/USD (以太坊) 大宗商品: WTI/USOIL (原油) 1. 策略:指标的实际运作方式 EasyTrend 是一款趋势跟踪指标,它使用平均真实波幅 (ATR) 来创建一条能够适应市场波动
FREE
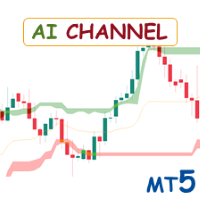
Special offer : ALL TOOLS , just $35 each! New tools will be $30 for the first week or the first 3 purchases ! Trading Tools Channel on MQL5 : Join my MQL5 channel to update the latest news from me AI Channels 指标利用 滚动K均值聚类 ——一种在聚类分析中强大的机器学习技术——实时提供基础价格趋势的见解。该指标根据聚类价格数据创建自适应通道,使交易者能够做出有关趋势方向和市场状况的明智决策。 该指标还包括一个 跟踪止损选项 ,提供了更灵活的风险管理方法。 查看更多MT4版本: AI Channels MT4 查看更多产品: 所有产品 如何使用AI Channels指标 每个通道的极端值为确定趋势方向提供了宝贵的见解: 上通道极端值: 价格突破此水平可能表明上升趋势。 下通道极端值: 价格跌破此水平可能表明下降趋势。 调整 窗口大小 (用于聚
FREE

CGE Trading Suite is a market analysis system designed to eliminate guesswork from trading. It continuously adapts to real-time price behavior, helping traders stay aligned with key market levels and evolving market conditions. This comprehensive system integrates multiple analytical tools into a single workflow, including dynamic grid mapping, liquidity behavior analysis, ECM, trend lines, supply and demand zones, MIDAS, trade cycles, and directional channel projections. Together, these tools p
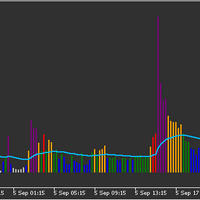
Volume indicator judging level of volume per bar accordingly to Volume Spread Analysis rules. It allows either to set static volume levels or dynamic ones based on ratio comparable to Moving Average. Bars are coloured based on ratio or static levels, visually presenting level of Volume (low, average, high, ultra high). Release Notes - Fixed and optimised calculations of Session Average Volume
- added predefined settings for time to calculate Session Average for EU and US markets
FREE
Mega Spikes Max is a specialized indicator for Boom and Crash synthetic indices that generates trading signals with automatic alert notifications. Features The indicator analyzes market conditions using proprietary algorithms and displays buy/sell arrows directly on the chart. It works specifically with Boom and Crash indices on M5 timeframe. Signal generation combines multiple technical analysis methods to identify potential trading opportunities. The system provides two TP levels and SL calcu

This indicator shows the TLH and TLL and some trendlines that allow us to estimate the trend of market. It also shows the values of the angles of the lines in percentage in points (pip) , the standard deviation, and the trend of each line, and when it breaks the lines of support and resistance (TLH and TLL). And finally, it also shows the points identified as supports and resistances through the fractal algorithm in the graph. The high and low trend lines are supported by the highs and lows, th
FREE

The indicator that shows the countdown to the change of candles is equipped with an alert when the bar changes (the alert is not active if installed on the M1 time frame). Displays seconds if installed in time frame M1, displays minutes and seconds if installed in time frame above M1, and displays hours and minutes if installed in time frame h1 and above. The time displayed is calculated based on the running time.
FREE

自适应 ADR 自适应 ADR 是一款用于计算和显示平均每日波动范围 (ADR) 的专业级技术指标,适用于需要精确掌握日内波动结构的交易者。该工具通过多种可调节参数,为不同交易风格提供灵活支持。 计算与方法 四种平滑方式: SMA、EMA、SMMA (Wilder)、LWMA 可根据不同市场环境与波动率模型自由选择 支持多品种、多周期使用,适合趋势与震荡市场 动态日内逻辑 随交易时段开始自动运行 围绕开盘价设置两个对称区间 区间会自适应收窄直到首次触及 ADR 达到 ADR 后区间固定至收盘,提供明确的日内波动边界 有助于识别超出正常波动范围的行情行为 视觉引导 可选开盘价线 可自定义颜色、线型、透明度与可见性 适合深色与浅色主题,便于整合到个人图表布局 应用价值 清晰的日内结构 精准评估每日波动范围 适合突破、均值回归、区间交易与波动率策略 帮助交易者避免过度交易并识别高概率区域
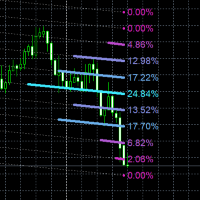
Linear Regression Volume Profile指标将线性回归分析与成交量分布剖析相结合,创建了一个先进的市场结构可视化工具。基础从对指定数量历史K线的线性回归计算开始,计算定义趋势线通过价格行为轨迹的斜率(倾斜度)和Y轴截距值。这条回归线作为分析成交量分布的中心轴,自动适应当前趋势方向,而不是保持水平静止状态。然后指标围绕此回归线计算基于ATR的通道,通道宽度由用户定义的比率乘以200周期平均真实波幅值确定,确保剖析级别按比例适应当前市场波动性。成交量分布分析通过将此通道划分为多个水平级别(默认回归线上方7个和下方7个)进行,其中每个级别代表沿回归角度倾斜的特定价格区域。对于计算周期内的每个历史K线,指标检查该K线的高低范围触及了哪些价格级别,并将相应的成交量累积到这些级别中。生成的成交量分布通过从每个级别延伸的彩色水平条可视化,颜色在最小成交量(紫色)和最大成交量(黄色)之间插值,基于每个级别占总累积成交量的百分比。方向箭头出现在计算周期中最旧的K线处,对于正回归斜率(指标反向逻辑中的下降趋势)向上指,对于负斜率(上升趋势)向下指,提供计算趋势方向的即时视觉确认。剖

ScalpReactor X A Tactical Indicator for Precision Traders The Ritz Scalping Habbit is a powerful MT5 indicator designed to help traders execute disciplined, high-probability trades through clear visual cues and multi-strategy confirmations. Whether you’re an intraday scalper or a swing trader , this tool integrates advanced market analysis into a single, easy-to-use interface. Key Strengths: Smart Buy & Sell Arrows — Based on multi-layer signals from RSI, ATR, EMA, ADX, and price momentum. Colo

ATREND: 工作原理及使用方法 工作原理 “ATREND”指标针对MT5平台设计,旨在通过结合多种技术分析方法为交易者提供强有力的买卖信号。该指标主要利用平均真实波幅(ATR)来测量波动性,并结合趋势检测算法来识别潜在的市场动向。 购买后请留言,您将获得特别的赠品。
主要特点: - 动态趋势检测:该指标评估市场趋势并相应调整信号,帮助交易者与当前市场条件对齐策略。 - 波动性测量:通过使用ATR,该指标衡量市场波动性,这对于确定最佳止损(SL)和止盈(TP)水平至关重要。 - 信号可视化:该指标在图表上直观地表示买卖信号,增强交易者的决策能力。 操作步骤 输入和设置: - 时间框架:此输入允许您设置指标计算的主要时间框架,默认值为15分钟。 - 时间框架2:此输入可用于定义额外分析的辅助时间框架,默认值为1分钟。 - 移动:此参数允许您将指标的计算向回移动,默认值为0。 - SLATR:此输入定义用于根据ATR计算止损水平的乘数,默认值为2.56。 - TPATR:此输入定义用于根据ATR计算止盈水平的乘数,默认值也为2.56。 - AlertsOn:启用或禁用交易信号的警报,

This is advanced Multi-Symbol and Multi-Timeframe version of the "Candle Pattern Finder" indicator (search for candlestick patterns based on the book by Gregory L. Morris "Candlesticks charting explained. Timeless techniques for trading stocks and futures" ). The indicator searches for candlestick patterns for ALL symbols of the "Market Watch" window and for ALL standard timeframes from M1 to MN1. When patterns appear on any symbol / timeframe, the indicator gives a signal (text, sound, sending

交易实用必备工具指标 波浪自动计算指标,通道趋势交易 完美的趋势-波浪自动计算通道计算 , MT4版本 完美的趋势-波浪自动计算通道计算 , MT5版本 本地跟单复制交易 Easy And Fast Copy , MT4版本 Easy And Fast Copy , MT5版本 本地跟单复制交易 模拟试用 Easy And Fast Copy , MT4 模拟账号运行 Easy And Fast Copy , MT5 模拟账号运行 高级布林带: 1.布林中轨会随着方向变色 " 2.布林外轨扩张和收缩都会在外轨进行变色标识" 3.布林中轨计算方式可以选择任意均线,例如EMA" 4.同样可以选择任意价格应用模式进行计算" 强烈推荐趋势指标 , 波浪的标准自动计算 和 波浪的标准自动计算MT5版本 "合作QQ:556024" "合作wechat:556024" "合作email:556024@qq.com"
布林线(Bollinger Band) 是根据统计学中的标准差原理设计出来的一种非常实用的技术指标。它由 三条 轨道线组成,其中上下两条线分别可以看成是
FREE

成交量突破震荡指标是一种以震荡指标的形式将价格变动与成交量趋势相匹配的指标。
我想将成交量分析整合到我的策略中,但大多数成交量指标都令我失望, 例如 OBV、资金流量指数、A/D,还有成交量加权 Macd 和许多其他指标。 因此,我为自己编写了这个指标,我对它的实用性感到满意,因此我决定将其发布到市场上。
主要特点:
它突出显示了价格在成交量增加(突破)支持下朝某个方向移动的阶段。 它突出显示了成交量增加停止并因此市场收缩的阶段。 它突出显示了价格和成交量均未移动的阶段,尤其是在时间范围(<=15 分钟)的日内交易中,因此市场已为未来的运行做好准备。 当其他 EA 发出的虚假信号不受交易量增加的支持时,会将其过滤掉。 它使趋势和区间阶段的可视化变得非常容易 输入参数: 计算设置: 计算类型:快速、正常、慢速,用于监控短期、中期和长期,保持在同一时间范围内。 计算周期:计算周期 交易量设置: 交易量类型:TickVolume(主要用于外汇)和 RealVolume(用于股票市场) 信号设置: 信号周期:信号线周期 突破水平:突破信号的阈值水平 警报设置 警报类型:收盘价或即时 警

自己构建您的策略 这个工具允许您使用MetaTrader本机提供的所有指标以及从互联网下载的使用缓冲区显示数据的指标来开发自己的策略。 这个工具是您考虑将MetaTrader用于自动化交易策略的另一个理由。借助它,您可以以简单直观的方式创建自己的策略信号,使用任何MetaTrader指标。 我如何知道我的互联网下载的指标使用缓冲区? 很简单,只需运行此工具,它会自动发现您的指标拥有的所有缓冲区,并使它们可用于基于它们创建您的策略。 此工具可以自动识别您的指标是否具有缓冲区以及它们拥有多少数据缓冲区。您需要做的就是将缓冲区与正确的值关联起来。 MetaTrader本机指标如移动平均线、相对强弱指数(RSI)、随机指标(Stochastic)和移动平均收敛差离指标(MACD)等都非常容易使用,因为它们已经具有集成的缓冲区。但是,当涉及到从互联网下载的自定义指标时,了解哪个缓冲区与哪个数据相关是很重要的。让我们从头开始吧。 学习使用MetaTrader本机键盘快捷键: 快捷键 描述 CTRL+F 激活鼠标上的十字线,准确识别您正在引用的蜡烛图。 CTRL+D 显示指标缓冲区的数据窗口。 CT
FREE
这个指标有什么作用? 该指标会自动分析图表,识别 艾略特波浪模式 (推动浪和调整浪),并实时显示波浪1、2、3、4和5的位置。此外,它还包括 价格预测 、 成交量验证 和 三角形形态识别 。 “雷达”版本有哪些改进? 目标预测: 提示价格在第五浪中可能走向何方。 成交量验证: 确认成交量是否支持已识别的模式。 三角形识别: 识别复杂的调整浪(收缩、扩张、对称)。 概率分析: 告诉你已识别模式的可靠性(%)。 多重备选计数: 如果市场走势模糊,提供不止一个有效选项。 如何理解颜色和线条 波浪线: 蓝色: 推动浪 (1、3、5)— 主要趋势。 红色: 调整浪 (2、4)— 趋势内的回调。 黄线(建议回调位) 这条线标出了修正最有可能结束的水平。 如果价格回调并突破黄线的底部(即最接近价格、作为入场点的那个位置),则价格继续向黄线另一端的预测位移动的可能性会增加。只有当完整的趋势变化已经确认,并且黄线的起点和终点都得到验证时,这个信号才是可靠的。 灰色线(趋势通道) 这条线界定了推动浪的运行轨迹,并帮助预测第五浪可能结束的位置。如果价格在通道内运行,则确认了趋势的强度;如果提前突破通道,则可
FREE
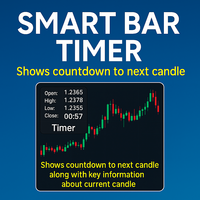
增强型K线计时器 是一个多功能且可定制的MetaTrader 5 (MT5) 指标,实时提供当前K线的信息,包括下一根K线的倒计时、K线细节、成交量和点差。指标显示在用户指定的图表窗口角落,提供多行或单行格式,允许交易者一目了然地监控关键市场数据,提升决策效率和交易效率。 主要功能 实时K线计时器 :显示下一根K线的倒计时(小时、分钟及可选的秒数),支持自定义文本颜色、字体大小和字体类型。 K线信息 :显示当前K线的方向(看涨/看跌)、K线大小(以点计)、实体大小、上下影线大小和价格变化百分比,并根据K线方向使用颜色编码文本。 成交量和点差数据 :可选显示当前K线的成交量(以百万或千为单位)和点差,提供关键市场背景信息。 灵活的显示选项 :可在详细的多行布局或紧凑的单行格式之间选择,支持调整行间距和定位。 无缝MT5集成 :完全兼容MetaTrader 5,确保简单设置和优化的性能,不影响平台速度。 可定制设置 :配置计时器颜色、看涨/看跌颜色、字体、显示角落、与角落的距离,以及秒数、K线信息、成交量和点差的显示开关。 优势 全面的市场洞察 :将K线计时、K线分析、成交量和点差数据整合
FREE

Gold Scalper Pro PSAR ADX 仪表板 MT5 专业多时间框架交易指标,具备高级信号检测能力 概述 Parabolic SAR V3 + ADX 是一个复杂的技术分析指标,将趋势跟踪模型 Parabolic Stop and Reverse (PSAR) 与动量强度测量指标平均方向指数 (ADX) 结合起来。本增强版本具有针对交易品种的优化、多语言警报系统和全面的多时间框架仪表板,专为专业交易者设计。 主要特性 核心功能 - Parabolic SAR 集成:通过可调节的 step 和 maximum 参数,精准检测趋势反转。
- ADX 过滤系统:根据趋势强度过滤弱信号。
- 方向运动交叉检测:通过 +DI 和 -DI 交叉提供额外确认信号。
- ADX 云可视化:通过可动态调整高度的图形表示趋势强度。 品种专属优化 针对主要交易工具的保守预设参数:
- XAUUSD (黄金):针对贵金属波动性优化。
- EURUSD:校准以符合主流外汇品种特性。
- USDJPY:调整以适应日元交叉动态。
- XAGUSD (白银):针对白银市场行为进行微调。
- BTCUSD

The indicator displays the orders book, as well as increases its depth, remembering the location of orders that have gone beyond the current "window" view.
Indicator capability Display the levels of open positions. Simulation of placing/cancelling/editing pending orders directly in the displayed orders book.
Indicator features The orders book display works only on those trading symbols for which it is broadcast by the broker. To reset the information about the rows that were recorded in the Sm
FREE

This indicator is converted from UT Bot alerts indicator by @QuantNomad of Trading View to MT5. its considering ATR and creating new candles on chart and also is giving good entry points based on its candles. all buffers of new candles and also entry signals are included as buffer so can be used easily on any EA. there are also some different strategies on the internet that can be used or contact me to create it for you.

ADVANCED MARKET ANALYSIS INDICATOR Overview of the Indicator
This is not a simple indicator — it’s a multi-analysis predictive system. It combines:
Volume Profile (POC, VAH, VAL)
Fibonacci Extensions
Pivot Levels (Daily, Weekly, 4H)
Trend Determination (MA-based)
Smart Money Concepts & Pattern Detection (basic placeholders for expansion)
Prediction Engine (projects price forward for 1 hour)
It gives you:
Target Price Line (projection)
Stop Loss Line (usually at Volume POC)
FREE

Boom and crash Gold Miner v2 trend histogram which works in conjunction with the indicator above that has arrows as shown in the video. PLEASE Note: That the top indicator and the bottom indicator are two separate indicators. the top indicator is https://www.mql5.com/en/market/product/98066 the bottom one is free. which is the histogram at the bottom. the trend histogram trading tool that helps to easy detect the trend blue color indicates an uptrend. Orange color is a down trend.
FREE

SUPERTREND INDICATOR MT5 Developer: gedeegi General Description GEN SmartTrend Signal is a comprehensive technical indicator for MetaTrader 5 (MT5), focused on trend identification and automated risk management. It utilizes a refined SuperTrend -based algorithm powered by the Average True Range (ATR) to determine the primary trend direction. What sets this indicator apart is its integrated trade management features displayed directly on the chart, including visual placement of Stop Loss (SL)
FREE

SAM Waves PRO – Professional Signal Indicator for Day Trading SAM Waves PRO is the extended version of the popular SAM Waves indicator, designed specifically for disciplined intraday Forex traders. It includes real-time notifications via push, email, and sound alerts, ensuring you never miss a qualified trading signal. Backtested on over 5.5 years of historical data, the strategy has achieved a consistent win rate above 60 percent when traded using a fixed stop loss and take profit between 20 an

The Missing Edge You Need To Catch Breakouts Like A Pro. Follow a step-by-step system that detects the most powerful breakouts!
Discover market patterns that generate massive rewards based on a proven and tested strategy.
Unlock Your Serious Edge
Important information here www.mql5.com/en/blogs/post/723208
The Reliable Expert Advisor Version
Automate Breakout EDGE signals using "EA Breakout EDGE" Click Here Have access to the game changing strategy that will take your trading to the next l

The balance of supply and demand is a simple and effective market analysis method. The supply and demand diagram can show you in advance, even before the trend reversal, where the supply ends and the demand is already emerging, where the demand ends and the supply is emerging, while substantially increasing the probability of making a deal in the right direction and with a high profit factor.
Indicator signals The indicator uses the price/volume values to generate signals: ED – excess demand. E
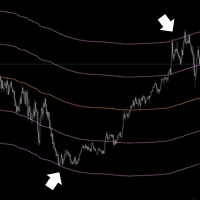
Elevate Your Trading with Advanced Anchored Volume Weighted Average Price Technology Unlock the true power of price action with our premium Anchored VWAP Indicator for MetaTrader 5 - the essential tool for precision entries, strategic exits, and high-probability trend continuation setups. Write me a DM for a 7 day free trial. Anchored VWAP Plus gives traders unprecedented control by allowing custom anchor points for Volume Weighted Average Price calculations on any chart. With support for 4 sim
FREE

The Hybrid Stochastic indicator is a Stochastic RSI described by the famous Tushar Chande and Stanley Kroll in their book called " The New Technical Trader" . The main goal of this indicator is to generate more Overbought and Oversold signals than the traditional Relative Strength indicator (RSI). Combining these 2 indicators expands the range of the overbought and oversold territory. The idea behind it is to use the Stochastic formula over RSI values. If you want to know more about its internal
FREE
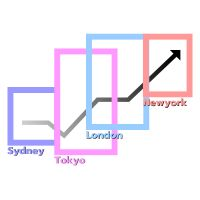
Time Zones and the Forex Market
The Forex market operates continuously 24 hours a day, facilitated by its global distribution across various time zones. The market is anchored by four primary trading centers: Sydney , Tokyo , London , and New York . Each trading center has specific opening and closing times according to its respective time zone. These differences significantly impact market volatility and trading opportunities during each session. Features Enable/Disable Date Display Enable/Di
FREE
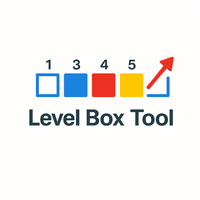
Level Box Tool is a powerful and user-friendly custom indicator designed for traders who utilize technical analysis tools like rectangles and trend lines to identify key support, resistance, and price zones. This tool simplifies and speeds up the process of marking chart levels, offering both visual clarity and precision with its fully customizable panel, and now includes price-cross alerts — so you’ll never miss a key level again. MT4 Version - https://www.mql5.com/en/market/product/136009/ Jo
FREE

Cumulative Delta Volume Indicator for MT5 (CDV Indicator for MT5) Volume-Based Market Sentiment and Trend Strength Indicator The Cumulative Delta Volume (CDV) indicator analyzes the balance between buying and selling volume to reveal the underlying market sentiment.
By accumulating the difference between upward and downward volume, it shows whether buyers or sellers are in control and helps traders confirm the strength or weakness of a trend. This tool provides both candle-based visualization an
Ekom Spike Detector
Navigate the volatile world of Boom and Crash indices with the Ekom Spike Detector Indicator. This powerful tool detects explosive price movements, providing traders with precise buy and sell signals 24/7.
Key Features:
Spike Detection : Identify high-probability spike patterns in real-time Clear Visual Signals : Displays clear buy and sell arrows on the chart for easy decision-making Customizable : Easily switch from either Boom based on individuals choice Reliable : Te
FREE
Advanced Market Analysis Tool. Full Documentation: Download Free Professional Education Course: After purchasing, contact me to receive access to the complete CDV Professional Training Video Course. — It will help you master CDV , Aggressive Buyer & Seller dynamics , and Volume Microstructure concepts through a clear, step-by-step learning process. Overview The Professional CDV with Aggressive Score is a comprehensive volume analysis tool that combines visual Cumulative Delta Volume (CDV)

Crypto_Forex 指标适用于 MT5 的“趋势修正直方图”。
- 趋势修正直方图有两种颜色:红色表示看跌趋势,蓝色表示看涨趋势。 - 7 个连续的相同颜色直方图柱表示新趋势的开始。 - 趋势修正直方图指标的设计主要目的是最小化损失并最大化利润。 - 它具有参数“周期”,负责指标的灵敏度。 - 内置移动和 PC 警报。 - 趋势修正直方图可以用作简单但有利可图的交易系统,见下文:
如何使用指标: 1) 检查至少 7 个连续的相同颜色直方图柱,这意味着新趋势的开始。例如,下图中有超过 7 个蓝色柱。 2) 等待 1(一个)相反颜色的柱,在我们的例子中是红色,紧接着又变为蓝色。这意味着这是趋势修正。 3) 当出现蓝色柱状图时,开多头交易,在此之前只有一个红色柱状图。这意味着订单在修正后按照主要趋势方向开仓。 4) 安排止损(见图)和获利点。获利点应至少比止损大 3 倍。在这种情况下,即使您只赢了 30%,您也会获利。 5) 卖出(空头)交易反之亦然(见图)。
点击这里查看高质量的交易机器人和指标! 这是仅在此 MQL5 网站上提供的原创产品。
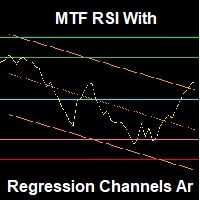
Note: The inputs of this indicator are in the Arabic language An advanced RSI indicator that displays dynamic linear regression channels in both the indicator window and the price chart, with predefined horizontal levels to detect overbought and oversold zones. Main Features (Summary): Synchronized linear regression channels on both price and RSI Multitimeframe support Smart and ready-to-use horizontal levels Professional design with optimized performance Feedback & Support We value your ex
FREE

了解“Agulhadas”策略 该策略灵感来自巴西市场中流行的交易理念,结合了五种技术指标,用于根据趋势、市场强度和动量识别潜在的买入和卖出点。其中包括著名的Didi指标,该指标由Odair Aguiar开发,以代表移动平均线的交叉而闻名。 点击此处下载股票扫描器 使用的指标 Didi指标 ADX指标 布林带 Trix指标 随机指标(Stochastic) 策略的工作原理 该指标会在满足特定条件时在图表上显示买入或卖出的箭头信号,同时用“X”标记出场点。 买入信号 需要满足以下三个条件来确认买入点: ADX呈上升趋势 ADX高于32或呈上升趋势,且DI+高于DI-。 Didi指标发生金叉 短期均线上穿中期均线。 布林带扩张 上下轨同时扩张。 卖出信号 与买入信号条件相同,但信号相反: ADX呈下降趋势 ADX高于32或呈上升趋势,且DI-高于DI+。 Didi指标发生死叉 短期均线下穿中期均线。 布林带扩张 上下轨同时扩张。 出场条件 该策略提供多种条件用于提示何时退出交易,图表上会用“X”作为视觉信号标记。 多头出场(两种选择): 组合条件 ADX处于趋势中(高于32或上升,且不是同
FREE

The TickCounter indicator counts up and down ticks on each new bar.
The calculation starts from the moment the indicator is placed on the chart.
Histogram bars represent: Yellow bars - total number of ticks; Blue bars - ticks UP; Red bars - ticks DOWN. If the blue bar is not visible, then there are more down ticks and the red bar is displayed on top of the blue one (the red layer is above the blue one). MT4 version: https://www.mql5.com/en/market/product/82548
Each reinitialization of the i

This is Wilder's ADX with cloud presentation of DI+ & DI- lines. Features
4 standard lines of the ADX indicator: DI+, DI-, ADX, ADXR cloud presentation of DI+/DI- lines with transparent colors applicable to all time-frames and all markets
What Is ADX
J. Welles Wilder Jr., the developer of well-known indicators such as RSI, ATR, and Parabolic SAR, believed that the Directional Movement System, which is partially implemented in ADX indicator, was his most satisfying achievement. In his 1978 book,
FREE
MetaTrader市场是独有的自动交易和技术指标商店。
阅读MQL5.community用户备忘更多地了解我们提供给交易者的独特的服务:复制交易信号,自由职业者开发的自定义应用程序,通过支付系统完成的自动付款和MQL5云网络。
您错过了交易机会:
- 免费交易应用程序
- 8,000+信号可供复制
- 探索金融市场的经济新闻
注册
登录