Technische Indikatoren für den MetaTrader 5 - 10

MACD Ribbon Dynamic PRO: Volatilität in Trend verwandeln
Kurzbeschreibung: „Verlassen Sie sich nicht auf eine einzelne Linie. Sehen Sie die Markttiefe. Ein Trendfolger der neuen Generation, optimiert für Bitcoin, Gold und Forex, frei von Spread-Fehlern.“
Produktdetails: Warum MACD Ribbon Dynamic? Standardindikatoren erzeugen Fehlsignale bei hochvolatilen Assets wie Bitcoin oder Gold. MACD Ribbon Dynamic nutzt einen mehrschichtigen Algorithmus, um Marktrauschen herauszufiltern.
Hauptmer
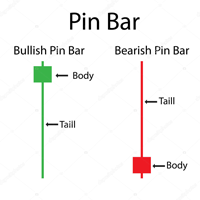
Pin-Bar-Muster sind gekennzeichnet durch einen langen oberen oder unteren Docht mit einem kleinen Körper im Verhältnis zur Größe des Dochts und wenig bis gar keinem unteren oder oberen Schatten. Pin-Bars dürfen nicht isoliert gehandelt werden , sondern müssen im größeren Kontext der Chartanalyse betrachtet werden. Ein Pin-Bar-Einstiegssignal kann in einem Trendmarkt einen sehr wahrscheinlichen Einstieg und ein gutes Risiko-Ertrags-Verhältnis bieten.
Eingaben Multiplikator ; AlertOn - Alarme akt
FREE
Der VSA (Volume Spread Analysis)-Volumenindikator ist ein leistungsstarkes technisches Instrument, das von Händlern zur Analyse der Beziehung zwischen Preisbewegung und Handelsvolumen verwendet wird. VSA basiert auf der Wyckoff-Methode und hilft dabei, Ungleichgewichte zwischen Angebot und Nachfrage zu erkennen und die versteckten Aktionen institutioneller Akteure - oft als "smart money" bezeichnet - aufzudecken. Dieser Indikator wertet drei Schlüsselelemente aus: Volumen, Preisspanne (die Diff
FREE

High Low Today (MT5) ist ein kostenloser, einfach zu bedienender MetaTrader 5-Indikator, der die Höchst- und Tiefstkurse des aktuellen Tages auf Ihrem Chart anzeigt. Er bietet sogar optionale Push-Benachrichtigungen, um Sie zu alarmieren, wenn der Kurs diese Schlüsselniveaus berührt oder durchbricht. Mit seinem klaren und minimalistischen Design liefert er wertvolle Intraday-Informationen, ohne Ihr Chart zu überladen. Markiert das Hoch und das Tief des aktuellen Tages auf dem Chart (wichtige In
FREE

Donchian Channel ist ein von Richard Donchian entwickelter Indikator. Er wird aus dem höchsten Hoch und dem niedrigsten Tief des letzten angegebenen Zeitraums in Kerzen gebildet. Der Bereich zwischen Hoch und Tief ist der Kanal für den gewählten Zeitraum.
Seine Konfiguration ist einfach. Es ist möglich, den Durchschnitt zwischen der oberen und der unteren Linie liegen zu lassen, und Sie können sich benachrichtigen lassen, wenn der Kurs eine Seite berührt. Wenn Sie Fragen haben oder Fehler finden
FREE

Volume oscillator Der Volume oscillator ist ein hybrider technischer Indikator, der die statistische Abweichungsanalyse des Preises mit der Intensität des Volumens kombiniert. Er wurde entwickelt, um Änderungen im Marktregime (Trend oder Konsolidierung) sowohl visuell als auch mathematisch präzise zu identifizieren. Im Gegensatz zu herkömmlichen Oszillatoren gewichtet dieser Indikator die Preisvolatilität mittels eines internen Volumen-RSI . Dies ermöglicht es, „leere“ Marktbewegungen (ohne Volu
FREE
Sigma Indikator wird von Sigma Expert Advisor für die Darstellung der Zonen verwendet, aber jetzt ist es für Mitglieder verfügbar, um ihre Strategien auf Sigma Angebot und Nachfrage Ebenen anzuwenden.
Anweisungen:
1- Ändern Sie nicht Zeitrahmen stattdessen laufen mehrere Paare mit verschiedenen Zeitrahmen mit Sigma Indikator 2- Für exness: Suche nach kleinerer Zone = True
Für andere Broker: Keep it False
3- Maximale Zonengröße = 0
4- Minimale Zonengröße = 0
5 - Back candles = 300
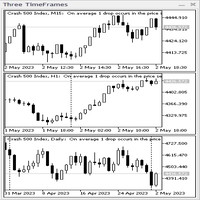
Anzeigefeld mit drei Zeitrahmen. Der Indikator wird in Form eines Panels basierend auf der Klasse CAppDialog erstellt. Das Panel kann minimiert oder mit der Maus im aktuellen Diagramm verschoben werden. Der Indikator zeigt drei Zeitrahmen des aktuellen Symbols im Panel. In der aktuellen Version verfügt der Indikator über eine Mindestanzahl an Einstellungen – dies sind die Parameter von drei Zeitrahmen: „Jüngerer Zeitrahmen“, „ Mittlerer Zeitrahmen “ und „ Älterer Zeitrahmen “. Beim S

Bei diesem Indikator handelt es sich um einen Indikator für die automatische Wellenanalyse, der sich perfekt für den praktischen Handel eignet! Fall...
Hinweis: Ich bin es nicht gewohnt, westliche Namen für die Welleneinstufung zu verwenden. Aufgrund des Einflusses der Namenskonvention von Tang Lun (Tang Zhong Shuo Zen) habe ich die Grundwelle als Stift und das sekundäre Wellenband als Segment bezeichnet Gleichzeitig hat das Segment die Trendrichtung benannt (diese Benennungsmeth

Ekom Spike Detektor Pro
Bringen Sie Ihr Trading auf die nächste Stufe mit dem Ekom Boom and Crash Spike Detector Indicator Pro, der für ernsthafte Trader entwickelt wurde, die mehr verlangen. Diese erweiterte Version bietet: Hauptmerkmale: Präzise Spike-Erkennung: Identifizierung von Spike-Mustern mit hoher Wahrscheinlichkeit in Echtzeit anhand der Preisentwicklung Klare visuelle Signale: Klare Kauf- und Verkaufspfeile auf dem Chart für eine einfache Entscheidungsfindung Warnungsoptionen : MT5

AW Super Trend – Dies ist einer der beliebtesten klassischen Trendindikatoren. Es hat eine einfache Einstellung, ermöglicht es Ihnen, nicht nur mit dem Trend zu arbeiten, sondern zeigt auch das Stop-Loss-Level an, das von diesem Indikator berechnet wird. Vorteile:
Instrumente: Währungspaare , Aktien, Rohstoffe, Indizes, Kryptowährungen. Zeitrahmen: М15 und höher. Handelszeit: Rund um die Uhr. Zeigt die Richtung des aktuellen Trends an. Berechnet den Stop-Loss. Es kann bei der Arbeit mi
FREE
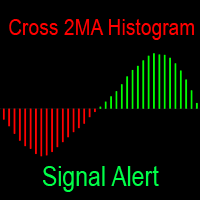
Der Indikator zeigt den Unterschied zwischen den beiden gleitenden Durchschnitten in Form eines Histogramms an. Gleitende Durchschnitte haben enorme Anpassungsmöglichkeiten. Benachrichtigt Sie auf alle Arten, wenn sich die Farbe des Histogramms ändert: Er piept im Terminal, sendet eine Benachrichtigung an das Telefon und einen Brief an die Post — jetzt verpassen Sie definitiv keinen Deal. Ein völlig kostenloser Indikator für den Schnittpunkt von gleitenden Durchschnitten in Form von Linien im Di
FREE
Monet Signal Master - Fortgeschrittenes neuronales Handelssystem Version 1.00 Autor: MONETFX Einführung Monet Signal Master ist ein professioneller technischer Indikator für MetaTrader 5, der mit Hilfe einer fortschrittlichen Multi-Oszillator-Analyse nicht nachmalende Kauf- und Verkaufssignale erzeugt. Der Indikator kombiniert Stochastik- und RSI-Crossover mit SuperTrend-Filterung, um Handelsmöglichkeiten mit hoher Wahrscheinlichkeit zu identifizieren. Zu den Funktionen gehören ein Dashboard im
FREE

Der Indikator zeichnet automatisch die Fibonacci-Niveaus basierend auf dem ZigZag-Indikator, Handelssitzungen, Fraktalen oder Kerzen (einschließlich nicht standardmäßiger Zeitrahmen: Jahr, 6 Monate, 4 Monate, 3 Monate, 2 Monate) (Auto-Fibo-Retracement). Sie können einen beliebigen höheren Zeitrahmen für die Fibonachi-Berechnung wählen. Die Level werden jedes Mal neu gezeichnet, wenn der aktuelle Balken schließt. Es ist möglich, Warnungen beim Überschreiten der angegebenen Ebenen zu aktivieren.
Volume Profile Density V2.40 Zeigt die Volumenverteilung nach Preisniveau und offenbart Zonen institutionellen Interesses.
Im Gegensatz zum klassischen Volumen (über Zeit) zeigt es, wo tatsächlich gehandelt wurde. Grundprinzipien: Horizontale Balken = gehandelte Volumen pro Preis Längerer Balken → höheres Volumen Rote Zonen = wichtige Unterstützungen / Widerstände Hauptzwecke: Echte Unterstützungs- und Widerstandszonen erkennen POC (Point of Control) bestimmen Value Area (70 % des Volumens) defi
FREE

VR Sync Charts ist ein Dienstprogramm zum Synchronisieren von Markierungen zwischen Fenstern. Mit VR Sync Charts werden Ihre Trendebenen, horizontale Ebenen, Fibonacci-Markierung mit allen Diagrammen synchronisiert. Das Dienstprogramm erm?glicht, alle Standard-Grafikobjekte im MetaTrader-Terminal zu synchronisieren, alle Ihre Trends, Gann-Linien und andere Objekte werden genau auf benachbarte Diagramme kopiert. Sie m?ssen nicht mehr ihre Lineatur und Markierung manuell kopieren. Unten in den Abb

CandleTimeAndSpreadLine - Kerzenzeit und Spread in Echtzeit CandleTimeAndSpreadLine ist ein Indikator, der zwei wichtige Informationen direkt auf dem Chart anzeigt:
(1) die verbleibende Zeit der aktuellen Kerze und
(2) den Spread in Punkten, beide verankert mit dem gewählten Referenzpreis (Ask, Bid oder Mid). Es verwendet die OnTimer-Aktualisierung , die sicherstellt, dass die Zeit auch in Zeiten geringer Marktaktivität weiterläuft.
Die Werte werden in Form von Etiketten angezeigt, die dem Char
FREE

Der Indikator stellt einen Trendkanal nach der Technik von Gilbert Raff dar. Die Kanalachse ist eine Regression erster Ordnung. Die obere und untere Linie zeigen die maximale Entfernung der Close-Linie von der Achsenlinie an. Daher können die obere und die untere Linie als Widerstands- bzw. Unterstützungslinien betrachtet werden. Eine ähnliche Version des Indikators für das MT4-Terminal
In der Regel finden die meisten Kursbewegungen innerhalb eines Kanals statt, wobei die Unterstützungs- oder W
FREE

Löwenpfeil-Superpfeil-Indikator für MetaTrader 5
Der Lion Arrow Super Arrow Indicator für MetaTrader 5 ist ein hybrides Handelssystem, das mehrere fortschrittliche technische Analysetools integriert, um hochwertige Handelssignale zu generieren. Durch die Kombination von trend-, momentum- und druckbasierten Indikatoren zielt er darauf ab, Fehlsignale zu reduzieren und die Einstiegsgenauigkeit zu verbessern. Kernkomponenten des Indikators Der Lion Arrow Super Arrow-Indikator basiert auf mehreren
FREE

BOOM UND CRASH PRO SPIKER Dieser Indikator ist speziell für alle Boom- und Crash-Indizes konzipiert. Der Indikator zielt auf Buy-Spike-Signale für Boom-Indizes und Sell-Spike-Signale für Crash-Indizes. Der Indikator enthält optimierte Trendfilter, um Kauf-Spikes in einem Aufwärtstrend und Verkaufs-Spikes in einem Abwärtstrend zu erkennen. Der Indikator fügt außerdem ein Rastersignal hinzu, um einen Teil des Verlustes des ersten Signals auszugleichen. Der Indikator liefert auch Ausstiegssignale
FREE
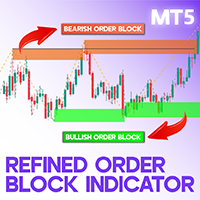
Verfeinerter Orderblock-Indikator für MT5 Der Indikator Refined Order Block (OBR ) wurde für ICT- und Smart-Money-Strategien entwickelt und ist ein unverzichtbares Werkzeug für Händler auf der MetaTrader 5 (MT5 )-Plattform. Er identifiziert und hebt wichtige Kursniveaus hervor, indem er bullische Orderblöcke in Grün und bearische Orderblöcke in Braun markiert. Diese Niveaus stellen potenzielle Preisumkehrzonen dar, die oft durch große institutionelle und Bankaufträge beeinflusst werden. Wenn der

Sind Sie es leid, Unterstützungs- und Widerstandsniveaus für Ihre Kurse zu zeichnen? Lernen Sie gerade, wie man Unterstützungen und Widerstände erkennt? Was auch immer Ihr Fall ist, Auto Support & Resistances zeichnet diese Levels für Sie! UND, es kann sie von anderen Zeitrahmen direkt in Ihr aktuelles Diagramm einzeichnen, unabhängig davon, welchen Zeitrahmen Sie verwenden... Sie können auch Regionen/Zonen zusammenfassen, die zu nahe beieinander liegen, und sie in ein einziges Support & Resista
FREE

Smart Session Box Zeigt die Handelssitzungen in Asien, London und New York mit automatischer Zeitzonenanpassung und Hervorhebung von Sitzungsüberschneidungen an. Wichtigste Merkmale Vollständige Sitzungsanalyse ohne Einschränkungen. Hauptmerkmale Der Indikator zeichnet Session-Boxen mit Hoch- und Tiefstkursen für jede Handelssitzung. Sitzungsüberschneidungen werden mit unterschiedlichen Farben hervorgehoben, um Perioden mit hoher Liquidität zu identifizieren. Ausbruchswarnungen benachrichtigen S
FREE
Trader Dynamic Index Added Signal – Ein wissenschaftlicher, kontextbasierter Ansatz zur Marktanalyse 1. Einführung In der modernen technischen Analyse liefern traditionelle Oszillatoren häufig isolierte Signale , die vom übergeordneten Marktkontext abgekoppelt sind, was zu einer hohen Anzahl falscher oder schwacher Signale führt.
Trader Dynamic Index Added Signal (TDI-AS) wurde entwickelt, um dieses Problem zu lösen, indem die Signalgenerierung von Oszillatoren neu definiert und die Berücksichti

War: $99 Jetzt: $49 Der Blahtech Daily Range-Indikator zeigt die durchschnittliche tägliche Spanne neben den einzelnen Sitzungsspannen an. Unter Verwendung des täglichen Eröffnungskurses als Referenz zeigt der Indikator feste und dynamische Kursziele als Linien auf den Charts an. Diese Linien zeigen deutlich, wann die durchschnittliche Spanne ausgeschöpft ist. Tages- und Sitzungsspannen können nützlich sein, um Einstiege zu bestätigen oder Ziele festzulegen, und sie sind eine hervorragende Mögli

Local Time Scale Overlay ist ein technischer Indikator für MetaTrader 5, der die Lesbarkeit des Charts verbessert, indem er eine lokale Zeitskala über das Chart legt. Er berechnet die Differenz zwischen Ihrer lokalen Systemzeit und der Serverzeit und verwendet diese Differenz, um Zeitlabels anzuzeigen, die Ihre lokale Zeit in vorgegebenen Intervallen darstellen. Das Zeitintervall lässt sich über ein Dropdown-Menü anpassen, das Optionen wie 5, 10, 15, 20, 30, 60, 120 und 480 Minuten bietet (mit 1
FREE

KT Price Border erstellt eine dreibandige Preiszone, die potenzielle Hoch- und Tiefpunkte des Marktes identifiziert. Diese Niveaus können auch als dynamische Unterstützungs- und Widerstandsbereiche genutzt werden. Das mittlere Band kann zudem zur Bestimmung der Trendrichtung verwendet werden, wodurch der Indikator auch als Trendfolge-Indikator fungiert. Darüber hinaus profitieren besonders Anfänger von der einfachen Handhabung und der klaren Signaldarstellung.
Funktionen
Funktioniert gut mit d

Der Entry IQ Indikator ist ein ausgefeiltes Werkzeug der technischen Analyse, das entwickelt wurde, um Trader bei der Identifizierung von Einstiegspunkten mit hoher Wahrscheinlichkeit für Long- und Short-Positionen zu unterstützen. Dieses fortschrittliche Handels-Dienstprogramm nutzt eine Kombination aus dynamischen Preisboxen, Gleichgewichtszonen und proprietären Trenderkennungsalgorithmen, um eine umfassende Analyse von Markttrends und Preisaktionen zu bieten. Durch die Synthese dieser Elemen
FREE
KT B-Xtrender ist eine weiterentwickelte Version des trendfolgenden Werkzeugs, das ursprünglich von Bharat Jhunjhunwala im IFTA-Journal vorgestellt wurde. Wir haben das Konzept verfeinert, um präzisere Signale und integrierte Benachrichtigungen bereitzustellen, damit Trader in Trendmärkten stärkere Handelschancen erkennen können. Obwohl der Indikator auf verschiedenen Zeitrahmen verwendet werden kann, zeigt er seine beste Leistung auf höheren Zeitrahmen wie dem 4-Stunden-Chart und dem Tageschar

Dies ist der ADX von Wilder mit der Wolkendarstellung der DI+ & DI- Linien. Merkmale
4 Standardlinien des ADX-Indikators: DI+, DI-, ADX, ADXR Wolkendarstellung der DI+/DI- Linien mit transparenten Farben anwendbar auf alle Zeitrahmen und alle Märkte
Was ist ADX
J. Welles Wilder Jr., der Entwickler bekannter Indikatoren wie RSI, ATR und Parabolic SAR, war der Meinung, dass das Directional Movement System, das teilweise im ADX-Indikator implementiert ist, seine zufriedenstellendste Leistung war. I
FREE
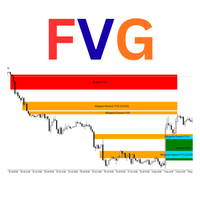
Luta FVG Pro - Professioneller Fair Value Gap (FVG) Indikator
Erkennt institutionelle Fair Value Gaps auf dem H4-Zeitrahmen auf die gleiche Weise wie ICT/SMC-Händler.
Merkmale: - Bullish & Bearish FVG-Erkennung in Echtzeit - Automatische Mitigation-Verfolgung - Umgekehrte FVG-Signale (sehr leistungsfähige Umkehr-Setups) - "GOOD" FVG Markierung (Lücken ≥ 2× Mindestgröße - höhere Wahrscheinlichkeit) - Saubere Rechtecke mit intelligenten Beschriftungen (Bullish FVG / Mitigated / Inverted) - Über
FREE

Ultimativer Pivot Levels Indikator für MetaTrader 5 Ultimate_Pivot_Levels ist ein vielseitiges Tool, das Ihre Handelserfahrung durch die genaue Darstellung von Pivot-Levels in Ihren Charts verbessert. Es ermöglicht die manuelle Eingabe der gewünschten Werte oder die Verwendung bekannter Pivot-Berechnungsmethoden zur Erstellung von Pivot-Levels. Es zeichnet die Niveaus im Hintergrund und erlaubt Ihnen, die Niveaus, die Größe und die Farben der Bereiche anzupassen, und es behält Ihre Anpassungen b
FREE
Mit diesem Indikator können Sie mehrere Währungspaare und Zeitrahmen auf einmal überwachen. Er zeigt das Auftreten von Divergenzen zwischen dem Preis und dem MACD-Indikator in einer übersichtlichen und leicht zu lesenden Tabelle an. Die Überwachung mehrerer Zeitrahmen und Währungspaare an einem Ort hilft Händlern, eine Divergenz zu erkennen, ohne dass sie zwischen den Charts wechseln müssen. Divergenzen können sowohl nach oben als auch nach unten gerichtet sein. Wenn der Kurs beispielsweise ein

Beschreibung (Für MQL5 Website/Markt)
Titel: Subho SMC Konzept & Trend-Signale
Untertitel: All-in-one Smart Money Concepts (SMC) Dashboard mit SUBHO Signalen.
Beschreibung: Das Subho SMC Concept & Trend Signals ist ein umfassendes, professionelles Handelssystem für den MetaTrader 5. Es automatisiert fortgeschrittene Smart Money Concepts (SMC) und kombiniert sie mit dem proprietären "SUBHO Signal System", um hochwahrscheinliche Handels-Setups zu finden. Dieser Indikator hilft Ihnen, die wahre

MTF VWAP-Indikator - Kurzübersicht Dieser Indikator zeigt Ihnen anhand des volumengewichteten Durchschnittspreises (VWAP), wohin institutionelles Geld über mehrere Zeitrahmen hinweg fließt, um Handelszonen mit hoher Wahrscheinlichkeit zu identifizieren. Was er tatsächlich tut: 1 . verfolgt die Smart Money Levels: - Zeigt auf Tages-, Wochen- und Monatsbasis die VWAP-Linien an, auf denen große Akteure (Banken, Fonds) handeln. - Sagt Ihnen, ob der Kurs über oder unter diesen wichtigen institutionel

Der Indikator liefert Pivotpunkt-basierte Trendlinien mit hervorgehobenen Ausbrüchen . Trendlinie caculated von Pivot-Punkt und andere Anhaltspunkte sind ATR, Stdev. Der Indikator enthält auch integrierte Alarme für Trendlinienausbrüche und leitet auf Wunsch eine Nachricht an einen Telegram-Kanal oder eine Gruppe weiter . Einstellungen - Rückblick Bar: Standardmäßig 200 ist die Anzahl der Balken, die beim Start des Indikators kalkuliert werden. - Länge: Zeitraum der Pivot-Punkte - Slope Berechnu
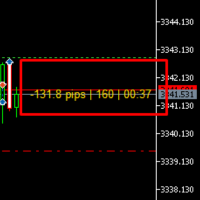
Ultimate Trading Companion Indicator für MT5
Hallo!
Dieser intelligente und einfach zu bedienende Indikator wurde entwickelt, um Ihnen einen klaren Vorteil auf dem Markt zu verschaffen. Er zeigt an: Live Pips of Open Trades - Sehen Sie sofort, wie viel Sie in Pips gewinnen oder verlieren. Kerzen-Countdown-Timer - Sie wissen genau, wann die aktuelle Kerze geschlossen wird. Echtzeit-Spread-Anzeige - Behalten Sie die Marktbedingungen im Auge und vermeiden Sie Fehleinstiege. Vollständig anpassbare

Malaysischer SnR Pro: Fortgeschrittener Multi-Timeframe Unterstützungs- und Widerstandsindikator Professionelle Erkennung von Unterstützungen und Widerständen mit Top-Down-Analyse Malaysian SnR Pro ist ein umfassender Unterstützungs- und Widerstandsindikator, der fortschrittliche Preisanalysetechniken implementiert, die von institutionellen Händlern verwendet werden.
Unter Verwendung eines ausgeklügelten Multi-Timeframe-Ansatzes identifiziert er wichtige Marktniveaus mit Präzision und filtert M
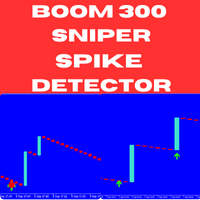
Wir stellen Ihnen den Boom 300 Sniper Spike Detector vor - einen leistungsstarken, nicht nachmalenden Indikator, der speziell entwickelt wurde, um Ihnen zu helfen, den Spike-Handel im Boom 300-Markt zu meistern. Egal, ob Sie ein erfahrener Trader oder ein Neuling sind, dieses Tool bietet präzise und zeitnahe Signale, die es Ihnen ermöglichen, Spikes mit Zuversicht abzufangen und Ihre allgemeine Handelsleistung zu verbessern. Hauptmerkmale: Nicht wiederholende Signale : Sorgt für konsistente und
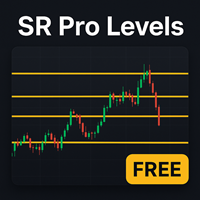
Erhalte glasklare Marktstruktur in Sekunden – ohne manuelles Zeichnen!
Der HTF Auto Support & Resistance Indikator markiert automatisch die entscheidenden Unterstützungs- und Widerstandslevel direkt auf deinem Chart. Diese Levels basieren auf höherer Zeiteinheit (HTF) und sind daher deutlich zuverlässiger als kurzfristige Zufallslinien. Hauptfunktionen: Automatische Erkennung der stärksten Support- & Resistance-Zonen Multi-Timeframe-Analyse : Wähle die höhere Zeiteinheit für präzisere Levels Kla
FREE

Beschreibung :
VWAP (Volume-Weighted Average Price) ist das Verhältnis zwischen dem gehandelten Wert und dem gesamten gehandelten Volumen über einen bestimmten Zeithorizont. Es ist ein Maß für den durchschnittlichen Preis, zu dem ein Paar über den Handelshorizont gehandelt wird. Lesen Sie mehr.
Alle Symbole und alle Zeitrahmen werden unterstützt.
Indikator Eingaben :
VWAP Modus : Modus der VWAP-Berechnung. Auswählbare Optionen: Einzeln, Session, Täglich, Wöchentlich, Monatlich
Volumina :

Er prognostiziert die wahrscheinlichste kurzfristige Kursbewegung auf der Grundlage fortgeschrittener mathematischer Berechnungen.
Merkmale Schätzung der unmittelbaren Preisbewegung; Berechnung des tatsächlichen Markttrends; Berechnung der wichtigsten Unterstützungs- und Widerstandsniveaus; Optimierte Algorithmen für die Durchführung komplexer mathematischer Berechnungen bei minimaler Beanspruchung der Systemressourcen; Selbstanpassung für eine bessere Leistung, so dass es mit jedem Symbol (ega

Dominion-Levels: Der Architekt der "Marktstruktur"
Perfekt für XAUUSD (Gold)
Das endgültige Tool zur Identifizierung von "harten" Unterstützungs- und Widerstandsniveaus, die tatsächlich halten. Die meisten Händler ziehen Unterstützungs- und Widerstandslinien auf der Grundlage von Gefühlen oder vagen Zonen. Das Ergebnis? Unübersichtliche Charts, subjektive Entscheidungen und Ausstiegsmöglichkeiten durch "Lärm". Dominion Levels löst dieses Problem, indem es die Subjektivität beseitigt. Es handel
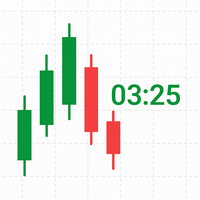
TimeLeftCandle - Countdown-Uhr für Kerzen in MT5 Übersicht
TimeLeftCandle ist ein Indikator für MetaTrader 5, der in Echtzeit die verbleibende Zeit bis zum Schließen der aktuellen Chartkerze anzeigt. Sein Design ist minimalistisch, klar und beweglich und passt sich an jede Art von Chart und Handelsstil an. Ideal für Händler, die die Kerzenschlusszeiten genau verfolgen und rechtzeitig Entscheidungen treffen müssen. Die wichtigsten Vorteile Klare und präzise Anzeige: Ein digitaler Zähler, der gen
FREE

Der Magic Histogram MT5 Indikator ist ein universelles Werkzeug, geeignet für Scalping und mittelfristiges Trading. Dieser Indikator verwendet eine innovative Formel und ermöglicht es Ihnen, die Richtung und Stärke des Trends zu bestimmen. Magic Histogram MT5 wird nicht neu gezeichnet, sodass Sie seine Effizienz anhand von Verlaufsdaten bewerten können. Es ist am besten geeignet für M15, M30, H1 und H4.
Vorteile des Indikators Hervorragende Indikatorsignale! Geeignet für Anfänger und erfahren
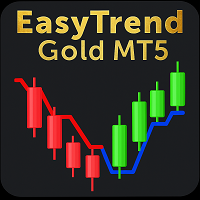
Haben Sie genug von verwirrenden Indikatoren, insbesondere beim Handel auf dem volatilen Goldmarkt? Der EasyTrend Gold MT5 wurde entwickelt, um die Volatilität von Gold in jeder Zeiteinheit zu bändigen. Er nutzt die Kraft des ATR, um die scharfen Bewegungen von Gold in eine einzige, klare und dynamische Trendlinie zu übersetzen, die das Rauschen eliminiert. Egal, ob Sie im M1-Chart scalpen oder im H4-Chart Swing-Trading betreiben, Sie können die Trendrichtung und -stärke visualisieren, Konsolidi
FREE

Dies ist ein einfacher Candle Stick Pattern Indikator, der in jeder Zeiteinheit funktioniert und nach standardmäßigen Paramtern automatisch entsprechende Pattern im Chart anzeigt, sobald die Bedingungen erfüllt sind. Folgende Candle Stick Pattern sind derzeit implementiert: Bullish Hammer | Bearish Hammer Bullish Inverted Hammer | Bearish Inverted Hammer Bullish Engulfing | Bearish Engulfing Piercing | Dark Cloud Cover Bullish 3 Inside | Bearish 3 Inside Die Formationen werden automatisch berech
FREE

Dieser Indikator zeichnet regelmäßig bullische und bärische Divergenzen in Echtzeit in die Charts ein. Der Algorithmus zur Erkennung dieser Divergenzen basiert auf meiner über 10-jährigen Erfahrung mit der visuellen Erkennung von Divergenzen. Die Divergenzen werden als grüne und rote Rechtecke auf den Charts dargestellt. Sie können sogar im visuellen Modus des Strategietesters ein Forward Testing durchführen.
Parameter Schnelle EMA-Periode: Die Periode des schnellen EMA des MACD. Der Standardwe

Der Order Block Indikator für MT5 ist ein leistungsstarkes Tool für Trader, die mit Smart Money Konzepten und institutionellen Handelsstrategien arbeiten. Er erkennt automatisch die wichtigsten Orderblöcke auf dem Chart und hilft, hochwahrscheinliche Umkehr- und Fortsetzungszonen zu identifizieren.
Hauptmerkmale: • Automatische Erkennung von Orderblöcken – Markiert starke Kauf- und Verkaufszonen basierend auf Preisbewegung und Volumen. • Multi-Timeframe-Unterstützung – Analysie
FREE

Der Heikin Ashi-Indikator ist unsere Version des Heikin Ashi-Charts. Im Gegensatz zu Konkurrenzprodukten bietet dieser Indikator umfangreiche Optionen zur Berechnung von Heikin Ashi-Kerzen. Darüber hinaus kann er als klassische oder geglättete Version angezeigt werden.
Der Indikator kann Heikin Ashi mit gleitendem Durchschnitt nach vier Methoden berechnen: SMA - Einfacher gleitender Durchschnitt SMMA - Geglätteter gleitender Durchschnitt EMA - Exponentieller gleitender Durchschnitt LWMA - Linea
FREE

Dieser Indikator findet und zeigt die technischen Analysemuster Double Bottom und Double Top an. Signalisiert (zeigt eine Meldung auf dem Bildschirm an), wenn die Form vor kurzem geformt wurde. Nach dem Auftreten dieser Muster kehrt sich der Trend oft um oder es kommt zu einer Korrektur. Um nicht selbst nach ihnen zu suchen oder ihr Aussehen nicht zu verpassen, reicht es aus, dem Diagramm einen Indikator hinzuzufügen. Der Indikator kann für verschiedene Zeitrahmen und Währungspaare verwendet we
FREE

Dieses wunderbare Tool funktioniert bei jedem Paar und gibt Warnungen aus, sobald der Markt in die überkauften und überverkauften Zonen des Marktes eintritt. Die Signale werden als KAUFEN oder VERKAUFEN ausgegeben, was aber nicht unbedingt bedeutet, dass Sie einen Auftrag ausführen sollten, sondern dass Sie beginnen sollten, das Diagramm auf eine mögliche Umkehr zu untersuchen. Für fortgeschrittene Signal-Tools sehen Sie sich einige unserer Premium-Tools wie Dual Impulse an.
FREE

Preis-Volumen-Trend (PVT) Oszillator Beschreibung: Der PVT Oscillator ist ein Volumenindikator, der als Alternative zum Standard On-Balance Volume (OBV) dient. Während gewöhnliche Volumenindikatoren verrauscht und schwer ablesbar sein können, wandelt dieses Tool den Volumenfluss in einen klaren Histogramm-Oszillator um, ähnlich wie ein MACD, aber für Volumen. Es wurde entwickelt, um erste Trendumkehrungen und Divergenzen zu erkennen, indem es die Differenz zwischen einem schnellen und einem lang
FREE

War: $49 Jetzt: $33 Blahtech Better Volume bietet eine verbesserte Version der vertikalen Volumenbalken. Jeder Balken wird mit den vorherigen 20 Balken verglichen. Abhängig von seinem Volumen, seiner Reichweite und seiner Volumendichte wird ihm ein Status und eine Farbe zugewiesen. Geringes Volumen - Minimales Volumen High Churn - Erhebliches Volumen mit begrenzter Bewegung Climax Neutral - Hohes Volumen mit unklarer Richtung
Climax Up - Hohes Volumen mit steigender Tendenz Climax Dn - Hohes Vo

Kurzanleitung - Angebot & Nachfrage Smart Signals Installation (5 Minuten) Schritt 1: Installieren Sie den Indikator Öffnen Sie MetaTrader 5 Klicken Sie auf Datei → Datenordner öffnen Navigieren Sie zu MQL5 → Indikatoren Kopieren Sie SupplyDemand_CleanSignals.mq5 in diesen Ordner Starten Sie MT5 neu oder drücken Sie im Navigator auf Aktualisieren Schritt 2: Zum Chart hinzufügen Öffnen Sie den gewünschten Chart (beliebiges Symbol, beliebiger Zeitrahmen) Suchen Sie im Navigator-Panel Indikatoren →

NovaTrend Pro All-in-One Trading Suite: SuperTrend, Smart Trail, Range Filter, SuperIchi, TBO, Reversal Cloud, MACD-Kerzenfarben und S/R-Levels — in einem einzigen Indikator. Die Verwaltung mehrerer Indikatoren fuehrt zu ueberladenen Charts, widerspruechlichen Signalen und verpassten Gelegenheiten. NovaTrend Pro vereint sieben leistungsstarke Analysemodule in einem einzigen, ressourcenschonenden Chartfenster-Indikator. Von Trendfolge und adaptiven Trailing-Stops ueber Momentum-basierte Kerzenfae
FREE

Dieser Indikator wurde konvertiert von 5 min Buy and Sell Range Filter - guikroth version auf TradingView Beliebtheit des Range Filters
Der Range Filter ist ein sehr beliebter und effektiver Indikator. Mit ein paar einfachen Einstellungen ist es möglich, den Range Filter zum Filtern von Kursbewegungen zu verwenden, sei es zur Bestimmung der Trendrichtung oder der Spannen, zum Timing von Ausbrüchen oder sogar von Umkehrbewegungen. Seine praktische Vielseitigkeit macht ihn ideal für die Integrati

Boom und Crash Gold Miner v2 Trend Histogramm, das in Verbindung mit dem Indikator oben, die Pfeile hat, wie im Video gezeigt funktioniert. BITTE beachten Sie: Der obere Indikator und der untere Indikator sind zwei separate Indikatoren. der obere Indikator ist https://www.mql5.com/en/market/product/98066 Der untere Indikator ist kostenlos. Das ist das Histogramm am unteren Rand. das trend histogramm trading tool, das hilft, den trend leicht zu erkennen blaue farbe zeigt einen aufwärtstrend an. O
FREE

Was ist der VWAP? Der volumengewichtete Durchschnittspreis (VWAP) ist eine Handelsbenchmark, die den nach Volumen gewichteten Durchschnittspreis eines Wertpapiers über einen bestimmten Zeitraum widerspiegelt. Er hilft Händlern bei der Ermittlung des fairen Wertes und wird häufig im Intraday-Handel verwendet, um die Kursentwicklung im Vergleich zu institutionellen Handelsniveaus zu bewerten. Hauptmerkmale von Anchored VWAP PRO Verankerte Berechnung : Im Gegensatz zum traditionellen VWAP, der tägl

Der gleitende Hull-Durchschnitt ist in Anfängern und vielleicht auch in fortgeschrittenen Handelskreisen nicht sehr bekannt, aber er ist eine sehr schöne Lösung, die von dem Händler Alan Hull entwickelt wurde - bitte besuchen Sie www.AlanHull.com für alle Einzelheiten seiner Kreation. Der Zweck dieses gleitenden Durchschnitts ist es, beide Probleme zu lösen, die alle bekannten und üblichen gleitenden Durchschnitte haben: Lag und Choppiness . Die Implementierung, die wir gemacht haben, hat neben
FREE
AlgoRhythm ZLSMA - Die ultimative Lösung für den Trendhandel Erschließen Sie die Kraft des Präzisionshandels mit AlgoRhythm ZLSMA , einem fortschrittlichen technischen Indikator, der messerscharfe Trendsignale liefert. Entwickelt für MetaTrader 5, kombiniert dieser hochmoderne Zero Lag Smoothed Moving Average (ZLSMA) hochentwickelte Glättungsverfahren, Multi-Timeframe-Analyse und dynamische Bänder, um Händlern einen Wettbewerbsvorteil in jedem Markt zu geben. Egal ob Sie ein Scalper, Swing Trade
FREE
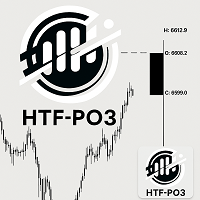
HTF Power of Three (ICT) - MT5 Indikator - Version 1.1 Überblick Der HTF Power of Three-Indikator ist eine professionelle Umsetzung des Power of Three-Konzepts des Inner Circle Trader (ICT), das von Larry Williams inspiriert wurde. Dieser Indikator visualisiert die Entwicklung von HTF-Kerzen in Echtzeit auf jedem Chart mit niedrigerem Zeitrahmen und ist damit ein unverzichtbares Werkzeug für ICT-Händler, die institutionelle Kursbewegungsmuster studieren. Was ist Power of Three (PO3)? Power of Th
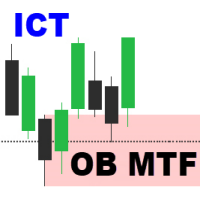
Order Block Multi Timeframe Order Block Multi Timeframe ist ein leistungsfähiges Tool für Smart Money Concept (SMC)-Händler, das eine hochpräzise Order Block-Erkennung mit einer Echtzeit-Analyse von Break of Structure (BOS) und Change of Character (CHoCH) über mehrere Zeitrahmen kombiniert. Smart Money Insight, Multi-Timeframe-Präzision Dieser Indikator identifiziert automatisch institutionelle Orderblöcke - wichtige Preiszonen, in denen große Akteure in den Markt eingetreten sind - und zeichnet

Currency Strength Meter is the easiest way to identify strong and weak currencies. This indicator shows the relative strength of 8 major currencies + Gold: AUD, CAD, CHF, EUR, GBP, JPY, NZD, USD, XAU. Gold symbol can be changed to other symbols like XAG, XAU etc. By default the strength value is normalised to the range from 0 to 100 for RSI algorithm: The value above 60 means strong currency; The value below 40 means weak currency;
This indicator needs the history data of all 28 major currency
Überblick Der Market Perspective Structure Indicator ist ein umfassender MetaTrader-Indikator, der Händlern eine detaillierte Analyse der Marktstruktur über mehrere Zeitrahmen hinweg bietet. Er identifiziert und visualisiert wichtige Preisaktions-Elemente, einschließlich Swing-Hochs und -Tiefs, Break of Structure (BOS), Change of Character (CHOCH), interne Strukturen, gleiche Hochs/Tiefs, Premium/Discount-Levels, frühere Levels aus höheren Zeitrahmen und Handelssitzungszonen. Dank umfangreicher

Willkommen beim EPo-CreW Forex Super ORB-H4 Indikator!
Diese Anleitung zeigt Ihnen, wie Sie dieses leistungsstarke Tool nutzen können, um Handelschancen mit hoher Wahrscheinlichkeit zu identifizieren – basierend auf der ersten 4-Stunden-Eröffnungsrange des Marktes.
Egal, ob Sie Anfänger oder erfahrener Trader sind, dieses System hilft Ihnen, mit mehr Vertrauen und Konstanz zu handeln. DIES IST EIN DEMO-PRODUKT. ES LÄUFT 30 TAGE NACH DEM INSTALLATIONSDATUM AB. Volle Version hier verfügbar : https
FREE
Supertrend G5 Indikator Supertrend G5 ist ein leistungsfähiges Trendfolge-Tool, das entwickelt wurde, um Marktumkehrpunkte genau zu identifizieren. Durch die Anzeige einer farbkodierten Linie direkt auf dem Chart hilft Ihnen dieser Indikator, Aufwärtstrends (grün) und Abwärtstrends (rot) schnell zu erkennen, und unterstützt so optimale Einstiegs- und Ausstiegspunkte. Hauptmerkmale: Klare Kauf-/Verkaufssignale Kaufen Sie, wenn die Supertrend-Linie von rot nach grün wechselt (Beginn eines Aufwärts
FREE

Super Signal Serie - V2 PRO Falcon Real Time Trend Rider Signals - Professionelles MT4 Dashboard Exklusiver GRATIS Bonus Exklusiver Bonus Wenn Sie diesen Indikator kaufen, erhalten Sie 2 professionelle Gold EAs: MT4 Gold EA
XAU Trend Matrix EA - Im Wert von $150 : Siehe den EA https://www.mql5.com/en/market/product/162870 MT5 Gold EA
XAU Steady Gain Pro - Im Wert von $150 : Siehe den EA https://www.mql5.com/en/market/product/162861 Gesamter Bonuswert: $300 Beschreibung des Produkts Falcon Trend
Advanced Trend Analyzer Pro MT5 Das ultimative Multi-Strategie-Trend-Analyse-System, das niemals nachlässt Transformieren Sie Ihr Trading mit professioneller Marktanalyse Advanced Trend Analyzer Pro MT5 ist ein revolutionärer Indikator, der Fuzzy Logic , Multi-Timeframe-Analyse und Währungsstärke-Technologie in einem leistungsstarken Handelssystem kombiniert. Entwickelt für ernsthafte Trader, die Präzision, Zuverlässigkeit und konsistente Leistung unter allen Marktbedingungen verlangen.

Dieser Indikator identifiziert automatisch Nachfrage- und Angebotszonen auf einer Anzahl von 1000 Kerzen oder mehr, und Sie können diese Anzahl von Einstellungen ändern.
Es trägt auch ein hohes Maß an Genauigkeit bei der Beschreibung der Art der einzelnen Zonen, wie es enthält:
Schwache Bereiche .
Ungetestete Bereiche . Starke Bereiche . Rollentragende Bereiche . Getestete Bereiche + Anzahl der Besuche . Bereiche, in denen eine Rückkehr erwartet wird, je nach Richtung . Der Indikator enthält Al
FREE
MetaTrader Market - der einzige Shop, in dem man Handelsroboter als Demoversion herunterladen und testen sowie anhand historischer Daten optimieren kann.
Lesen Sie die Beschreibung und Bewertungen anderer Kunden über das gewünschte Produkt, laden Sie es direkt ins Terminal herunter und erfahren Sie, wie man einen Handelsroboter vor dem Kauf testet. Nur bei uns können Sie ein Programm testen, ohne dafür zu bezahlen.
Sie verpassen Handelsmöglichkeiten:
- Freie Handelsapplikationen
- Über 8.000 Signale zum Kopieren
- Wirtschaftsnachrichten für die Lage an den Finanzmärkte
Registrierung
Einloggen
Wenn Sie kein Benutzerkonto haben, registrieren Sie sich
Erlauben Sie die Verwendung von Cookies, um sich auf der Website MQL5.com anzumelden.
Bitte aktivieren Sie die notwendige Einstellung in Ihrem Browser, da Sie sich sonst nicht einloggen können.