Conheça o Mercado MQL5 no YouTube, assista aos vídeos tutoriais
Como comprar um robô de negociação ou indicador?
Execute seu EA na
hospedagem virtual
hospedagem virtual
Teste indicadores/robôs de negociação antes de comprá-los
Quer ganhar dinheiro no Mercado?
Como apresentar um produto para o consumidor final?
Indicadores Técnicos para MetaTrader 5 - 10
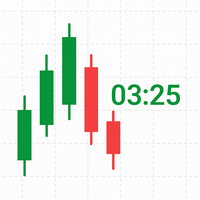
TimeLeftCandle – Countdown Clock for Candles in MT5 Overview
TimeLeftCandle is an indicator for MetaTrader 5 that displays in real time the remaining time until the current chart candle closes. Its design is minimalist, clear, and movable, adapting to any type of chart and trading style. Ideal for traders who need to precisely track candle closing times and make timely decisions. Main Advantages Clear and precise display: A digital-style counter to know exactly how much time is left before the
FREE

The Heikin Ashi indicator is our version of the Heikin Ashi chart. Unlike competitor products, this indicator offers extensive options for calculating Heikin Ashi candles. In addition, it can be displayed as a classic or smoothed version.
The indicator can calculate Heikin Ashi with moving average by four methods: SMA - Simple Moving Average SMMA - Smoothed Moving Average EMA - Exponential Moving Average LWMA - Linear Weighted Moving Average
Main features The indicator shows Heikin As
FREE

O indicador foi desenvolvido para mostrar as linhas de tendência de preços, e a linha do canal de alta e o de baixa. Com essas linhas é possível identificar a tendência dos preços mais facilmente. Ele utiliza as diferentes trendlines e pontos de resistência e suporte para gerar automaticamente as melhores linhas de tendência TLH e TLL, e mostra os ângulos em pips ( percentage in points ) de cada linha. Além disso mostra os pontos identificados como suportes e resistências através do algoritmo
FREE

ملاحظة مهمة: الصورة المعروضة على الشاشة هي من بين مؤشرين: أو مؤشر "مستويات سليمان" أو مؤشر "RSI Trend V". سليمان ليفلز أداة متكاملة ومدربة تدريبًا احترافيًا. تحتوي على حوالي 9800 سطر من التعليمات البرمجية ، وتتميز بتحليلات رسومية متعددة واضحة. لا يوجد مؤشر واحد فقط. الموارد الممكنة لمستويات سليمان: Caixas amarelas (Detecção de Fluxos Financeiros) - ملاحظة لـ caixas amarelas: "للعودة بشكل كامل إلى المبتكر والحصري للمؤشر - مصمم إلى الصفر" : اكتشاف مدخلات رأس مال البنوك والمؤسسات في شركا

Indicador de Bloco de Ordem para MT5
O Order Block Indicator para MT5 é uma ferramenta poderosa para traders que utilizam conceitos de dinheiro inteligente e estratégias institucionais. Ele detecta automaticamente os principais blocos de ordem no gráfico, ajudando a identificar zonas de alta probabilidade de reversão e continuação da tendência.
Principais características: • Detecção automática de blocos de ordem – Destaca zonas fortes de compra e venda com base na ação do preço e
FREE

The indicator that shows the countdown to the change of candles is equipped with an alert when the bar changes (the alert is not active if installed on the M1 time frame). Displays seconds if installed in time frame M1, displays minutes and seconds if installed in time frame above M1, and displays hours and minutes if installed in time frame h1 and above. The time displayed is calculated based on the running time.
FREE

Medidor de Média Móvel Phoenix (MT5)
Ferramenta profissional de análise e visualização de tendências de média móvel para MetaTrader 5. Combina análise inteligente de inclinação, medição da largura da nuvem e classificação de regime em um painel limpo e em tempo real.
Visão geral
O Medidor de Média Móvel Phoenix analisa a relação entre uma média móvel rápida e lenta para determinar a direção, a força e a maturidade da tendência. O indicador monitora continuamente o ângulo da inclinação da MA,
FREE

Easy Trend , como o próprio nome diz, é um indicador que exibe de forma fácil a tendência predominante juntando diversos indicadores em um só. A estratégia é: quando todos os indicadores apontarem para a mesma direção um sinal é disparado. Quando vermelho, é sinale venda, quando azul, sinal de compra. É simples assim :) Há um total de 9 indicadores: Média Móvel, RSI (ou IFR), CCI, Parabolic SAR, William's Range, Estocástico, MACD, ADX e Heiken Ashi. É possível configurar cada um desses indicador

M5 Scalp Wick Entry Arrows This indicator displays two independent types of arrows directly on the chart. Both arrow types are calculated strictly from M5 data, while the indicator can be attached to any timeframe for convenient viewing and analysis. Arrows help visually mark potential moments of interest without overloading the chart. You can adjust arrow size and colors in the settings to match your template. Tested on XAUUSD (Gold) and EURUSD.
FREE

Stargogs Spike Catcher V4.0 This Indicator is Developed To milk the BOOM and CRASH indices .
Now Also work on weltrade for PAIN and GAIN indices. Send me Message if you need any help with the indicator. CHECK OUT THE STARGOGS SPIKE CATCHER EA/ROBOT V3: CLICK HERE ALSO CHECK OUT SECOND TO NONEFX SPIKE CATCHER: CLICK HERE STARGOGS SPIKE CATCHER V4.0 WHATS NEW! Brand New Strategy. This is the Indicator you need for 2025. New Trend Filter to minimize losses and maximize profits. New Trendline th
Ekom Spike Detector
Navigate the volatile world of Boom and Crash indices with the Ekom Spike Detector Indicator. This powerful tool detects explosive price movements, providing traders with precise buy and sell signals 24/7.
Key Features:
Spike Detection : Identify high-probability spike patterns in real-time Clear Visual Signals : Displays clear buy and sell arrows on the chart for easy decision-making Customizable : Easily switch from either Boom based on individuals choice Reliable : Te
FREE

This MQL5 indicator draws four Exponential Moving Averages (EMAs) — 21, 50, 100, and 200 — directly on the chart window.
The EMA 21 is displayed as a color-changing line , while EMA 50, 100, and 200 are standard single-color lines.
The color of EMA 21 changes dynamically based on price position.
When the closing price is above EMA 21 , the line turns blue , indicating bullish pressure.
When the closing price is below EMA 21 , the line turns yellow , indicating bearish pressure.
If the price equa
FREE

Conheça a Estratégia das Agulhadas Inspirada em conceitos populares do mercado brasileiro, esta estratégia combina cinco indicadores técnicos para identificar possíveis pontos de entrada e saída com base em tendências, força do mercado e momentum. Entre os indicadores usados está o famoso Didi Index, desenvolvido por Odair Aguiar, amplamente conhecido por representar cruzamentos de médias móveis. Baixe o Scanner de Ações Aqui Indicadores Utilizados Didi Index ADX Bandas de Bollinger Trix Estocás
FREE

Candle Counter é um indicador que imprime o número dos candles desde o primeiro candle do dia. O primeiro candle do dia será o número 1 e cada novo candle será aumentado em 1 nesta contagem.
Parâmetros de entrada Escolha entre par, ímpar ou todos Distância do Candle para imprimir o número Tamanho da fonte do texto Cor da fonte do texto Se você ainda tiver dúvidas, entre em contato comigo por mensagem direta: https://www.mql5.com/pt/users/robsjunqueira/
FREE
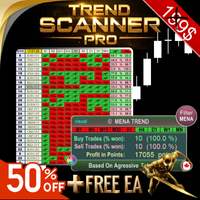
Trend Scanner PRO First of all, it’s worth emphasizing that this trading system is 100% Non-Repainting, Non-Redrawing, and Non-Lagging ,
which makes it ideal for both manual and algorithmic trading setups. Online course, user manual, and downloadable presets included. The Trend Scanner Dashboard is a professional multi pair scanner that analyzes multiple symbols and timeframes at once, giving you an instant market scanner view of the real trend direction. Instead of switching charts endl

Este painel é uma ferramenta de alerta para uso com o indicador de reversão da estrutura de mercado. Seu objetivo principal é alertá-lo para oportunidades de reversão em prazos específicos e também para os novos testes dos alertas (confirmação) como o indicador faz. O painel foi projetado para ficar em um gráfico por conta própria e funcionar em segundo plano para enviar alertas sobre os pares e prazos escolhidos. Ele foi desenvolvido depois que muitas pessoas solicitaram um traço para monitora

Contact me to send you instruction and add you in group.
QM (Quasimodo) Pattern is based on Read The Market(RTM) concepts. The purpose of this model is to face the big players of the market (financial institutions and banks), As you know in financial markets, big traders try to fool small traders, but RTM prevent traders from getting trapped. This style is formed in terms of price candles and presented according to market supply and demand areas and no price oscillator is used in it. RTM conc

This is the forex visual orders tool & forex position size (lot) calculator with intuitive panel. Risk Reward Ratio Indicator works on all kind of symbols: currency pairs, indices, metals, commodities, cryptocurrencies, etc.
If you want to make sure that Risk Reward Ratio Indicator works on your favorite symbols contact us ( visit our profile ) and ask for 7-day free trial to test this tool without limits. If you want to place orders easier, faster and more intuitive? If you like to mark trad
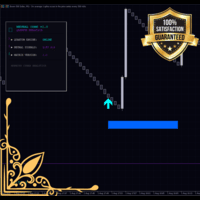
Monet Signal Master - Advanced Neural Trading System Version 1.00 Author: MONETFX Introduction Monet Signal Master is a professional technical indicator for MetaTrader 5 that generates non-repainting buy and sell signals using advanced multi-oscillator analysis. The indicator combines Stochastic and RSI crossovers with SuperTrend filtering to identify high-probability trading opportunities. Features include a cyberpunk-style dashboard, visual risk management zones, and comprehensive alert system
FREE

First time on MetaTrader, introducing IQ Star Lines - an original Vedic Astrology based indicator. "Millionaires don't use astrology, billionaires do" . - J.P. Morgan, Legendary American financier and banker.
IQ Star Lines, an unique astrological indicator purely based on Vedic astrology calculations, published for the first time on Metatrader. This unique tool plots dynamic planetary grid lines based on real-time stars, constellations, and celestial movements, which allows you to plot t
Scalper Pro – Indicador avançado de scalping para XAUUSD, EURUSD e JPY (M1/M5/M15) com picos de volume + rompimentos de estrutura de mercado Negocie de forma mais inteligente. Negocie mais rápido. Negocie com Scalper Pro. Scalper Pro é um indicador de scalping de alto desempenho para MetaTrader 5 , criado para traders profissionais especializados em scalping de XAUUSD, trading intradiário de EURUSD e estratégias de rompimento em JPY .
Projetado para precisão em gráficos M1 e com confirmação mult

Boom and crash Gold Miner v2 trend histogram which works in conjunction with the indicator above that has arrows as shown in the video. PLEASE Note: That the top indicator and the bottom indicator are two separate indicators. the top indicator is https://www.mql5.com/en/market/product/98066 the bottom one is free. which is the histogram at the bottom. the trend histogram trading tool that helps to easy detect the trend blue color indicates an uptrend. Orange color is a down trend.
FREE

Strifor Lot Calculator is a tool for MetaTrader 5 that helps traders calculate the correct lot size based on risk and stop-loss.
It allows you to trade more consciously, manage risks better, and save time on manual calculations. Advantages Accurate risk control – automatically calculates the lot size according to your chosen risk %. Two working modes – manual input or quick calculation using chart lines. Supports all popular instruments – forex pairs, gold (XAUUSD), oil (USOIL/WTI), indices (US
FREE

According to Bill Williams' trading strategy described in the book "Trading Chaos: Maximize Profits with Proven Technical Techniques" the indicator displays the following items in a price chart: 1.Bearish and bullish divergent bars: Bearish divergent bar is colored in red or pink (red is a stronger signal). Bullish divergent bar is colored in blue or light blue color (blue is a stronger signal). 2. "Angulation" formation with deviation speed evaluation. 3. The level for placing a pending order (

Haven RSI Candlestick é um indicador técnico inovador que transforma o gráfico de linha tradicional do Índice de Força Relativa (RSI) em um formato intuitivo de gráfico de velas (candlestick).
Esta ferramenta foi projetada para traders que dependem da análise técnica e buscam interpretar o momentum do mercado e potenciais pontos de reversão de forma mais rápida e aprofundada. Outros produtos -> AQUI . Principais Características: Visualização do RSI como Velas: A funcionalidade principal. Agora v
FREE

O KT Knoxville Divergence é uma ferramenta poderosa que revela divergências únicas no preço de um instrumento financeiro, utilizando uma combinação cuidadosamente elaborada do Índice de Força Relativa (RSI) e de um oscilador de momentum. Este indicador captura com eficiência variações sutis na dinâmica do mercado e auxilia os traders a identificar oportunidades de negociação potencialmente lucrativas com maior precisão. A Knoxville Divergence é um tipo de divergência no trading desenvolvida por

KT Stochastic Alerts é uma adaptação personalizada do oscilador Estocástico que gera sinais e alertas com base em seis eventos: Cruzamento altista: quando a linha principal cruza acima da linha de sinal. Cruzamento baixista: quando a linha principal cruza abaixo da linha de sinal. Quando o Estocástico entra na zona de sobrecompra. Quando o Estocástico sai da zona de sobrecompra. Quando o Estocástico entra na zona de sobrevenda. Quando o Estocástico sai da zona de sobrevenda.
Funcionalidades
Pe

O KT Price Border cria um canal de preços de três bandas que identifica possíveis áreas de máximos e mínimos no mercado. Esses níveis também podem ser usados como suporte e resistência dinâmicos. A banda do meio também pode ser usada para identificar a direção da tendência, funcionando assim como um indicador seguidor de tendências. Além disso, sua facilidade de uso e a simplicidade na interpretação dos sinais de negociação são especialmente benéficas para traders iniciantes.
Características
F

Eleve sua precisão no trading com o Fibonacci Killer Alert MT5, um indicador poderoso que utiliza níveis de retração de Fibonacci para fornecer sinais de entrada precisos nos mercados de forex, ações, criptomoedas e commodities. Aclamado em comunidades de trading como Forex Factory e Reddit’s r/Forex, e elogiado em discussões no Investopedia e TradingView por sua precisão em identificar reversões e continuações de tendência, este indicador é um favorito entre traders que buscam configurações de
Stochastic Multicurrency Scanner Dashboard MT5 é uma ferramenta poderosa projetada para monitorar múltiplos pares de moedas e períodos de tempo utilizando o oscilador Estocástico. Organiza os sinais em um formato de grade, exibindo o status de cada símbolo em períodos de tempo de M1 a MN1. Os traders podem habilitar ou desabilitar períodos de tempo específicos para se adequar às suas estratégias. A versión para MT4 está disponível aqui: Stochastic Oscillator Multicurrency Scanner MT4 Para docume
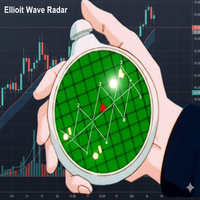
O Que Este Indicador Faz? Ele analisa automaticamente o gráfico para identificar padrões de Ondas de Elliott (impulsos e correções) e mostra onde estão as ondas 1, 2, 3, 4 e 5 em tempo real. Além disso, inclui projeções de preço , validação de volume e detecção de triângulos . Em Que Esta Versão "Radar" Melhora? Projeção de Alvos: Sugere para onde o preço pode ir na onda 5. Validação com Volume: Confirma se o volume apoia o padrão detectado. Detecção de Triângulos: Identifica correções complexas
FREE
Mega Spikes Max is a specialized indicator for Boom and Crash synthetic indices that generates trading signals with automatic alert notifications. Features The indicator analyzes market conditions using proprietary algorithms and displays buy/sell arrows directly on the chart. It works specifically with Boom and Crash indices on M5 timeframe. Signal generation combines multiple technical analysis methods to identify potential trading opportunities. The system provides two TP levels and SL calcu

Full implementation of Directional Movement System for trading, originally developed by Welles Wilder, with modifications to improve profitability, to reduce the number of unfavorable signals, and with Stop Loss lines.
No re-paint
Features
Buy/sell signals displayed on the chart Stop levels visually indicated on the chart Profit-taking points presented in the indicator window Exit points for unfavorable positions presented in the indicator window Signal confirmation through high/low swing cros
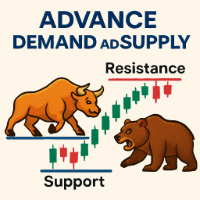
This Demand & Supply Zone Indicator with Volume Filtering is a technical analysis tool for MetaTrader that identifies key price zones where buying (demand) or selling (supply) pressure is concentrated. It uses fractals, volume analysis, and price action to detect and highlight these zones on the chart. Key Features: Zone Detection Based on Fractals Identifies demand (support) and supply (resistance) zones using fractal patterns (local highs/lows). Zones are formed from open prices ar
FREE

Are you tired of drawing Support & Resistance levels for your Quotes? Are you learning how to spot Support & Resistances? No matter what is your case, Auto Support & Resistances will draw those levels for you! AND, it can draw them from other timeframes, right into you current chart, no matter what timeframe you are using... You can also Agglutinate regions/zones that are too much closer to each other and turning them into one single Support & Resistance Level. All configurable.
SETTINGS
Timefr
FREE
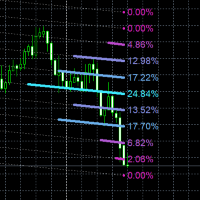
O indicador Linear Regression Volume Profile combina análise de regressão linear com perfilagem de distribuição de volume para criar uma ferramenta sofisticada de visualização de estrutura de mercado. A fundação começa com o cálculo de regressão linear através de um número especificado de barras históricas, computando tanto a inclinação quanto os valores de intersecção do eixo Y que definem a trajetória da linha de tendência através da ação de preço. Esta linha de regressão serve como eixo centr

This indicator automatically identifies demand and supply zones on a number of 1000 candles or more, and you can change that number of settings.
It also carries a high level of accuracy in describing the type of each zone, as it contains:
Weak areas .
Untested areas . Strong areas . Role-taking areas . Areas tested + number of times visited . Areas to which a return is expected, depending on the direction . The indicator contains alert zones.
For signals and more free indicators, you can foll
FREE

ScalpReactor X A Tactical Indicator for Precision Traders The Ritz Scalping Habbit is a powerful MT5 indicator designed to help traders execute disciplined, high-probability trades through clear visual cues and multi-strategy confirmations. Whether you’re an intraday scalper or a swing trader , this tool integrates advanced market analysis into a single, easy-to-use interface. Key Strengths: Smart Buy & Sell Arrows — Based on multi-layer signals from RSI, ATR, EMA, ADX, and price momentum. Colo

ATREND: Como Funciona e Como Usá-lo #### Como Funciona O indicador "ATREND" para a plataforma MT5 é projetado para fornecer aos traders sinais robustos de compra e venda, utilizando uma combinação de metodologias de análise técnica. Este indicador aproveita principalmente o Intervalo Verdadeiro Médio (ATR) para medir a volatilidade, juntamente com algoritmos de detecção de tendências para identificar possíveis movimentos de mercado. Deixe uma mensagem após a compra e receba um brinde especial.
Gold Scalper Pro PSAR ADX Dashboard MT5 Indicador profissional de múltiplos períodos de tempo com detecção avançada de sinais. Visão geral O Parabolic SAR V3 + ADX é um indicador técnico avançado que combina a capacidade de acompanhamento de tendência do Parabolic Stop and Reverse (PSAR) com a medição da força de tendência do Average Directional Index (ADX). Esta versão aprimorada apresenta otimização específica por par, sistema de alertas multilíngue e um painel multitemporal completo para trad

SUPERTREND INDICATOR MT5 Developer: gedeegi General Description GEN SmartTrend Signal is a comprehensive technical indicator for MetaTrader 5 (MT5), focused on trend identification and automated risk management. It utilizes a refined SuperTrend -based algorithm powered by the Average True Range (ATR) to determine the primary trend direction. What sets this indicator apart is its integrated trade management features displayed directly on the chart, including visual placement of Stop Loss (SL)
FREE

Renko é um gráfico atemporal, ou seja, não leva em consideração o período de tempo, mas a variação de preço, o que torna a variação de preço no gráfico mais clara. Hyper Renko é o indicador que fornece isso. Para configurar, você tem apenas um parâmetro, o tamanho da vela no tick * que deseja usar. * tick: é a menor variação possível de um ativo. Obrigado por escolher um indicador do Hyper Trader. Wikipedia: Um gráfico renko indica variação mínima no valor de uma variável - por exemplo o preço d
FREE

This is a simple Candle Stick Pattern Indicator, which shows in the current time period all standardisized Patterns in the chart. All Patterns will be calculatet automatically based on standard conditions. Following Candle Stick Patterns are included: Bullish Hammer | Bearish Hammer Bullish Inverted Hammer | Bearish Inverted Hammer Bullish Engulfing | Bearish Engulfing Piercing | Dark Cloud Cover Bullish 3 Inside | Bearish 3 Inside There are only a few settings at the begining to take. Every Pat
FREE

ADVANCED MARKET ANALYSIS INDICATOR Overview of the Indicator
This is not a simple indicator — it’s a multi-analysis predictive system. It combines:
Volume Profile (POC, VAH, VAL)
Fibonacci Extensions
Pivot Levels (Daily, Weekly, 4H)
Trend Determination (MA-based)
Smart Money Concepts & Pattern Detection (basic placeholders for expansion)
Prediction Engine (projects price forward for 1 hour)
It gives you:
Target Price Line (projection)
Stop Loss Line (usually at Volume POC)
FREE

O Chart Symbol Changer para MT5 é um indicador / utilitário que oferece a opção de alterar o símbolo do gráfico atual anexado com um clique de um botão de símbolo em seu painel. O Chart Symbol Changer para MT5 oferece a opção de configurar os botões de 32 símbolos de acordo com sua preferência pessoal, adicionando os pares que você deseja observar e negociar mais. Desta forma, você nunca perderá uma oportunidade, pois poderá ter uma visão mais rápida do mercado em seu gráfico com apenas
FREE
Level Box Tool is a powerful and user-friendly custom indicator designed for traders who utilize technical analysis tools like rectangles and trend lines to identify key support, resistance, and price zones. This tool simplifies and speeds up the process of marking chart levels, offering both visual clarity and precision with its fully customizable panel, and now includes price-cross alerts — so you’ll never miss a key level again. MT4 Version - https://www.mql5.com/en/market/product/136009/ Jo
FREE

Introduction The "Ultimate Retest" Indicator stands as the pinnacle of technical analysis made specially for support/resistance or supply/demand traders. By utilizing advanced mathematical computations, this indicator can swiftly and accurately identify the most powerful support and resistance levels where the big players are putting their huge orders and give traders a chance to enter the on the level retest with impeccable timing, thereby enhancing their decision-making and trading outcomes.
FREE
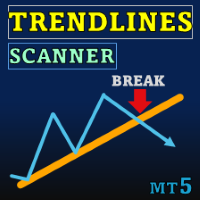
Special offer : ALL TOOLS , just $35 each! New tools will be $30 for the first week or the first 3 purchases ! Trading Tools Channel on MQL5 : Join my MQL5 channel to update the latest news from me Trendlines with Breaks Scanner é uma ferramenta de trading de última geração projetada para ajudar os traders a identificar tendências críticas e detectar rompimentos em tempo real. Com linhas de tendência geradas automaticamente com base em pontos de pivô, este indicador permite que os

The indicator displays volume profiles based on the nesting principle. Profiles periods are pre-set so that each subsequent profile has a length twice as long as the length of the previous profile. In addition to profiles, the indicator displays volume clusters sorted by color, depending on the volume they contain.
Indicator operation features The indicator works on typical timeframes from M5 to MN, but for calculations uses historical data from smaller timeframes: M1 - for timeframes from M5
FREE
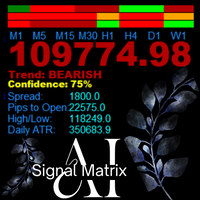
AanIsnaini Signal Matrix MT5 Multi-Timeframe Confidence Signal Dashboard The Free Version of AanIsnaini Signal Matrix MT5 Pro AanIsnaini Signal Matrix MT5 is a powerful all-in-one indicator that analyzes market direction and confidence levels across multiple timeframes — allowing traders to see the overall bias of the market at a single glance. It combines signals from Price Action , Support–Resistance , and several proven technical tools (MACD, ADX, RSI, MA slope, ATR, and Volume Ratio), then
FREE

SAM Waves PRO – Professional Signal Indicator for Day Trading SAM Waves PRO is the extended version of the popular SAM Waves indicator, designed specifically for disciplined intraday Forex traders. It includes real-time notifications via push, email, and sound alerts, ensuring you never miss a qualified trading signal. Backtested on over 5.5 years of historical data, the strategy has achieved a consistent win rate above 60 percent when traded using a fixed stop loss and take profit between 20 an

BeST_Oscillators Collection is a Composite MT5 Indicato r including the Chaikin , Chande and TRIX Oscillators from which by default Chaikin and TRIX Oscillators but not Chande Momentum Oscillator are contained in MT5 platform. It also provides for each Oscillator the option of displaying or not a Mov. Average as a Signal Line and the resulting Signals as Arrows in a Normal (all arrows) or in a Reverse Mode (without showing up any resulting successive and of same type arrows).
Analytically fo
FREE

This indicator is an MQL5 port inspired by the "Cyclic Smoothed RSI" concept originally developed by Dr_Roboto and popularized by LazyBear and LuxAlgo on TradingView. The Cyclic Smoothed RSI (cRSI) is an oscillator designed to address the two main limitations of the standard RSI: lag and fixed overbought/oversold levels. By using digital signal processing (DSP) based on market cycles, the cRSI reduces noise without sacrificing responsiveness. It features Adaptive Bands that expand and contract
FREE

The Missing Edge You Need To Catch Breakouts Like A Pro. Follow a step-by-step system that detects the most powerful breakouts!
Discover market patterns that generate massive rewards based on a proven and tested strategy.
Unlock Your Serious Edge
Important information here www.mql5.com/en/blogs/post/723208
The Reliable Expert Advisor Version
Automate Breakout EDGE signals using "EA Breakout EDGE" Click Here Have access to the game changing strategy that will take your trading to the next l

The balance of supply and demand is a simple and effective market analysis method. The supply and demand diagram can show you in advance, even before the trend reversal, where the supply ends and the demand is already emerging, where the demand ends and the supply is emerging, while substantially increasing the probability of making a deal in the right direction and with a high profit factor.
Indicator signals The indicator uses the price/volume values to generate signals: ED – excess demand. E

Necessary for traders: tools and indicators Waves automatically calculate indicators, channel trend trading Perfect trend-wave automatic calculation channel calculation , MT4 Perfect trend-wave automatic calculation channel calculation , MT5 Local Trading copying Easy And Fast Copy , MT4 Easy And Fast Copy , MT5 Local Trading copying For DEMO Easy And Fast Copy , MT4 DEMO Easy And Fast Copy , MT5 DEMO Bandas de Bollinger Avançadas:
1. O trilho Bollinger mudará de cor com a direção "
2. A expa
FREE

Um padrão de gráfico de triângulo simétrico representa um período de contração e consolidação antes que o preço seja forçado a romper para cima ou para baixo. Uma quebra da linha de tendência inferior marca o início de uma nova tendência de baixa, enquanto uma quebra da linha de tendência superior indica o início de uma nova tendência de alta.
Versão MT4 disponível aqui: https://www.mql5.com/en/market/product/68709/
Este indicador identifica esses padrões e avisa quando os 4 pontos-chave se f

Check out my TRADE PLANNER MT5 – strongly recommended to anticipate account scenarios before risking any money. You get a professional moving average indicator with multiple calculation methods available, including exponential, linear, smoothed and linear weighted approaches. The indicator is designed to work on smoothed Heikin Ashi candles, which are included in the 'Examples' folder of Meta Trader 5. By applying this tool, traders can significantly reduce unwanted market noise.
FREE

Breakout Monitor is a powerful trading tool designed to track price action within your custom-drawn zones. Simply draw a rectangle on your chart to define your consolidation or key levels, and the indicator will do the rest. It highlights the price range clearly and monitors it in real-time, ensuring you never miss a significant market move. When the price breaks through your defined boundaries, the indicator sends an instant Push Notification directly to your mobile phone in a clear, actionable
FREE
The "Breakout Finder" is a technical indicator designed to automatically identify potential price breakouts and breakdowns on a chart. The highlight of this indicator is its robust signal filtering system, which helps traders avoid false signals (fakeouts) and focus on higher-probability trading opportunities. Key Features Automatic Pivot Point Detection: The indicator automatically identifies significant pivot highs and lows on the chart to establish potential support and resistance levels. Bre
FREE

OMEGA ONE SPIKE DETECTOR: Catch Every Explosive Move /Spikes with Surgical Precision
"I Used To Watch Spikes Fly By - Now I Catch Them Consistently Using Institutional Order Levels"
WATCHING 500-POINT SPIKE and not profiting? ENTERING TOO LATE after the big move already happened? GETTING STOPPED OUT right before the explosion?
What If You Could See Spikes BEFORE They Happen - And Know Exactly Where to Enter?
Introducing Omega One Spike Detector - The Only Tool That Combines Real-T

The worktime indicator helps you identify the most important times to day to trade the currency pairs. It was created based on the ICT day trading free tutorials that are freely vailable on his youtube channel. You can use this indicator together with my other indicators that i have shared freely with you like the true day, custom periods, daily month, weekly open lines - they together complement each other very well.
Nuggets from this indicator: 1. Draws the asian session box showinng you the
FREE

Versão aprimorada do MACD Histogram (para monitorar mudanças no momentum do mercado) O indicador MACD padrão do MT5 utiliza o valor da própria linha MACD para construir o histograma. Em condições de movimentos rápidos ou mercados laterais, esses histogramas mudam lentamente e frequentemente não refletem claramente a aceleração ou desaceleração da força de alta ou baixa. Isso é especialmente perceptível quando o preço ainda não mostra uma reversão clara, resultando em sinais atrasados. Nesta vers
FREE
Cumulative Delta Volume Indicator for MT5 (CDV Indicator for MT5) Volume-Based Market Sentiment and Trend Strength Indicator The Cumulative Delta Volume (CDV) indicator analyzes the balance between buying and selling volume to reveal the underlying market sentiment.
By accumulating the difference between upward and downward volume, it shows whether buyers or sellers are in control and helps traders confirm the strength or weakness of a trend. This tool provides both candle-based visualization an
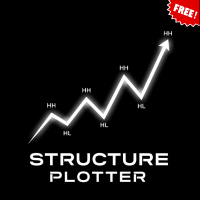
This indicator is designed to automate the process of identifying and visualizing market structure, a cornerstone of price action and Smart Money Concepts (SMC) trading. It intelligently maps the flow of the market by plotting Higher Highs (HH), Higher Lows (HL), Lower Highs (LH), and Lower Lows (LL) directly on your chart. How It Works The indicator's logic is based on detecting pivot swing points using a configurable number of bars to the left and right of a candle. It then uses these pivots t
FREE
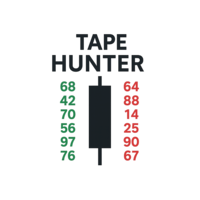
Tape Hunter – Seu Radar de Esforço vs Resultado no MT5 O Tape Hunter é o indicador definitivo para traders que querem enxergar o verdadeiro jogo por trás dos preços no MetaTrader 5. Ele mostra de forma clara e intuitiva o volume de agressão de compra e venda, baseado no POC (Point of Control), dando a você a capacidade de visualizar o esforço do mercado e o resultado real em cada candle. ️ Por que isso importa?
Nem todo volume gera movimento! O Tape Hunter destaca se o esforço (volume a
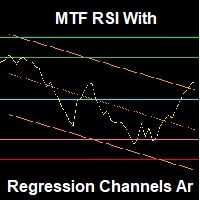
Note: The inputs of this indicator are in the Arabic language An advanced RSI indicator that displays dynamic linear regression channels in both the indicator window and the price chart, with predefined horizontal levels to detect overbought and oversold zones. Main Features (Summary): Synchronized linear regression channels on both price and RSI Multitimeframe support Smart and ready-to-use horizontal levels Professional design with optimized performance Feedback & Support We value your ex
FREE
Advanced Market Analysis Tool. Full Documentation: Download Free Professional Education Course: After purchasing, contact me to receive access to the complete CDV Professional Training Video Course. — It will help you master CDV , Aggressive Buyer & Seller dynamics , and Volume Microstructure concepts through a clear, step-by-step learning process. Overview The Professional CDV with Aggressive Score is a comprehensive volume analysis tool that combines visual Cumulative Delta Volume (CDV)

Liquidity Swings SMC Zones Liquidity Swings SMC Zones is a professional indicator for MetaTrader 5 that automatically detects, displays, and updates liquidity-based swing high and swing low zones directly on your chart. This tool is designed for traders who use Smart Money Concepts (SMC), supply and demand, or support and resistance trading methods. Features Automatic Zone Detection:
Identifies significant swing highs and swing lows based on customizable pivot settings. Clear Visual Zones:
Hi
FREE

INDICATOR: GEN Zenith Developer: gedeegi General Description GEN Zenith is a technical indicator designed to automatically identify price reversal patterns (Zenith) based on pivot price detection and delta volume movement. This indicator looks for points where the price forms a swing high or swing low, then detects a breakout from that area to confirm a strong reversal signal. This indicator is highly suitable for reversal and breakout strategies, or as a signal confirmation tool in your tradin
FREE
Você sabe por que o mercado MetaTrader é o melhor lugar para vender as estratégias de negociação e indicadores técnicos? Não há necessidade de propaganda ou software de proteção, muito menos problemas de pagamentos. Tudo é providenciado no mercado MetaTrader.
Você está perdendo oportunidades de negociação:
- Aplicativos de negociação gratuitos
- 8 000+ sinais para cópia
- Notícias econômicas para análise dos mercados financeiros
Registro
Login
Se você não tem uma conta, por favor registre-se
Para login e uso do site MQL5.com, você deve ativar o uso de cookies.
Ative esta opção no seu navegador, caso contrário você não poderá fazer login.