MetaTrader 5용 기술 지표 - 10

Trend Battle Indicator
Overview The Trend Battle Indicator is a professional technical analysis tool that reveals the battle between buyers (Bulls) and sellers (Bears) in the market through a comprehensive dashboard. Using an intuitive visual interface, the indicator offers a unique perspective on market power dynamics by analyzing the last twenty bars to provide precise insights into momentum and directional strength. Additionally, the panel provides automatic real-time updates for bars in for

Entry IQ 지표는 트레이더가 매수 및 매도 포지션에 대한 고확률 진입 지점을 식별하는 데 도움을 주기 위해 설계된 정교한 기술적 분석 도구입니다. 이 고급 트레이딩 유틸리티는 동적 가격 박스, 평형 구간 및 독자적인 추세 감지 알고리즘의 조합을 활용하여 시장 추세와 가격 움직임에 대한 포괄적인 분석을 제공합니다. 이러한 요소를 종합함으로써 이 지표는 시장 심리를 이해하고 실시간으로 중요한 전환점을 식별하기 위한 강력한 프레임워크를 제공합니다.
Entry IQ 지표의 핵심은 사용자 정의 룩백 기간 동안의 가격 움직임을 평가하고 캔들스틱 성과를 분석하여 시장 신뢰도를 효과적으로 측정하는 능력입니다. 시스템은 변동하는 시장 상황에 자동으로 조정되는 동적 가격 박스를 사용합니다. 이 기능은 특정 범위 내의 고가 및 저가 가격 수준에서 도출된 평형 구간을 강조하여 트레이더가 잠재적인 시장 반전과 추세 지속 시나리오를 더 명확하게 구분할 수 있도록 합니다.
정확성과 신뢰성을 보장하기
FREE
UT Bot with Alerts The UT Bot Alerts Indicator for MetaTrader 5 is a versatile trading tool that generates buy and sell signals based on ATR-based trailing stop logic. It displays signals with arrows, draws an entry price line, and includes a candle countdown timer. The indicator offers customizable alerts (pop-up, email, push notifications) and a text label showing signal details. Users can adjust ATR sensitivity, label positions, and timer settings, making it suitable for various markets and
FREE
거래 전략을 강화하세요 Nadaraya Watson Envelope Alert MT5 는 비모수 커널 회귀를 활용한 최첨단 지표로, 부드럽고 적응형 트렌드 분석을 제공합니다. Nadaraya-Watson 추정기에서 영감을 받은 이 도구는 가격 데이터에 가우시안 커널 평활화를 적용하여 시장 변동성에 적응하는 동적 엔벨로프를 생성하지만, 전통적인 이동 평균의 과도한 지연은 없습니다. TradingView와 같은 플랫폼에서 널리 인정받고 전 세계 트레이더로부터 반전 발견의 정확성으로 찬사를 받는 Nadaraya Watson Envelope는 2022년 이후 인기가 급증하며 Bollinger Bands의 우수한 대안으로 자리 잡았습니다. 비재도장 모드는 실시간 신뢰할 수 있는 신호를 보장하며, 재도장 옵션은 깊이 있는 분석을 위한 울트라 부드러운 시각을 제공합니다. 트레이더들은 Nadaraya Watson Envelope를 트렌드 강도, 과매수/과매도 조건, 잠재적 반전 포인트를 놀라운

Elliott Wave Trend was designed for the scientific wave counting. This tool focuses to get rid of the vagueness of the classic Elliott Wave Counting using the guideline from the template and pattern approach. In doing so, firstly Elliott Wave Trend offers the template for your wave counting. Secondly, it offers Wave Structural Score to assist to identify accurate wave formation. It offers both impulse wave Structural Score and corrective wave Structure Score. Structural Score is the rating to sh

Smart Elliott Wave is a sophisticated technical indicator that automatically detects Elliott Wave patterns with complete 5-wave impulse structures (1-2-3-4-5) and validates ABC corrective patterns for high-probability trading setups. This indicator eliminates manual wave counting and provides clear visual signals with confidence scoring. Key Features Automatic Wave Detection Detects complete Elliott Wave 5-wave impulse patterns automatically Identifies ABC corrective patterns for optimal entry p
FREE

MA3 Trend MT5 - is the good trend indicator on three MAs . Benefits of the indicator: The indicator produces signals with high accuracy.
The confirmed signal of the indicator does not disappear and is not redrawn.
You can trade on the MetaTrader 5 trading platform of any broker.
You can trade any assets (currencies, metals, cryptocurrencies, stocks, indices etc.).
You can trade on any timeframes (M5-M15 scalping and day trading / M30-H1 medium-term trading / H4-D1 long-term trading). Indi
FREE

Fair Value Gap Finder detects fair value gaps and generates a signal when price returns to one. Set the minimum and maximum fvg size, customize the colors, style, and length, then let the indicator highlight them for you.
Key Features: Automatic FVG highlights - The indicator detects all fair value gaps that fit your criteria and marks them on the chart.
Entry Signal - A signal is created whenever price retests a fair value gap.
Notification - Alerts notify you when a fair value gap or a new
FREE

IOF Footprint - Institutional Order Flow Indicator Professional footprint chart indicator that reveals institutional order flow directly on MetaTrader 5. See what smart money is doing with real-time bid/ask volume analysis at every price level. Core Features: Bid/Ask Volume Display - See exact volumes traded at bid vs ask at each price level Delta Analysis - Real-time and cumulative delta calculation per bar Point of Control (POC) - Automatic detection of highest volume price levels Value Area (

BOOM AND CRASH PRO SPIKER This indicator is specifically designed for all boom and crash indices. The indicator targets buy spike signals for boom indices and sell spike signals for crash indices. The indicator contains optimized trend filters to target buy spikes in an uptrend and sell spikes in a downtrend. The indicator also adds a grid signal to recover some loss of the first signal. The indicator also provides exit signals for delayed spikes which can help with risk management. Also, it an
FREE

DIDI 지표(3 이동평균 비율)는 이중 라인 신호, 다중 시간대 지원, 사용자 정의 가능한 시각적 신호 및 구성 가능한 경고 시스템을 갖추고 있습니다.
DIDI란 무엇입니까? DIDI는 서로 다른 기간을 가진 세 가지 이동평균(MA) 간의 관계를 표시하는 비율 지표입니다: Curta(단기), Media(중기), Longa(장기). 이 지표는 Curta 및 Longa MA를 Media MA로 나누어 두 개의 비율 라인을 계산하며, Media MA는 1.0의 기준 수준으로 사용됩니다. DIDI는 빠른 이동평균과 느린 이동평균이 중기 평균과 어떻게 관련되는지 보여줌으로써 추세 강도와 잠재적 반전 지점을 식별하는 데 도움이 됩니다. 1.0보다 높은 값은 MA가 기준선 위에 있음을 나타내고(강세), 1.0보다 낮은 값은 MA가 기준선 아래에 있음을 나타냅니다(약세). Curta와 Longa 라인 간의 교차 및 1.0에서의 수준 교차는 일반적으로 거래 신호로 사용됩니다. 기능: 이중 라인
FREE

이중 라인 신호, 3단계 시스템, 멀티 타임프레임 지원, 사용자 정의 가능한 시각적 신호 및 고도로 구성 가능한 알림 시스템을 갖춘 고급 스토캐스틱 오실레이터.
스토캐스틱 오실레이터란? 스토캐스틱 오실레이터는 특정 기간 동안 증권의 종가를 가격 범위와 비교하는 모멘텀 지표입니다. 이 지표는 두 개의 라인으로 구성됩니다: %K (메인 라인)와 %D (시그널 라인, %K의 이동 평균). 스토캐스틱은 0에서 100 사이에서 진동합니다. 높은 수치는 과매수 조건을 나타내고, 낮은 수치는 과매도 조건을 나타냅니다. %K와 %D 라인 간의 교차 및 레벨 경계를 통과하는 움직임은 일반적으로 거래 신호로 사용됩니다. 기능: 3단계 시스템(높음, 중간, 낮음)을 갖춘 이중 라인 스토캐스틱(%K 및 %D) 3개의 독립적인 구성 가능한 신호 버퍼가 있는 시각적 신호 마커(화살표, 수직선) 고급 신호 감지: 방향 변화, 라인 교차, 레벨 교차, 두 라인의 피크/밸리 시간 범위 필터링이 있는 구성 가능
FREE

Market Structure ICT 인디케이터 1. 자동화된 시장 구조 분석 가장 큰 장점은 주관적인 해석으로 인한 오류를 줄여준다는 것입니다. 정확한 추세 식별: 추세 지속을 위한 **BOS (구조 돌파)**와 추세 반전을 위한 **CHoCH (추세 성격 변화)**를 자동으로 식별합니다. 스윙 분류: 단기, 중기, 장기 등 시장 구조 유형을 선택할 수 있어 스캘퍼와 스윙 트레이더 모두에게 적합합니다. 2. 전문 대시보드 다른 타임프레임을 확인하기 위해 화면을 전환할 필요가 없습니다. 한눈에 보는 분석: 대시보드는 모든 타임프레임(M1~W1)의 상태를 한 화면에 표시합니다. 점수 시스템: 하위 타임프레임의 점수를 합산하여 전반적인 편향 (Overall Bias) (예: "강한 상승" 또는 "혼조")을 요약해 줍니다. 추세의 신선도: BOS가 방금 발생한 "신규 돌파(Fresh Break)"인지 오래된 구조인지 알려줍니다. 3. 차트 상의 MTF 표시 (멀티 타임프레임) 정밀한 진입

"MACD 리본 다이내믹 PRO: 변동성을 추세로 전환하세요"
간략 설명: "단 하나의 선에만 의존하지 마세요. 시장의 깊이를 파악하세요. 스프레드 오류 없이 비트코인, 금, 외환에 최적화된 차세대 추세 추종 도구입니다."
제품 상세 정보: MACD 리본 다이내믹을 선택해야 하는 이유? 기존 지표는 비트코인이나 금처럼 변동성이 높은 자산에서 잘못된 신호를 생성할 수 있습니다.
MACD 리본 다이내믹은 다층 알고리즘을 사용하여 시장의 노이즈를 걸러냅니다.
주요 기능:
다층 분석: 단일 신호 대신 50개 이상의 동적 분석선을 통해 추세의 진정한 강도를 확인하세요.
암호화폐 친화성(고가 수정): $100,000 수준의 BTCUSD와 같은 자산에서도 수학적 오류 없이 작동하는 특수 알고리즘입니다.
스프레드 없음 기술: 종가에 초점을 맞춘 깔끔한 계산 방식으로 스프레드 확대에 영향을 받지 않습니다.
추세의 힘: 밴드가 넓어질 때 추세에 진입하고, 밴드가 좁아질 때

The indicator looks for consolidation (flat) in the market at a certain time, builds a box-channel and marks levels indented from it for a breakdawn. After crossing one of the levels, the indicator marks the zone for take profit and calculates the corresponding profit or loss in the direction of this entry on the panel. Thus, the indicator, adjusting to the market, finds a flat area of the market, with the beginning of a trend movement to enter it. Version for MT4: https://www.mql5.com/en/market
FREE
Sigma Indicator is used by Sigma Expert advisor for plotting the zones but now its available for members to apply their stratagies on Sigma supply and demand levels.
Instructions:
1- Donot Change time frames instead run several pairs with different time frames with sigma indicator 2- For exness : Search for smaller zone = True
For other brokers keep it False
3- Maximum zone size = 0
4- Minimum zone size = 0
5 - Back candles = 300
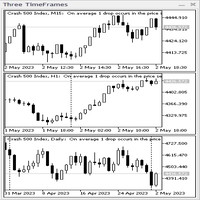
3개의 TimeFrames 표시기 패널. 인디케이터는 CAppDialog 클래스를 기반으로 패널 형태로 제작됩니다. 패널은 최소화하거나 마우스를 사용하여 현재 차트 주위로 이동할 수 있습니다. 표시기는 패널에서 현재 기호의 세 가지 기간을 보여줍니다. 현재 버전에서 표시기에는 최소 설정 수가 있습니다. 이들은 "젊은 기간", " 중간 기간 "및 " 이전 기간 " 의 세 가지 기간 매개 변수입니다 . 표시기 패널이 시작되면 현재 차트의 모든 속성을 자동으로 복사하여 세 가지 기간(예: 배경색, 막대 색, 그리드, 기간 구분 기호, 거래량...)에 적용합니다. 그러나 지표 패널은 세 가지 기간 동안 Expert Advisors 및 기타 지표를 복사하지 않습니다. 현재 차트의 속성을 변경한 경우 세 가지 시간대의 변경 사항은 지표 패널을 삭제하고 다시 부착한 후 또는 현재 차트의 시간대를 전환한 후에만 적용됩니다. 지표의 적용. 수동 거래의 조수로 추천 -

이 지표는 실제 거래에 완벽한 자동 파동 분석 지표입니다! 사례...
참고: 웨이브 그레이딩에 서양식 이름을 사용하는 데 익숙하지 않습니다. Tang Lun(Tang Zhong Shuo Zen)의 명명 규칙의 영향으로 기본 웨이브를 펜 으로 명명하고 2차 웨이브 밴드를 세그먼트 로 명명했습니다. 동시에, 세그먼트에는 추세 방향이 있습니다. 주요 추세 세그먼트에는 이름이 지정되지만(이 이름 지정 방법은 향후 노트에서 사용됩니다. 먼저 말씀드리겠습니다.) 알고리즘은 굴곡 이론과 거의 관련이 없으므로 그렇게 해서는 안 됩니다. 이는 나의 시장 분석을 통해 요약된 끊임없이 변화하고 복잡한 운영 규칙을 반영합니다.
밴드는 더 이상 사람마다 다르지 않도록 표준화되고 정의되었습니다. 인위적인 간섭의 드로잉 방법은 시장 진입을 엄격하게 분석하는 데 핵심적인 역할을 합니다.
이 지표를 사용하는 것은 거래 인터페이스의 미학을 개선하고 원래의 K-line 거래를

Ekom Spike Detector Pro
Take your trading to the next level with the Ekom Boom and Crash Spike Detector Indicator Pro, designed for serious traders who demand more. This advanced version provides: Key Features: Accurate Spike Detection: Identify high-probability spike patterns in real-time using price action Clear Visual Signals: Displays clear buy and sell arrows on the chart for easy decision-making Alert options : MT5 Alert/Notification to receive alerts on your mobile when signal
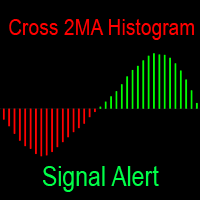
이 표시기는 두 이동 평균 간의 차이를 히스토그램 형태로 보여줍니다. 이동 평균에는 거대한 사용자 정의 옵션이 있습니다. 히스토그램의 색상이 변경 될 때 그것은 모든 방법으로 당신을 통지:그것은 터미널에 경고음,메일에 전화 및 이메일로 알림을 전송-지금 당신은 확실히 거래를 놓치지 않을 것입니다. 차트에 선의 형태로 완전 무료 이동 평균 교차 표시: https://www.mql5.com/ko/market/product/148478 귀하의 의견은 나에게 매우 중요합니다. 피드백은 개발을 훨씬 더 좋게 만들고 우리가 함께 앞으로 나아갈 수 있도록 도와줍니다. 질문이 있거나 의견을 공유하고 싶습니까? 댓글 쓰기 또는 메시지 보내기-나는 항상 연락을 취하고 있습니다! 이 도구는 시장 모니터링의 루틴을 인수 신뢰할 수있는 조수가된다. 교차 순간을 예상하여 차트를 지속적으로 보는 대신 이 작업을 표시기에 위탁할 수 있습니다. 그것은 단지 명확한 히스토그램 열을 사용하여 추세 강도의 역학을 시각
FREE

이 지표는 지그재그 지표, 거래 세션, 프랙탈 또는 양초(비표준 기간 포함: 연도, 6개월, 4개월, 3개월, 2개월)(자동 Fibo 되돌림)를 기반으로 피보나치 레벨을 자동으로 그립니다. 피보나치 계산을 위해 더 높은 기간을 선택할 수 있습니다. 현재 막대가 닫힐 때마다 레벨이 다시 그려집니다. 지정된 수준을 넘을 때 경고를 활성화하는 것이 가능합니다.
기록의 수준을 분석할 수도 있습니다. 이를 위해서는 "과거 Fibo 수" 매개변수에서 Fibo 수준 수를 지정해야 합니다
매개변수 Calculate Fibo according to — 피보나치 계산 모드: Candles (High-Low) — 고저를 기반으로 Fibo를 구축합니다. Candles (Close-Close) — 닫기-닫기를 기반으로 Fibo를 구축합니다. ZigZags — ZigZag 포인트로 fibo를 구축합니다. Sessions — 거래 세션을 통해 fibo를 구축합니다. Fractals — 프랙탈 포인트로
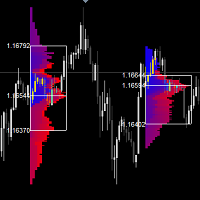
마켓 프로파일 지표는 시장 프로파일을 표시하는 고전적인 솔루션입니다. 차트에서 시간 경과에 따른 가격의 통계적 분포, 비용 영역, 그리고 거래 세션의 통제값을 표시할 수 있습니다. 이 지표는 모든 시간대의 차트에 연결할 수 있으며, 자유롭게 정의된 사각형 안에 프로파일을 포함하여 전체 세션 세트에 대한 시장 프로파일을 표시할 수 있습니다. 시간대가 짧을수록 정확도가 높아지고, 시간대가 길수록 가시성이 향상됩니다. 프로파일 블록을 그리는 데 6가지 색상 구성표를 사용할 수 있습니다. 또한, 프로파일을 단색 히스토그램으로 그릴 수도 있습니다. 원하는 경우 막대 방향에 따라 프로파일 색상을 선택할 수 있습니다. 이 지표는 단순한 가격 변동을 기반으로 하며 표준 MetaTrader 지표를 사용하지 않습니다.
트레이더 여러분, 주의하세요! 지표 설정 및 거래 지침을 읽어보세요. https://www.mql5.com/en/blogs/post/763813 이 지표는 가격이 통제값(중간값),
FREE

VR Sync Charts는 창 간의 레이아웃을 동기화하는 유틸리티입니다. VR Sync Charts를 사용하여 추세 수준, 수평 수준, 피보나치 표시가 모든 차트와 동기화됩니다. 본 유틸리티를 사용하여 MetaTrader 터미널에서 모든 표준 그래픽 개체를 동기화할 수 있으며 모든 추세, Gann 라인 및 기타 개체가 인접 차트에 정확하게 복사됩니다. 더 이상 괘선과 표시를 수동으로 복사할 필요가 없습니다. 아래 그림과 비디오에서 VR Sync Charts 유틸리티의 작업을 보고 평가할 수 있습니다. 권장 사항: 모든 차트에 지표를 설정하기. 터미널 설정에서 «더블 클릭으로 개체 선택» 기능을 설정하기. 본 프로그램을 전략 시험에서 테스트할 수 없습니다. 아래 비디오를 보십시오. 혜택 모든 그래픽 개체를 동기화함. 모든 시간대와 차트 동기화 모든 업데이트는 무료입니다 초보자뿐만 아니라 전문 트레이더 모두에게 적합함 설정이 많지 않아 선택적으로 동기화를 할 수 있음. 모든 금융 상품

The indicator plots a trend channel using the technique by Gilbert Raff. The channel axis is a first-order regression. The upper and lower lines show the maximum distance the Close line had moved away from the axis line. Therefore, the upper and lower lines can be considered as resistance and support lines, respectively. A similar version of the indicator for the MT4 terminal
As a rule, most movements of the price occur within a channel, going beyond the support or resistance line only for a sh
FREE

Dark Inversion is an Indicator for intraday trading. This Indicator is based on Counter Trend strategy but use also Volatility. We can enter in good price with this Indicator, in order to follow the inversions on the current instrument. Hey, I made an Expert Advisor based on this indicator, if you are interested: Dark Titan MT5
Key benefits
Easily visible Inversion Lines Intuitive directional arrows Automated adjustment for each timeframe and instrument Easy to use even for beginners Never r
FREE

The indicator displays the orders book, as well as increases its depth, remembering the location of orders that have gone beyond the current "window" view.
Indicator capability Display the levels of open positions. Simulation of placing/cancelling/editing pending orders directly in the displayed orders book.
Indicator features The orders book display works only on those trading symbols for which it is broadcast by the broker. To reset the information about the rows that were recorded in the Sm
FREE

Fractals Dynamic Fractals Dynamic – 이제 프랙탈 동적 표시기를 기반으로하거나 기반으로 한 모든 거래 전략에는 추가 신호가 있습니다. 또한 프랙탈은 지원 및 저항 수준으로 작용할 수 있습니다. 그리고 일부 거래 전략에서는 유동성 수준을 보여줍니다. 이를 위해,이 버전의 멀티 프랙탈 및 멀티 프레임 표시기 MultiFractal Levels 에 레벨이 도입되었습니다. 당신은 어떤 가격 차트에 거래의 조수로 더 많은 정보,시각 및 유용이 표시를 찾을 수 있습니다. 거래 시스템에 추가로 Fractals Dynamic 표시기를 사용하십시오
또한 시장에 내 다른 제품을 사용해보십시오 https://www.mql5.com/ru/users/capitalplus/seller
지표가 마음에 드셨다면, 평가하고 리뷰를 남겨주세요. 저에게는 매우 중요합니다! 거래에서 큰 이익을 얻으세요!
FREE

Ultimate Pivot Levels indicator for MetaTrader 5 Ultimate_Pivot_Levels is versatile tool designed to enhance your trading experience by accurately plotting pivot levels on your charts. It allows entering your desired values manually or using well known pivot calculation methods to create pivot levels. It draws the levels in the background and allows you to customize levels, size and colors of areas, and it keeps your adjustments while extending the levels to every new bar. Whether you are a novi
FREE
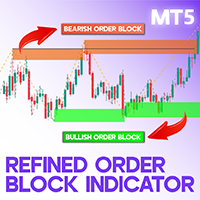
Refined Order Block Indicator for MT5 Designed around ICT and Smart Money strategies, the Refined Order Block (OBR) indicator is an essential tool for traders on the MetaTrader 5 (MT5) platform. It identifies and highlights key price levels by marking bullish order blocks in green and bearish order blocks in brown. These levels represent potential price reversal zones , often influenced by large institutional and bank orders. When the price reaches these critical areas, it may experience signifi

### Indicator Description: Gradient Heiken Ashi with Momentum Coloring
This indicator is a technical analysis tool designed to overlay on the main chart, helping traders easily identify price trends and momentum through modified Heiken Ashi candles. It combines smoothed candle value calculations based on moving averages with a gradient color system to represent the strength of bullish or bearish trends.
#### 1. Key Features
- Display of Modified Heiken Ashi Candles:
- The indicator draws opt
FREE

Modified oscillator MACD. A classic indicator that combines a trend indicator with an oscillator to detect entry points. Has a multi-timeframe panel and 3 types of notifications
Benefits:
Works on all instruments and timeseries Trend indicator with oscillator for inputs Multi-period panel on all timeframes Pluggable arrows when signals appear Three types of notifications: push, email, alert
MT4 version -> HERE / Our news -> HERE
How the indicator works:
AW Classic MACD - Indicator of
FREE
여기를 클릭하여 제 모든 무료 제품을 확인하세요
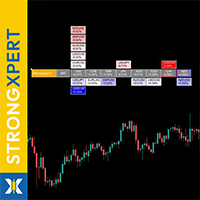
StrongXpert 는 글로벌 통화 시장의 실시간 통화 강도 흐름을 정확하게 모니터링하는 도구 입니다. 이 도구는 자본이 실제로 어디로 유입되고 있는지 - 그리고 시장에서 어디로 빠져나가고 있는지 를 보여주기 위해 개발되었습니다. 이 인디케이터는 8대 주요 통화(USD, EUR, GBP, JPY, AUD, CAD, CHF, NZD)의 상대적 강도 를 측정하며, 복잡한 가격 움직임을 간단하고 읽기 쉬운 시각적 대시보드로 변환합니다 - 그것도 차트 위에 직접 표시됩니다. 가장 강한 통화와 가장 약한 통화를 몇 초 만에 식별할 수 있습니다 - 세트업 확인, 추세 방향 필터링, 반전 포인트 탐지에 이상적입니다. 추측도, 가정도 필요 없음 - 필요한 것은 오직 실시간의 명확한 시장 구조뿐입니다. 많은 강도 인디케이터가 단순 계산이나 지연된 값을 보여주는 반면, StrongXpert 는 연속 실시간 분석 을 사용하여 시장 단계에 맞춰
FREE
Trader Dynamic Index Added Signal – 시장 컨텍스트 기반의 과학적 접근법을 통한 오실레이터 분석 1. 서론 현대 기술적 분석에서 기존 오실레이터는 종종 시장 컨텍스트와 분리된 개별 신호를 제공 하여 잘못된 신호나 신뢰성이 낮은 신호 발생률이 높습니다.
**Trader Dynamic Index Added Signal (TDI-AS)**는 이러한 문제를 해결하기 위해 개발되었으며, 오실레이터 기반 신호 생성 논리를 재정립하고, 시장 컨텍스트 인식을 신호 검증의 핵심 조건 으로 삼고 있습니다. 2. 이론적 프레임워크 2.1. 컨텍스트 – 신뢰할 수 있는 신호의 핵심 요소 TDI-AS에서 컨텍스트란 가격 모멘텀의 동적 임계값 을 의미하며, 이는 주요 추세, 시장 리듬, 왜곡 및 노이즈 수준 을 반영합니다. 컨텍스트가 없으면 , 매수/매도 신호는 구조적 근거가 없는 국지적 반응이 되어 승률이 크게 떨어집니다 . 컨텍스트가 있으면 , 신호가 시장의 지배적인 흐름과 일

캔들 카운터는 그 날의 첫 캔들부터 캔들 개수를 출력하는 인디케이터입니다. 오늘의 첫 번째 양초는 숫자 1이 되며 새 양초는 이 개수에서 1씩 증가합니다.
입력 매개변수 짝수, 홀수 또는 모두에서 선택 촛불에서 숫자 인쇄까지의 거리 텍스트 글꼴 크기 텍스트 글꼴 색상
여전히 질문이 있는 경우 다이렉트 메시지로 저에게 연락하십시오. https://www.mql5.com/ko/users/robsjunqueira/ ----------------- 이것이 우리가 지속적으로 발전 할 수있는 유일한 방법이기 때문에 개선을위한 제안에 부담없이 문의하십시오. 또한 당사의 다른 지표 및 전문 고문에 대해 알아보십시오. 다양한 유형의 자산을 거래할 수 있는 다양한 상품이 있음을 알 수 있습니다.
FREE

The worktime indicator helps you identify the most important times to day to trade the currency pairs. It was created based on the ICT day trading free tutorials that are freely vailable on his youtube channel. You can use this indicator together with my other indicators that i have shared freely with you like the true day, custom periods, daily month, weekly open lines - they together complement each other very well.
Nuggets from this indicator: 1. Draws the asian session box showinng you the
FREE

Was: $99 Now: $49 Blahtech Daily Range indicator displays the average daily range alongside the individual session ranges. Using the daily open price as a reference the indicator shows fixed range and dynamic range targets as lines on the charts. These lines clearly show when the average range has been exhausted. Daily and session ranges can be useful for confirming entries or setting targets and is an excellent odds enhancer for many trading systems. Links [ Documentation | Install | U

AW Super Trend -가장 인기 있는 클래식 트렌드 지표 중 하나입니다. 그것은 간단한 설정을 가지고 있으며 추세로 작업할 수 있을 뿐만 아니라 이 표시기로 계산되는 손절매 수준도 표시합니다. 이익:
악기: 통화 쌍 , 주식, 상품, 지수, 암호 화폐. 기간: М15 이상. 거래 시간: 24시간 내내. 현재 추세의 방향을 보여줍니다. 손절매를 계산합니다. 거래를 할 때 사용할 수 있습니다. 세 가지 유형의 알림: 푸시, 이메일, 경고. MT4 버전 -> 여기 / 뉴스 - 여기 기능:
표시기는 해당 색상으로 현재 추세 방향을 표시합니다.
- 파란색은 현재 기간에 사용된 기호의 상승 추세를 나타냅니다.
- 선의 빨간색은 선택한 기호에서 사용된 기간의 하락 추세를 나타냅니다.
표시기를 사용하여 StopLoss를 설정할 수 있습니다.
표시선은 막대 위에 표시되지 않고 막대를 기준으로 약간 이동하여 표시됩니다. 추세선이 표시되는 이 곳은 트레이더가 손
FREE

KT Price Border는 세 개의 가격 밴드로 구성된 가격 채널을 생성하여 시장의 잠재적인 고점과 저점을 식별합니다. 이러한 레벨은 동적 지지 및 저항선으로도 사용할 수 있습니다. 중앙 밴드는 트렌드 방향을 식별하는 데에도 사용할 수 있으며, 결과적으로 트렌드 추종형 지표로도 작동합니다. 또한, 사용이 간편하고 직관적인 거래 신호를 제공하여 초보 트레이더에게 큰 도움이 됩니다。
특징
대부분의 외환 통화 쌍에서 효과적으로 작동합니다. 낮은 시간 프레임과 높은 시간 프레임에서 모두 사용 가능합니다. 스캘핑, 데이트레이딩, 스윙 트레이딩에 적합합니다. 트렌드 및 역추세 거래 전략을 모두 지원합니다. 가격이 가격 밴드를 통과할 때 알림을 보낼 수 있습니다. 가격 밴드는 동적 지지 및 저항 수준으로도 활용할 수 있습니다.
가격 경계 개념 이해하기 이 지표는 볼린저 밴드와 유사하게 작동합니다. 하단 밴드는 시장의 과매도 상태를 나타내며 동적 지지 역할을 합니다. 상단 밴드는 시장의
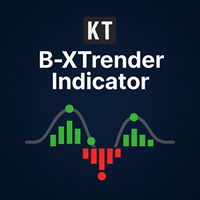
KT B-Xtrender는 원래 Bharat Jhunjhunwala가 IFTA 저널에서 소개한 추세 추종형 도구를 기반으로 발전시킨 고급 버전입니다. 우리는 개념을 정교하게 다듬어 더 정확한 신호와 내장 알림 기능을 제공하여 트렌드가 형성된 시장에서 더 안정적인 기회를 포착할 수 있도록 했습니다. 여러 차트에 적용할 수 있지만, 특히 4시간(H4) 및 일간(Daily)과 같은 높은 시간 프레임에서 최고의 성능을 발휘합니다.
특징
이중 트렌드 관점: 단기와 장기 흐름을 함께 분석하여 단순 조정인지, 실제 추세 전환인지 명확하게 구분할 수 있습니다. 명확한 신호: 매수 및 매도 신호를 직관적으로 제공하고, 포지션 조절 지점까지 제시하여 더 자신 있게 거래를 관리할 수 있습니다. 단기 히스토그램: 큰 추세 속에서 나타나는 단기 조정을 시각적으로 표시합니다. 녹색은 상승 모멘텀을, 빨간색은 단기 약세를 나타냅니다. 장기 히스토그램: 빠른 이동 평균과 느린 이동 평균을 RSI로 부드럽게
수동으로 그리지 않고 몇 초 만에 명확한 시장 구조 확인!
HTF 자동 지지/저항 지표 는 차트에 주요 지지 및 저항 레벨을 자동으로 표시합니다. 이 레벨은 높은 타임프레임(HTF)에 기반하므로, 단기 임의선보다 훨씬 신뢰성이 높습니다. 주요 기능: 가장 강한 지지/저항 구역 자동 감지 멀티 타임프레임 분석: 더 정확한 레벨을 위해 상위 타임프레임 선택 즉각적인 인식을 위한 색상 구분된 명확한 구역 주관적 오류 없음 – 고정 규칙에 따라 객관적으로 계산 모든 시장 최적화: 포렉스, 지수, 원자재, 암호화폐 바로 사용 가능 – 최적 기본 설정 포함 트레이더 장점: 시장이 전환하거나 반응할 가능성이 높은 위치를 빠르게 확인 강력한 구역에서만 거래하여 나쁜 세팅 필터링 시간을 절약하고 일관된 분석 레벨로 성공률 향상 스캘퍼, 데이 트레이더, 스윙 트레이더에 적합 사용 팁: 설정에서 원하는 상위 타임프레임 선택 (예: H4, D1, W1) 구역을 프라이스 액션 또는 캔들 패턴과 결합 시장
FREE

The Order Block Indicator for MT5 is a powerful tool designed for traders who use smart money concepts and institutional trading strategies. It automatically detects key order blocks on the chart, helping traders identify high-probability reversal and continuation zones.
Key Features: • Automatic Order Block Detection – Highlights strong buying and selling zones based on price action and volume. • Multi-Timeframe Support – Analyze order blocks across different timeframes for better market in
FREE
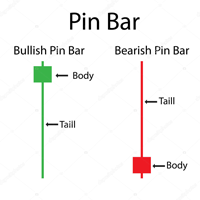
Pin bar pattern is characterized by a long upper or lower wick with a small body relative to the size of the wick with little to no lower or upper shadows. Pin bars are not to be traded in isolation , but need to be considered within the larger context of the chart analysis. A pin bar entry signal, in a trending market, can offer a very high-probability entry and a good risk to reward scenario.
Inputs Multiplier ; AlertOn - enable alerts; EmailAlert - enable email alerts; PushAlert - en
FREE
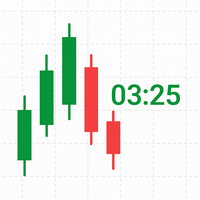
TimeLeftCandle – Countdown Clock for Candles in MT5 Overview
TimeLeftCandle is an indicator for MetaTrader 5 that displays in real time the remaining time until the current chart candle closes. Its design is minimalist, clear, and movable, adapting to any type of chart and trading style. Ideal for traders who need to precisely track candle closing times and make timely decisions. Main Advantages Clear and precise display: A digital-style counter to know exactly how much time is left before the
FREE

Supply or demand zones refer to price areas where a significant amount of supply or demand had previously entered the market, causing prices to either fall or rise. If the price returns to the demand or supply zone, it is likely to bounce off due to the large number of orders previously placed within the zone. These orders will be defended in these areas.
The Fair Value Gap (FVG) is a concept used to identify imbalances in the equilibrium of buying and selling. Fair Value Gaps are formed in a t
This indicator helps you monitor multiple currency pairs and timeframes all at once. It displays the occurrence of divergences between price and the MACD indicator in a clear and easy-to-read table. Monitoring multiple timeframes and currency pairs in one place helps traders identify a divergence without needing to switch between charts. Divergences can be bullish or bearish. For example, if the price forms a higher high while the MACD forms a lower high, this indicates bearish divergence. On th

Description (For MQL5 Website/Market)
Title: Subho SMC Concept & Trend Signals
Subtitle: All-in-one Smart Money Concepts (SMC) Dashboard with SUBHO Signals.
Description: The Subho SMC Concept & Trend Signals is a comprehensive professional trading system designed for MetaTrader 5. It automates advanced Smart Money Concepts (SMC) and combines them with the proprietary "SUBHO Signal System" to find high-probability trade setups. This indicator helps you identify the true market direction using

MTF VWAP Indicator - Quick Overview This indicator shows you where institutional money is flowing across multiple timeframes using Volume Weighted Average Price (VWAP) to identify high-probability trading zones. What It Actually Does: 1. Tracks Smart Money Levels: - Shows Daily, Weekly, and Monthly VWAP lines where big players (banks, funds) are trading - Tells you if price is above or below these key institutional levels - Shows distance from VWAP as a percentage (tells you how extend

The indicator returning pivot point based trendlines with highlighted breakouts . Trendline caculated by pivot point and other clue are ATR, Stdev. The indicator also includes integrated alerts for trendlines breakouts and foward message to Telegram channel or group if you want. Settings · Lookback bar: Default 200 is number of bar caculate when init indicator. · Length: Pivot points period · Slope Calculation Method: Determines how this lope is calculated. We supp
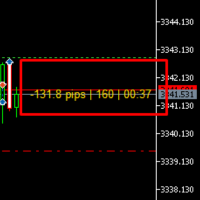
Ultimate Trading Companion Indicator for MT5
Hi there!
This intelligent and easy-to-use indicator is designed to give you a clear edge in the market. It shows: Live Pips of Open Trades – Instantly see how much you're gaining or losing in pips. Candle Countdown Timer – Know exactly when the current candle will close. Real-Time Spread Display – Stay aware of market conditions and avoid bad entries. Fully Customizable Colors – Choose your own Profit, Loss, and Neutral display colors for a clean a

Description :
VWAP (Volume-Weighted Average Price) is the ratio of the value traded to total volume traded over a particular time horizon. It is a measure of the average price at which pair is traded over the trading horizon. Read More.
All Symbols and All Timeframes are supported.
Indicator Inputs :
VWAP Mode : Mode of VWAP Calculation. Options can be selected : Single,Session,Daily,Weekly,Monthly
Volumes : Real Volumes,Tick Volumes
Price Type : Used price for calculating. O

Indicator Description
This indicator draws red-border rectangles during specific daily ICT Kill Zones (EST): 3:00 – 4:00 AM EST 10:00 – 11:00 AM EST 2:00 – 3:00 PM EST During each active time window, the indicator automatically creates rectangles and highlights Fair Value Gaps (FVGs) formed shortly before and during the selected Kill Zones, including recent prior FVGs for additional confluence. The Kill Zones are designed according to ICT (Inner Circle Trader) concepts and can be used as a c
FREE

It predicts the most likely short-term price movement based on advanced mathematical calculations.
Features Estimation of immediate price movement; Calculation of the real market trend; Calculation of the most important support and resistance levels; Algorithms optimized for making complex mathematical calculations with a minimal drain of system resources; Self-adjusting for better performance, so it’s able to work properly at any symbol (no matter how exotic it is) and any timeframe; Compatibl

Boom and crash Gold Miner v2 trend histogram which works in conjunction with the indicator above that has arrows as shown in the video. PLEASE Note: That the top indicator and the bottom indicator are two separate indicators. the top indicator is https://www.mql5.com/en/market/product/98066 the bottom one is free. which is the histogram at the bottom. the trend histogram trading tool that helps to easy detect the trend blue color indicates an uptrend. Orange color is a down trend.
FREE

The Hull Moving Average is not very well know in novice and maybe in intermediate trading circles, but it is a very nice solution created by the trader Alan Hull - please visit www.AlanHull.com for full details of his creation. The purpose of this moving average is to solve both problems that all famouse and common moving averages have: Lag and Choppiness . The implementation we did has, apart of the Period configuration and Price type to use in the calculations, a "velocity" factor, which could
FREE

Dominion Levels: The "Market Structure" Architect
Perfect for XAUUSD (Gold)
The definitive tool for identifying "Hard" Support and Resistance levels that actually hold. Most traders draw support and resistance lines based on feelings or vague zones. The result? Messy charts, subjective decisions, and getting stopped out by "noise." Dominion Levels solves this by removing the subjectivity. It is not just another line drawer; it is a Stepped Structure Engine. It identifies significant pric

LogicLadder SR Zones Stop guessing where the market will turn. Let the volatility tell you. LogicLadder SR Zones is not just another "line drawing" tool. It is an intelligent market structure analyzer that adapts to market volatility (ATR) to draw high-probability Support and Resistance zones automatically. Unlike standard indicators that draw thin, useless lines, this tool understands that price is a zone, not a number. The Secret of Zone Thickness (Why Size Matters) One of the most powerful
FREE

High Low Today (MT5) is a free, easy-to-use MetaTrader 5 indicator that displays the current day’s High and Low price levels on your chart. It even offers optional push notifications to alert you when the price touches or breaks these key levels. With a clean and minimalist design, it provides valuable intraday insights without cluttering your chart. Marks the current day’s High and Low on the chart (key intraday support/resistance levels) Clean, lightweight, and unobtrusive – only the essenti
FREE
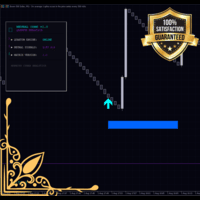
Monet Signal Master - Advanced Neural Trading System Version 1.00 Author: MONETFX Introduction Monet Signal Master is a professional technical indicator for MetaTrader 5 that generates non-repainting buy and sell signals using advanced multi-oscillator analysis. The indicator combines Stochastic and RSI crossovers with SuperTrend filtering to identify high-probability trading opportunities. Features include a cyberpunk-style dashboard, visual risk management zones, and comprehensive alert system
FREE

This indicator automatically identifies demand and supply zones on a number of 1000 candles or more, and you can change that number of settings.
It also carries a high level of accuracy in describing the type of each zone, as it contains:
Weak areas .
Untested areas . Strong areas . Role-taking areas . Areas tested + number of times visited . Areas to which a return is expected, depending on the direction . The indicator contains alert zones.
For signals and more free indicators, you can foll
FREE
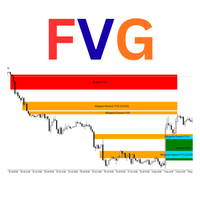
Luta FVG Pro – Professional Fair Value Gap (FVG) Indicator
Detects Institutional Fair Value Gaps on H4 timeframe with the same way used by ICT/SMC traders.
Features: • Real-time Bullish & Bearish FVG detection • Automatic Mitigation tracking • Inverted FVG signals (very powerful reversal setups) • "GOOD" FVG marking (gaps ≥ 2× minimum size – higher probability) • Clean rectangles with smart labels (Bullish FVG / Mitigated / Inverted) • Overlap filter option • Maximum 50 active zones (no chart
FREE

This is a simple Candle Stick Pattern Indicator, which shows in the current time period all standardisized Patterns in the chart. All Patterns will be calculatet automatically based on standard conditions. Following Candle Stick Patterns are included: Bullish Hammer | Bearish Hammer Bullish Inverted Hammer | Bearish Inverted Hammer Bullish Engulfing | Bearish Engulfing Piercing | Dark Cloud Cover Bullish 3 Inside | Bearish 3 Inside There are only a few settings at the begining to take. Every Pat
FREE

This indicator draws regular bullish and bearish divergences in real-time onto the charts. The algorithm to detect those divergences is based on my 10+ years experience of detecting divergences visually. The divergences are drawn as green and red rectangles on the charts. You can even do forward testing in the visual mode of the strategy tester.
Parameters Fast EMA Period: The period of the fast EMA of the MACD. Default value is 12.
Slow EMA Period: The period of the slow EMA of the MACD. Defau
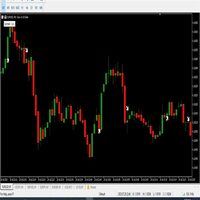
hello,
king binary sureshot mt5 binary indicator,
1 minute candle
1 minute expire
Alright. This indicator works on MT5 and is very easy to use. When you receive a signal from it, you wait for that candle with the signal to close and you enter your trade at the beginning of the next new candle. A red arrow means sell and a green arrow means buy. All arrows comes with a long dotted like for easy identification of trade signal. Are you okay with that?
FREE

Was: $49 Now: $33 Blahtech Better Volume provides an enhanced version of the vertical volume bars. Each bar is compared to the previous 20 bars. Depending on its volume, range and volume density it will be assigned a state and colour. Low Volume – Minimum volume High Churn – Significant volume with limited movement Climax Neutral – High volume with unclear direction
Climax Up – High volume with bullish direction Climax Dn – High volume with bearish direction Climax Churn – High vol

This indicator converted from 5 min Buy and Sell Range Filter - guikroth version on TradingView Popularity of the Range Filter
The Range Filter is a very popular and effective indicator in its own right, with adjustments to the few simple settings it is possible to use the Range Filter for helping filter price movement, whether helping to determine trend direction or ranges, to timing breakout or even reversal entries. Its practical versatility makes it ideal for integrating it's signals into a

"Agulhadas" 전략을 알아보세요 이 전략은 브라질 시장에서 인기 있는 개념에서 영감을 받아, 트렌드, 시장 강도, 모멘텀을 기반으로 진입 및 청산 포인트를 식별하기 위해 5가지 기술 지표를 결합합니다. 사용되는 지표 중에는 이동 평균 교차를 시각적으로 보여주는 것으로 잘 알려진 Odair Aguiar가 개발한 유명한 Didi 지수가 포함되어 있습니다. 여기에서 주식 스캐너 다운로드 사용된 지표 Didi 지수 ADX 볼린저 밴드 Trix 스토캐스틱 전략 작동 방식 지표는 미리 정의된 기준에 따라 매수 및 매도 진입 지점에 화살표를 표시하며, 차트에 "X"로 청산 지점을 시각적으로 나타냅니다. 매수 신호 진입을 확인하기 위해 다음 세 가지 조건이 충족되어야 합니다: ADX 상승 추세 ADX가 32 이상이거나 상승 중이며, DI+가 DI-보다 높음. Didi 지수의 골든 크로스 단기 평균이 중기 평균을 상향 돌파. 볼린저 밴드 확장 상단 및 하단 밴드가 동시에 확장됨. 매도 신호
FREE

The Heikin Ashi indicator is our version of the Heikin Ashi chart. Unlike competitor products, this indicator offers extensive options for calculating Heikin Ashi candles. In addition, it can be displayed as a classic or smoothed version.
The indicator can calculate Heikin Ashi with moving average by four methods: SMA - Simple Moving Average SMMA - Smoothed Moving Average EMA - Exponential Moving Average LWMA - Linear Weighted Moving Average
Main features The indicator shows Heikin As
FREE

CandleTimeAndSpreadLine – Tempo de vela e Spread em tempo real O CandleTimeAndSpreadLine é um indicador que mostra duas informações essenciais diretamente no gráfico:
(1) o tempo restante da vela atual e
(2) o spread em pontos, ambos ancorados ao preço de referência escolhido (Ask, Bid ou Mid). Ele utiliza atualização via OnTimer , garantindo que o tempo continue fluindo mesmo em momentos de baixa atividade do mercado.
Os valores são exibidos em rótulos sobrepostos ao gráfico, sem interferir na
FREE

Volume oscillator 는 가격의 통계적 편차 분석과 거래량의 강도를 결합한 하이브리드 기술 지표입니다. 이 지표는 시장의 상태(추세 또는 횡보) 변화를 시각적 및 수학적으로 정확하게 식별하기 위해 개발되었습니다. 일반적인 오실레이터와 달리, 이 지표는 **거래량 RSI(Volume RSI)**를 사용하여 가격 변동성을 가중합니다. 이를 통해 거래량이 동반되지 않은 '가짜' 움직임을 걸러내고, 대규모 자금 유입으로 확인된 진정한 변동성 분출을 강조합니다. 주요 기능: HLC3 가격 분석: (고가+저가+종가)/3 평균 가격을 사용하여 종가만 사용하는 방식보다 균형 잡힌 시장 해석을 제공합니다. 동적 거래량 계수: InpVolImpact 파라미터를 통해 거래량이 히스토그램 진폭에 미치는 영향력을 사용자가 직접 조절할 수 있습니다. 4색 비주얼 히스토그램: 밝은 녹색: 거래량이 동반된 강력한 상승 변동성 (강한 상승 모멘텀). 어두운 녹색: 상승 추세에 있으나 거래량이나 변동성이
FREE
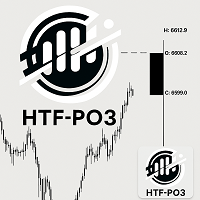
HTF Power of Three (ICT) - MT5 Indicator - Version 1.1 Overview The HTF Power of Three indicator is a professional implementation of the Inner Circle Trader's (ICT) Power of Three concept, inspired by Larry Williams. This indicator visualizes higher timeframe (HTF) candle development in real-time on any lower timeframe chart, making it an essential tool for ICT traders who study institutional price movement patterns. What is Power of Three (PO3)? Power of Three represents a three-staged Smart M
MetaTrader 마켓은 개발자들이 거래 애플리케이션을 판매할 수 있는 간단하고 편리한 사이트이다.
제품을 게시하고 마켓용 제품 설명을 어떻게 준비하는가를 설명하는 데 도움이 됩니다. 마켓의 모든 애플리케이션은 암호화로 보호되며 구매자의 컴퓨터에서만 실행할 수 있습니다. 불법 복제는 불가능합니다.
트레이딩 기회를 놓치고 있어요:
- 무료 트레이딩 앱
- 복사용 8,000 이상의 시그널
- 금융 시장 개척을 위한 경제 뉴스
등록
로그인
계정이 없으시면, 가입하십시오
MQL5.com 웹사이트에 로그인을 하기 위해 쿠키를 허용하십시오.
브라우저에서 필요한 설정을 활성화하시지 않으면, 로그인할 수 없습니다.