YouTube'dan Mağaza ile ilgili eğitici videoları izleyin
Bir alım-satım robotu veya gösterge nasıl satın alınır?
Uzman Danışmanınızı
sanal sunucuda çalıştırın
sanal sunucuda çalıştırın
Satın almadan önce göstergeyi/alım-satım robotunu test edin
Mağazada kazanç sağlamak ister misiniz?
Satış için bir ürün nasıl sunulur?
MetaTrader 5 için teknik göstergeler - 10
The "Breakout Finder" is a technical indicator designed to automatically identify potential price breakouts and breakdowns on a chart. The highlight of this indicator is its robust signal filtering system, which helps traders avoid false signals (fakeouts) and focus on higher-probability trading opportunities. Key Features Automatic Pivot Point Detection: The indicator automatically identifies significant pivot highs and lows on the chart to establish potential support and resistance levels. Bre
FREE

It predicts the most likely short-term price movement based on advanced mathematical calculations.
Features Estimation of immediate price movement; Calculation of the real market trend; Calculation of the most important support and resistance levels; Algorithms optimized for making complex mathematical calculations with a minimal drain of system resources; Self-adjusting for better performance, so it’s able to work properly at any symbol (no matter how exotic it is) and any timeframe; Compatibl

A indicator for detecting FVGS
I hope this helps you scalp and generate money for yourself
NOTE BETTER:
Trading is risky and you can lose all your funds , use the money you are willing to lose
NOTE BETTER:
Trading is risky and you can lose all your funds , use the money you are willing to lose
NOTE BETTER:
Trading is risky and you can lose all your funds , use the money you are willing to lose
FREE

Watermark Centralized
Adds a watermark centered with the asset name and chosen period.
It is possible to override the font type, font size, font color and separator character.
The watermark is positioned behind the candles, not disturbing the visualization.
It has automatic re-centering if the window is resized.
Hope this indicator helps you, good trading ;)
FREE

Dominion Levels: The "Market Structure" Architect
Perfect for XAUUSD (Gold)
The definitive tool for identifying "Hard" Support and Resistance levels that actually hold. Most traders draw support and resistance lines based on feelings or vague zones. The result? Messy charts, subjective decisions, and getting stopped out by "noise." Dominion Levels solves this by removing the subjectivity. It is not just another line drawer; it is a Stepped Structure Engine. It identifies significant pric

FXLAND Smart Reversal Indicator (MT5)
FXLAND Smart Reversal Indicator is a professional technical analysis tool designed to help traders identify potential price reversal zones and key market turning points with clarity and precision.
The best reversal indicator and price return by choosing only one ceiling or floor in each time frame
A masterpiece of combining mathematics and Gann, fractal matrix, Fibonacci, movement angle and time. Completely intelligent
Key Features
Detects potenti
UT Bot with Alerts The UT Bot Alerts Indicator for MetaTrader 5 is a versatile trading tool that generates buy and sell signals based on ATR-based trailing stop logic. It displays signals with arrows, draws an entry price line, and includes a candle countdown timer. The indicator offers customizable alerts (pop-up, email, push notifications) and a text label showing signal details. Users can adjust ATR sensitivity, label positions, and timer settings, making it suitable for various markets and
FREE

This indicator finds and displays the Double Bottom and Double Top technical analysis patterns. Signals (displays a message on the screen) if the shape was formed recently. Often after the appearance of these patterns, the trend reverses or a correction occurs. In order not to search for them yourself, or not to miss their appearance, it is enough to add an indicator to the chart. The indicator can be used on different timeframes and currency pairs, there are settings for a better search on a c
FREE

MACD Gün İçi Trend PRO, 1960'larda Gerald Appel tarafından oluşturulan orijinal MACD'nin uyarlanmasıyla geliştirilen bir Göstergedir.
Yıllarca süren ticaret sayesinde, MACD'nin parametrelerini Fibonacci oranlarıyla değiştirerek, trend hareketlerinin sürekliliğinin daha iyi bir sunumunu sağladığımız ve bir fiyat trendinin başlangıcını ve sonunu daha verimli bir şekilde tespit etmeyi mümkün kıldığımız gözlemlendi.
Fiyat trendlerini tespit etmedeki etkinliği sayesinde, üst ve dip farklarını çok

This is a derivative of John Carter's "TTM Squeeze" volatility indicator, as discussed in his book "Mastering the Trade" (chapter 11).
Gray dot on the midline show that the market just entered a squeeze (Bollinger Bands are with in Keltner Channel). This signifies low volatility, market preparing itself for an explosive move (up or down). Blue dot signify "Squeeze release".
Mr.Carter suggests waiting till the first blue after a gray dot, and taking a position in the direction of the moment
FREE

NeoBull Predictive Ranges – Gelişmiş Volatilite ve Hacim Sistemi Description: NeoBull Predictive Ranges, MetaTrader 5 için kapsamlı bir teknik analiz sistemidir. Gelişmiş volatilite hesaplamalarını hacim tabanlı trend analizi ile tek bir göstergede birleştirir. Bu araç, yatırımcılara piyasa yapısı ve emir akışı (Order Flow) hakkında kesin bilgiler sunmak için tasarlanmıştır. Bu profesyonel aracı topluluğa ücretsiz olarak sunuyorum. Özellikler ve Teknik Detaylar: Predictive Ranges (Dinamik Volati
FREE

[Power Volume Candle] - Indicator to see the comparison of bullish and bearish volume
Volume comparison indicator on candlestick, by calculating the volume value of the specified candle history to determine the percentage of volume strength. calculates the percentage comparison of each time frame displayed on 1 screen. Subscribe the MQL5 channel for other interesting information : (Automatic) Forex Tools Join new Public Group to Expressing Opinions and Sharing: Auto Fx Investment See other
FREE

Indicador gratuito para Metatrader 5 que muestra en pantalla una caja rectangular para cada una de las sesiones de mercado "Londres, New York y Tokio". Se puede establecer la zona horaria de forma automática o mediante un valor de offset. Parámetros de configuración para cada una de las sesiones. Visible / No visible Hora Inicial Hora Final Caja sólida o transparente. Estilo del borde de la caja. Grosor del borde de la caja. Color.
FREE

Dark Inversion is an Indicator for intraday trading. This Indicator is based on Counter Trend strategy but use also Volatility. We can enter in good price with this Indicator, in order to follow the inversions on the current instrument. Hey, I made an Expert Advisor based on this indicator, if you are interested: Dark Titan MT5
Key benefits
Easily visible Inversion Lines Intuitive directional arrows Automated adjustment for each timeframe and instrument Easy to use even for beginners Never r
FREE

The Hull Moving Average is not very well know in novice and maybe in intermediate trading circles, but it is a very nice solution created by the trader Alan Hull - please visit www.AlanHull.com for full details of his creation. The purpose of this moving average is to solve both problems that all famouse and common moving averages have: Lag and Choppiness . The implementation we did has, apart of the Period configuration and Price type to use in the calculations, a "velocity" factor, which could
FREE

The Market Structure Analyzer is a powerful tool designed for traders who follow market structure and smart money concepts. This comprehensive indicator provides a suite of features to assist in identifying key market levels, potential entry points, and areas of liquidity. Here's what it offers:
1. Swing High/Low Detection : Accurately identifies and marks swing highs and lows, providing a clear view of market structure.
2. Dynamic Supply and Demand Zones: Draws precise supply and demand zone
REVERSAL POWER PRO
The ONLY Indicator That Shows You Where Markets WILL Reverse - BEFORE They Move
WELCOME TO THE NEXT LEVEL OF TRADING PRECISION
Tired of guessing where the market will turn? Missing entries because you don't know where support/resistance REALLY is? Getting stopped out at "fake" levels? Wondering if your bias is correct before entering?
What if you had: Crystal-clear Supply/Demand Zones that markets RESPECT Daily Bias Engine telling you market directio
FREE
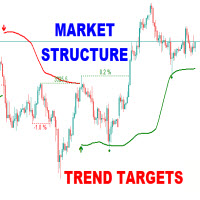
The Market Structure Trend Targets is a powerful trading indicator designed to give traders a clear, structured, and data-driven view of market momentum, breakouts, and key price reaction zones. Built on the principles of smart market structure analysis , it helps identify not only trend direction, but also precise breakout levels , trend exhaustion , and potential reversal zones — all with visual clarity and trader-friendly metrics. Key Features Breakout Points with Numbered Markers Track signi

Donchian Channel is an indicator created by Richard Donchian. It is formed by taking the highest high and the lowest low of the last specified period in candles. The area between high and low is the channel for the chosen period.
Its configuration is simple. It is possible to have the average between the upper and lower lines, plus you have alerts when price hits one side. If you have any questions or find any bugs, please contact me. Enjoy!
FREE

The Order Block Indicator for MT5 is a powerful tool designed for traders who use smart money concepts and institutional trading strategies. It automatically detects key order blocks on the chart, helping traders identify high-probability reversal and continuation zones.
Key Features: • Automatic Order Block Detection – Highlights strong buying and selling zones based on price action and volume. • Multi-Timeframe Support – Analyze order blocks across different timeframes for better market in
FREE
Quantum Profile System is a fully-fledged professional trading system with advanced algorithms, combining everything needed for confident and stable trading. This indicator merges trend direction analysis, volume concentration at key levels, dynamic adaptation to market volatility, and generation of trading signals with no delay or repainting. Quantum Profile System integrates a Linear Regression Volume Profile with an adaptive ATR-based trend channel. It includes an extended Volume Profile modu

Projective SR – Gerçek Zamanlı Projelendirilmiş Destek ve Dirençler Projective SR , grafikteki temel destek ve direnç noktalarını otomatik olarak tespit eden ve fiyatın tepki verebileceği potansiyel bölgeleri öngörerek bunları çapraz ve dinamik bir şekilde geleceğe yansıtan gelişmiş bir göstergedir. Yalnızca sabit seviyeleri gösteren geleneksel göstergelerin aksine, Projective SR fiyatın geometrisini analiz eder , en alakalı pivotları belirler ve piyasa hareketine uyum sağlayan eğik çizgiler çiz
FREE

Smart Entry Levels - Fractal and ATR Based Indicator Smart Entry Levels identifies key support and resistance zones using classical fractal detection and ATR-based volatility measurement. The indicator is designed for clarity, stability, and compliance with MQL5 Market rules. Features Upper Zone - Resistance area based on recent fractal highs Lower Zone - Support area based on recent fractal lows ATR-based sizing - Zones adapt dynamically to market volatility with selectable timeframe Non-repain
FREE
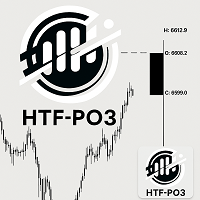
HTF Power of Three (ICT) - MT5 Indicator - Version 1.1 Overview The HTF Power of Three indicator is a professional implementation of the Inner Circle Trader's (ICT) Power of Three concept, inspired by Larry Williams. This indicator visualizes higher timeframe (HTF) candle development in real-time on any lower timeframe chart, making it an essential tool for ICT traders who study institutional price movement patterns. What is Power of Three (PO3)? Power of Three represents a three-staged Smart M

VR Donchian göstergesi, Donchian kanalının geliştirilmiş bir versiyonudur. İyileştirmeler kanalın neredeyse tüm işlevlerini etkiledi ancak ana işletim algoritması ve kanal yapısı korundu. Mevcut trende bağlı olarak top göstergesine seviyelerin renginde bir değişiklik eklendi - bu, yatırımcıya trendde veya yatayda bir değişiklik olduğunu açıkça gösterir. Yatırımcıyı akıllı telefon, e-posta veya MetaTrader terminalinde iki kanal seviyesinden birinin kırılması hakkında bilgilendirme yeteneği eklend
FREE

BOOM AND CRASH PRO SPIKER This indicator is specifically designed for all boom and crash indices. The indicator targets buy spike signals for boom indices and sell spike signals for crash indices. The indicator contains optimized trend filters to target buy spikes in an uptrend and sell spikes in a downtrend. The indicator also adds a grid signal to recover some loss of the first signal. The indicator also provides exit signals for delayed spikes which can help with risk management. Also, it an
FREE
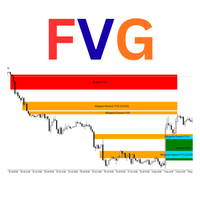
Luta FVG Pro – Professional Fair Value Gap (FVG) Indicator
Detects Institutional Fair Value Gaps on H4 timeframe with the same way used by ICT/SMC traders.
Features: • Real-time Bullish & Bearish FVG detection • Automatic Mitigation tracking • Inverted FVG signals (very powerful reversal setups) • "GOOD" FVG marking (gaps ≥ 2× minimum size – higher probability) • Clean rectangles with smart labels (Bullish FVG / Mitigated / Inverted) • Overlap filter option • Maximum 50 active zones (no chart
FREE

Phoenix Destek ve Direnç Dedektörü (MT5)
MetaTrader 5 için profesyonel destek ve direnç algılama aracı. Daha yüksek zaman diliminden en güçlü S&R seviyelerini otomatik olarak algılar ve görsel bir kontrol paneli aracılığıyla kapsamlı güç analizi görüntüler.
Genel Bakış
Phoenix Destek ve Direnç Dedektörü, daha yüksek zaman dilimi pivot analizi (varsayılan H4, özelleştirilebilir) kullanarak en güçlü üç destek ve direnç seviyesini belirler. Sistem, seviyeleri test sayısı, konsolidasyon çubukları
FREE
TÜM ÜCRETSİZ ÜRÜNLERİMİ GÖRMEK İÇİN BURAYA TIKLAYIN
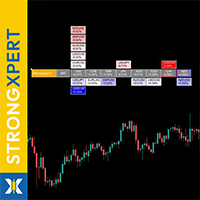
StrongXpert , küresel döviz piyasasında gerçek zamanlı para birimi gücünü hassas şekilde izlemek için geliştirilmiş bir araçtır. Bu araç, sermayenin gerçekten nereye aktığını - ve piyasadan nereye çıktığını göstermek amacıyla oluşturulmuştur. Gösterge, 8 ana para biriminin (USD, EUR, GBP, JPY, AUD, CAD, CHF, NZD) göreceli gücünü ölçer ve karmaşık fiyat hareketlerini basit, okunabilir bir görsel panele dönüştürür - hem de doğrudan grafikte. En
FREE

Neural-Link Pattern Scanner: Advanced Candlestick Recognition for MetaTrader 5 The Neural-Link Pattern Scanner is a professional-grade technical analysis tool designed for the MetaTrader 5 platform. It automates the detection of high-probability candlestick patterns, providing real-time visual labels directly on the trading interface. By filtering for specific mathematical price structures, this indicator helps traders identify potential reversals and trend continuations with precision. If you a
FREE

The indicator plots a trend channel using the technique by Gilbert Raff. The channel axis is a first-order regression. The upper and lower lines show the maximum distance the Close line had moved away from the axis line. Therefore, the upper and lower lines can be considered as resistance and support lines, respectively. A similar version of the indicator for the MT4 terminal
As a rule, most movements of the price occur within a channel, going beyond the support or resistance line only for a sh
FREE

Boom and crash Gold Miner v2 trend histogram which works in conjunction with the indicator above that has arrows as shown in the video. PLEASE Note: That the top indicator and the bottom indicator are two separate indicators. the top indicator is https://www.mql5.com/en/market/product/98066 the bottom one is free. which is the histogram at the bottom. the trend histogram trading tool that helps to easy detect the trend blue color indicates an uptrend. Orange color is a down trend.
FREE

Stargogs Spike Catcher V4.0 This Indicator is Developed To milk the BOOM and CRASH indices .
Now Also work on weltrade for PAIN and GAIN indices. Send me Message if you need any help with the indicator. CHECK OUT THE STARGOGS SPIKE CATCHER EA/ROBOT V3: CLICK HERE ALSO CHECK OUT SECOND TO NONEFX SPIKE CATCHER: CLICK HERE STARGOGS SPIKE CATCHER V4.0 WHATS NEW! Brand New Strategy. This is the Indicator you need for 2025. New Trend Filter to minimize losses and maximize profits. New Trendline th

Meravith Auto, Meravith ticaret sisteminin otomatik bir versiyonudur. Gösterge, rengini değiştiren bir trend çizgisinden oluşur. Yükseliş trendindeyken yeşil, düşüş trendindeyken kırmızıdır. Bu, trendin destek çizgisidir. Boğa hacminin ayı hacmine eşit olduğu bir likidite çizgisi. Üçlü boğa sapma çizgisi. Üçlü ayı sapma çizgisi. Yüksek hacmi gösteren mor ve mavi noktalar. Mor nokta, ortalama hacmin iki sapma üstünde hacmi gösterirken, mavi nokta iki sapmayı gösterir. Nasıl kullanılır? Trend çizg
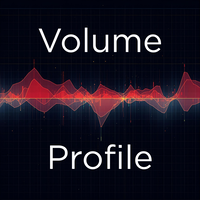
Volume Profile Density V2.40 Fiyat seviyelerine göre işlem hacmini gösterir ve kurumsal ilgiyi çeken bölgeleri ortaya çıkarır.
Klasik hacim göstergelerinden farklı olarak, hacmin gerçekte nerede yoğunlaştığını gösterir. Temel ilkeler: Yatay çubuklar = her fiyat seviyesindeki işlem hacmi Daha uzun çubuk → daha yüksek hacim Kırmızı bölgeler = güçlü destek / direnç alanları Ana kullanımlar: Gerçek destek ve direnç bölgelerini belirleme POC (Point of Control) tespiti Değer Alanı (toplam hacmin %70’i
FREE

Are you tired of drawing Support & Resistance levels for your Quotes? Are you learning how to spot Support & Resistances? No matter what is your case, Auto Support & Resistances will draw those levels for you! AND, it can draw them from other timeframes, right into you current chart, no matter what timeframe you are using... You can also Agglutinate regions/zones that are too much closer to each other and turning them into one single Support & Resistance Level. All configurable.
SETTINGS
Timefr
FREE
Trader Dynamic Index Added Signal – Piyasa bağlamına dayalı bilimsel bir yaklaşım 1. Giriş Modern teknik analizde, geleneksel osilatörler çoğu zaman piyasa bağlamından kopuk, izole sinyaller üretir , bu da yanlış veya zayıf sinyallerin yüksek oranına yol açar.
Trader Dynamic Index Added Signal (TDI-AS) , bu sorunu çözmek için geliştirilmiş olup, osilatör tabanlı sinyal üretimini yeniden tanımlamakta ve bağlam farkındalığını sinyal onayının temel koşulu haline getirmektedir. 2. Teorik Çerçeve 2.1
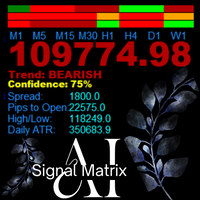
AanIsnaini Signal Matrix MT5 Multi-Timeframe Confidence Signal Dashboard The Free Version of AanIsnaini Signal Matrix MT5 Pro AanIsnaini Signal Matrix MT5 is a powerful all-in-one indicator that analyzes market direction and confidence levels across multiple timeframes — allowing traders to see the overall bias of the market at a single glance. It combines signals from Price Action , Support–Resistance , and several proven technical tools (MACD, ADX, RSI, MA slope, ATR, and Volume Ratio), then
FREE

A simple indicator that automatically highlights all FVGs (Fair Value Gaps) formed on the chart, as well as FVGs on history. It is possible to select colors for FVGs of different directions (long or short), select the time interval, select the color of middle point and you can also choose whether to delete filled FVGs or leave them on the chart (the option is beneficial for backtesting). The indicator can be very useful for those, who trade according to the concept of smart money, ICT, or simply
FREE

Contact me to send you instruction and add you in group.
QM (Quasimodo) Pattern is based on Read The Market(RTM) concepts. The purpose of this model is to face the big players of the market (financial institutions and banks), As you know in financial markets, big traders try to fool small traders, but RTM prevent traders from getting trapped. This style is formed in terms of price candles and presented according to market supply and demand areas and no price oscillator is used in it. RTM conc
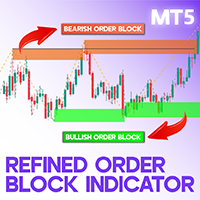
Refined Order Block Indicator for MT5 Designed around ICT and Smart Money strategies, the Refined Order Block (OBR) indicator is an essential tool for traders on the MetaTrader 5 (MT5) platform. It identifies and highlights key price levels by marking bullish order blocks in green and bearish order blocks in brown. These levels represent potential price reversal zones , often influenced by large institutional and bank orders. When the price reaches these critical areas, it may experience signifi

Phoenix Trend Güç Ölçer (MT5)
MetaTrader 5 için piyasa rejimi ve trend gücü analizcisi. ADX, RSI ve Yönsel Hareket'i tek bir panelde birleştirerek piyasa koşullarını gerçek zamanlı olarak sınıflandırır.
Amaç
Çoğu yatırımcı, kötü girişler nedeniyle değil, yanlış piyasa rejimine yanlış strateji uyguladıkları için başarısız olur. Phoenix Trend Güç Ölçer, yatırımcıların piyasanın dalgalı mı, trend mi, güçlü trend mi yoksa tükenme riski bölgesine mi girdiğini anında belirlemelerine yardımcı olur.
FREE

Divergence Force Diverjans Göstergesi Açıklama Divergence Force , bir varlığın fiyatı ile MACD (Hareketli Ortalama Yakınsama Iraksama) arasındaki uyumsuzlukları belirlemek için tasarlanmış bir göstergedir. Bu gösterge, fiyat ve MACD'nin zirve ve dip noktalarına otomatik olarak trend çizgileri çizer ve potansiyel ticaret fırsatlarını vurgular. Temel Özellikler Otomatik Uyumsuzluk Tespiti : Gösterge, fiyat ve MACD arasındaki boğa ve ayı uyumsuzluklarını otomatik olarak tespit eder. Trend Çizgisi T
FREE

Did You Have A Profitable Trade But Suddenly Reversed? In a solid strategy, exiting a trade is equally important as entering.
Exit EDGE helps maximize your current trade profit and avoid turning winning trades to losers.
Never Miss An Exit Signal Again
Monitor all pairs and timeframes in just 1 chart www.mql5.com/en/blogs/post/726558
How To Trade You can close your open trades as soon as you receive a signal
Close your Buy orders if you receive an Exit Buy Signal. Close your Sell orders if

"Pattern 123" is an indicator-a trading system built on a popular pattern, pattern 123.
This is the moment when we expect a reversal on the older trend and enter the continuation of the small trend, its 3rd impulse.
The indicator displays signals and markings on an open chart. You can enable/disable graphical constructions in the settings.
The indicator has a built-in notification system (email, mobile terminal, standard terminal alert).
"Pattern 123" has a table that displays signals from se

The Weis Waves RSJ Indicator sums up volumes in each wave. This is how we receive a bar chart of cumulative volumes of alternating waves. Namely the cumulative volume makes the Weis wave charts unique. It allows comparing the relation of the wave sequence characteristics, such as correspondence of the applied force (expressed in the volume) and received result (the price progress).
If you still have questions, please contact me by direct message: https://www.mql5.com/en/users/robsjunqueira/
FREE

Closing Price Reversal is a very well known and traded candlestick pattern. This little indicator paints with specific (user-selected) colors the Closing Price Reveral Up and Down patterns, as well as the Inside Bars (as a bonus). Higher timeframes are more effective as with all other candlesticks patterns. Do NOT trade solely on this indicator. Search the web for "Closing Price Reversal" to learn about the several approaches that can be used with this pattern. One of them is combining short/me
FREE

The indicator that shows the countdown to the change of candles is equipped with an alert when the bar changes (the alert is not active if installed on the M1 time frame). Displays seconds if installed in time frame M1, displays minutes and seconds if installed in time frame above M1, and displays hours and minutes if installed in time frame h1 and above. The time displayed is calculated based on the running time.
FREE

Overview Liquidity Indicator is a market analysis tool designed to help traders identify potential market reaction zones based on liquidity behavior and price action. Instead of using traditional moving averages, this indicator analyzes liquidity flow and pivot structures to highlight areas where price may react. This indicator is intended to support technical analysis and decision-making, not to predict or guarantee market outcomes.

MT4 Sürümü: https://www.mql5.com/en/market/product/157679 MT5 Sürümü: https://www.mql5.com/en/market/product/157680
Destek Direnç — Akıllı Piyasa Yapısı Seviyeleri
Profesyonel yatırımcılar ve otomatik sistemler için tasarlanmış, temiz, akıllı ve son derece güvenilir bir Destek ve Direnç göstergesi.
Destek Direnç, Fraktallar, ATR tabanlı fiyat segmentasyonu ve çoklu zaman dilimi analizini birleştiren gelişmiş bir kümeleme algoritması kullanarak gerçek piyasa seviyelerini tespit etmek üzere ta

KT Knoxville Divergence, Göreli Güç Endeksi (RSI) ile bir momentum osilatörünün özenle birleştirilmesiyle finansal enstrümanlardaki benzersiz fiyat uyumsuzluklarını ortaya çıkaran güçlü bir araçtır. Bu gösterge, piyasadaki küçük dinamik değişimleri etkili bir şekilde yakalar ve yatırımcılara potansiyel olarak karlı işlem fırsatlarını daha yüksek doğrulukla belirlemede yardımcı olur. Knoxville Divergence, Rob Booker tarafından geliştirilmiş bir tür işlem uyumsuzluğudur. İşlemde uyumsuzluk, bir v

Twin Peak Göstergesi MT5'e Hoş Geldiniz --(Çift Üst/Alt)-- Çift Üst ve Alt Göstergesi, piyasadaki potansiyel ters dönüş modellerini belirlemek için tasarlanmış bir teknik analiz aracıdır.
Fiyatın neredeyse eşit yükseklikte iki ardışık tepe veya dip yaptığı ve ardından ters yönde bir fiyat hareketinin olduğu alanları tanımlar.
Bu model, piyasanın ivme kaybettiğini ve trendin tersine dönmesi için hazır olabileceğini gösteriyor. *Size talimatları ve adım kılavuzunu göndermek için satın aldıkta
Fine Timeframes, MT5 için bir dakika altı zaman dilimi göstergesidir. 1 ila 30 saniyelik aralıklarla grafikler oluşturarak, dakika ve saatlik grafiklerde görünmeyen piyasa hareketlerine erişmenizi sağlarken, tüm işlem işlevlerini korur: Standart zaman dilimlerinde olduğu gibi pozisyon açıp kapatabilirsiniz. Fine Timeframes yalnızca canlı tiklerde çalışır ve Strateji Test Cihazı için tasarlanmamıştır; demo sürümünü indirin ve göstergeyi EURUSD ve AUDUSD'de gerçek piyasa koşullarında test edin. Te
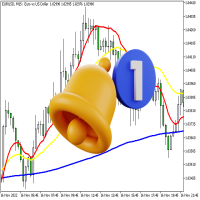
Gösterge üç çizgi görüntüler ve iki tür kavşağı izler. Göstergenin üç satırı: " MA " - yavaş gösterge "Hareketli Ortalama", " DEMA Yavaş " - yavaş gösterge " Çift Üstel Hareketli Ortalama" ve " DEMA Hızlı " - hızlı gösterge "Çift Üstel Hareketli Ortalama". İki tür kavşak : " MA Uyarı Fiyatı " - fiyat "MA" çizgisini geçiyor ve " Alert DEMA DEMA " - çizgiler kesişiyor "DEMA Yavaş" ve "DEMA Hızlı ". Karşıdan karşıya geçerken aşağıdaki seçenekler mevcuttur:
Keltner Kanalı Göstergesi MT5 ile ticaret stratejinizi yükseltin; 1960'larda Chester Keltner'in yeniliklerinden ilham alan, üstel hareketli ortalamaları (EMA) ortalama gerçek aralık (ATR) ile birleştirerek dinamik fiyat bantları oluşturan klasik bir volatilite aracı. Dijital çağda yeniden canlanmasından bu yana trader topluluklarında övülen bu gösterge, TradingView ve MQL5 gibi platformlarda çıkışlar ve trend dönüşlerini tespit etmedeki güvenilirliği ile popülerlik kazandı, genellikle daha pür
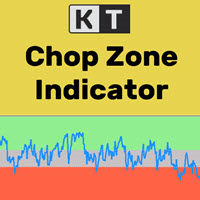
Finansal piyasalarda zamanın yalnızca %30’u trend hareketlerle geçerken, geri kalan %70’i yatay yani belirli bir aralıkta dalgalanarak geçer. Ancak, çoğu yeni başlayan yatırımcı için piyasanın gerçekten bir trend içinde mi yoksa yatay bir aralıkta mı hareket ettiğini anlamak oldukça zordur. KT Chop Zone bu sorunu çözmek için geliştirilmiştir. Piyasa durumunu açıkça üç bölgeye ayırarak gösterir: Ayı Bölgesi, Boğa Bölgesi ve Chop Zone (Yatay Bölge).
Özellikler
Yatay piyasalarda işlem yapmaktan ka
Haven ZScore Osilatörü , fiyatın ortalama değerinden anormal sapmaları belirlemek için tasarlanmış güçlü bir istatistiksel osilatördür. İndikatör sadece fiyatı takip etmekle kalmaz, aynı zamanda mevcut fiyatın istatistiksel olarak ne kadar önemli bir olay olduğunu ölçer, bu da aşırı alım/satım bölgelerini yüksek hassasiyetle belirlemeye ve potansiyel trend dönüş noktalarını bulmaya olanak tanır. Bu araç, veri odaklı bir yaklaşımı tercih eden ve bir düzeltme veya trend değişikliği olasılığının ma

TickFlow is a tool for tick-data analysis and visual highlighting of significant zones on the chart. The utility aggregates current and historical ticks, shows the buy/sell balance, and helps to identify support/resistance levels and cluster zones. This is the MetaTrader 4 version. How it works (brief) TickFlow collects tick data and aggregates it by price steps and candles. Based on the collected data the indicator builds visual layers: up/down tick counters, buy/sell ratio, historical levels

Finansta Z Puanları, bir gözlemin değişkenliğinin ölçüleridir ve tüccarlar tarafından piyasa oynaklığının belirlenmesine yardımcı olmak için kullanılabilir. Z puanları, Traders'a bir puanın belirli bir veri kümesi için tipik mi yoksa atipik mi olduğunu söyler. Z puanları aynı zamanda analistlerin birden fazla veri kümesinden alınan puanları uyarlayarak birbirleriyle daha doğru bir şekilde karşılaştırılabilecek puanlar oluşturmasını sağlar. # Pratikte, sıfır noktalı ZScore'umuz ve ultra yüksek no

Volume Profile Flex - POC, VAH and VAL with Price Level Display
Volume Profile Flex is a flexible and performance-optimized Volume Profile indicator designed to help traders identify important price levels based on traded volume rather than time.
The indicator provides a clear view of market acceptance areas, price rejection zones, and the most actively traded price levels directly on the chart. Main Features:
The indicator automatically calculates and displays key Volume Profile levels within
FREE

CGE Trading Suite is a market analysis system designed to eliminate guesswork from trading. It continuously adapts to real-time price behavior, helping traders stay aligned with key market levels and evolving market conditions. This comprehensive system integrates multiple analytical tools into a single workflow, including dynamic grid mapping, liquidity behavior analysis, ECM, trend lines, supply and demand zones, MIDAS, trade cycles, and directional channel projections. Together, these tools p

Boom ve Crash Spike Detector göstergesi, öncelikli olarak fiyatlardaki Boom ve Crash'i tespit etmek için gelişmiş bir stratejiye dayalı olarak kodlanmıştır. Fiyatlardaki yüksek olasılıklı Boom'ları ve Crash'leri tespit etmek için karmaşık algoritmalar yerleştirildi. Olası Patlama veya kilitlenme aşamalarında uyarı verir: Boom Phase: Fiyat çok hızlı arttığında. Çökme Aşaması: Fiyat çok hızlı düştüğünde.
SINIRLI SÜRELİ TEKLİF: Gösterge yalnızca 30 $ ve ömür boyu kullanılabilir.
Ana Özellikler
Ce

Trend Hunter , Forex, kripto para birimi ve CFD piyasalarında çalışmaya yönelik bir trend göstergesidir. Göstergenin özel bir özelliği, fiyat trend çizgisini hafifçe deldiğinde sinyali değiştirmeden trendi güvenle takip etmesidir. Gösterge yeniden çizilmez; çubuk kapandıktan sonra pazara giriş sinyali görünür.
Bir trend boyunca hareket ederken gösterge, trend yönünde ek giriş noktalarını gösterir. Bu sinyallere dayanarak küçük bir Zararı Durdur ile işlem yapabilirsiniz.
Trend Hunter dürüst bi

The indicator displays volume profiles based on the nesting principle. Profiles periods are pre-set so that each subsequent profile has a length twice as long as the length of the previous profile. In addition to profiles, the indicator displays volume clusters sorted by color, depending on the volume they contain.
Indicator operation features The indicator works on typical timeframes from M5 to MN, but for calculations uses historical data from smaller timeframes: M1 - for timeframes from M5
FREE

This indicator is an MQL5 port inspired by the "Cyclic Smoothed RSI" concept originally developed by Dr_Roboto and popularized by LazyBear and LuxAlgo on TradingView. The Cyclic Smoothed RSI (cRSI) is an oscillator designed to address the two main limitations of the standard RSI: lag and fixed overbought/oversold levels. By using digital signal processing (DSP) based on market cycles, the cRSI reduces noise without sacrificing responsiveness. It features Adaptive Bands that expand and contract
FREE

The indicator displays the orders book, as well as increases its depth, remembering the location of orders that have gone beyond the current "window" view.
Indicator capability Display the levels of open positions. Simulation of placing/cancelling/editing pending orders directly in the displayed orders book.
Indicator features The orders book display works only on those trading symbols for which it is broadcast by the broker. To reset the information about the rows that were recorded in the Sm
FREE

Adaptif ADR Adaptif ADR , ortalama günlük aralığı (ADR) hesaplamak ve görüntülemek için tasarlanmış profesyonel bir göstergedir. Hesaplama ve yöntemler Dört yumuşatma türü: SMA , EMA , SMMA (Wilder) , LWMA Farklı işlem tarzlarına ve volatilite modellerine uyum sağlar Dinamik gün mantığı İşlem seansı başlarken otomatik olarak çalışır Açılış fiyatı etrafında iki simetrik seviye belirler ADR’ye ulaşılana kadar seviyeler daralır Ulaşıldıktan sonra gün sonuna kadar sabit kalır Görsel yönlendirme İste

The Horse DCA Signal 1.26 – สุดยอดนวัตกรรมอินดิเคเตอร์สำหรับการเทรดทองคำและทุกสินทรัพย์ The Horse DCA Signal คืออินดิเคเตอร์รุ่นล่าสุดจากตระกูล WinWiFi Robot Series ที่ได้รับการออกแบบมาเพื่อยกระดับการเทรดบนแพลตฟอร์ม MT5 โดยเฉพาะ โดยเป็นการผสมผสานอัจฉริยะระหว่างกลยุทธ์ Follow Trend และ Scalping เข้าด้วยกันอย่างลงตัว คุณสมบัติเด่น: ระบบลูกศรแยกประเภทชัดเจน: ลูกศรสีทอง: บ่งบอกสภาวะตลาดช่วง Sideway เหมาะสำหรับการเทรดแบบ Swing Trade หรือ Scalping เก็บกำไรระยะสั้น (2) ลูกศรสีน้ำเงินและสีแดง: บ่งบอกส
FREE
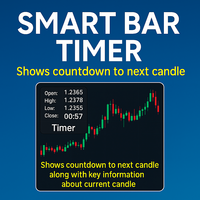
The Enhanced Bar Timer is a versatile and customizable indicator for MetaTrader 5 (MT5) that provides real-time information about the current candle, including a countdown timer for the next bar, candle details, volume, and spread. Displayed in the user-specified corner of the chart window, this indicator offers a multi-line or single-line format, allowing traders to monitor critical market data at a glance, enhancing decision-making and trading efficiency. Key Features Real-Time Bar Timer : Dis
FREE

Elevate your trading precision with the Copilot HUD Precision Price & Spread Visualizer. Most traders fail because they ignore the spread or lose track of candle closing times. This indicator is designed to provide professional-grade price transparency directly on your main chart window, combining a sleek dashboard with dynamic Bid/Ask visualization. Key Features: Dynamic Bid/Ask Lines: Unlike the default MT5 lines, these lines follow the current candle with a customizable length and thickness,
FREE
MetaTrader mağazası, geçmiş verilerini kullanarak test ve optimizasyon için alım-satım robotunun ücretsiz demosunu indirebileceğiniz tek mağazadır.
Uygulamaya genel bakışı ve diğer müşterilerin incelemelerini okuyun, doğrudan terminalinize indirin ve satın almadan önce alım-satım robotunu test edin. Yalnızca MetaTrader mağazasında bir uygulamayı tamamen ücretsiz olarak test edebilirsiniz.
Alım-satım fırsatlarını kaçırıyorsunuz:
- Ücretsiz alım-satım uygulamaları
- İşlem kopyalama için 8.000'den fazla sinyal
- Finansal piyasaları keşfetmek için ekonomik haberler
Kayıt
Giriş yap
Gizlilik ve Veri Koruma Politikasını ve MQL5.com Kullanım Şartlarını kabul edersiniz
Hesabınız yoksa, lütfen kaydolun
MQL5.com web sitesine giriş yapmak için çerezlerin kullanımına izin vermelisiniz.
Lütfen tarayıcınızda gerekli ayarı etkinleştirin, aksi takdirde giriş yapamazsınız.