 MetaTrader 5
 Experts
 Indicators
 Libraries
 Utilities
 Widgets
 Rules
Rules
Watch the Market tutorial videos on YouTube
How to buy а trading robot or an indicator
Run your EA on
virtual hosting
virtual hosting
Test аn indicator/trading robot before buying
Want to earn in the Market?
How to present a product for a sell-through
New Expert Advisors and Indicators for MetaTrader 4 - 353
 Trading robots perform market transactions automatically, while indicators allow you to better analyze quotes and predict the price behavior.
With these applications, you will be able to perform deals in MetaTrader 4 in a more informed manner, while capturing more opportunities.
Trading robots perform market transactions automatically, while indicators allow you to better analyze quotes and predict the price behavior.
With these applications, you will be able to perform deals in MetaTrader 4 in a more informed manner, while capturing more opportunities. 
This indicator automatically builds an alternative set of resistance and support lines based on areas where price are concentrated (instead of extremum points). The algorithm utilizes Linear Hough Transform ( Wikipedia ). New lines are used for trading in the similar way as in the classical approach, that is they indicate points for possible reversal or breakthrough in the future price actions. Yet their main advantage is that they cover most populated and consistent price regions, discovering a

"Nice Forex Pro" is particularly effective for the EUR/USD currency pair, which is one of the most popular and liquid pairs in the Forex market. The EA can be optimized for this pair due to several reasons: Why "Nice Forex Pro" is Best for EUR/USD : High Liquidity : The EUR/USD pair is the most traded currency pair in the world, which means it offers high liquidity. This results in tighter spreads and less slippage, making it ideal for automated trading systems like Nice Forex Pro , which rely

This indicator shows Commodity Channel Index (CCI) data from 9 currency pairs by your choice for all 9 Time Frames. If a digital value of the CCI is less or equal to DnLevel = -100 (or whatever number you decided to put) then a Green square will appear. This is potentially an oversold condition and maybe a good time to go Long. If a digital value of the CCI is greater or equal to UpLevel = 100 (or whatever number you decided to put) then a Red square will appear. This is potentially an overbough

This indicator shows bands (flexible corridor) for a current price movement and the change of trend. The indicator can be used on any time frames and currency pairs. The following input parameters can be easily changed for your needs: nPeriod = 13; - number of bars which the indicator will use for calculation Deviation = 1.618; - coefficient for bands distance from the middle line MaShift = 0; - shift from current bar

Multi Timeframe Indicator includes a lot of functions and can be considered as a universal helper for a trader. It's main objective is to display up to 10 indicators at a time using just one small brick per each of them. These indicators involve Awesome Oscillator, CCI, DeMarker, MACD, RSI, RVI, Stochastic, Larry Williams' Percent Range, Bulls Power and Bears Power. An important function of the indicator is an ability to monitor signals from different timeframes. You can choose different combina
FREE
Pipfinite creates unique, high quality and affordable trading tools. Our tools may or may not work for you, so we strongly suggest to try the Demo Version for MT4 first. Please test the indicator prior to purchasing to determine if it works for you. We want your good reviews, so hurry up and test it for free...we hope you will find it useful.
Combo Swing Control with Energy Beam Strategy: Confirm swing pullback signals Watch Video: (Click Here)
Features Detects overall bias and waits for overb

This indicator allows to analyze a chart using the rule of supple and demand. You will see zones of sales and purchases and determine the most profitable points to open positions. The indicator is based on the principle of market fractality. Chart zones show places where a strong buyer or seller has made the price reverse and change its direction. The indicator has several types of zones calculation. Color and type of zones displaying are set as desired. The zone width can be displayed in pips.
FREE

Trend Stop Introduction Trend Stop is a simple yet powerful trend-following and stop-placement tool for MetaTrader 4.
It calculates the highest high or lowest low of the last N periods and plots a dynamic line that reacts instantly to trend changes. The result is a clean, reliable trend filter and a practical guide for placing optimal stop levels — without unnecessary noise or lag. Whether you’re a trend trader, swing trader, or scalper, Trend Stop helps you stay on the right side of the marke

A visual indicator of currency trends and strengths, featuring a histogram and table on the main chart, a currency trend chart, and an analysis block on an additional chart window. It analyzes 28 currency pairs made up of 8 major currencies (EUR, USD, GBP, JPY, AUD, CAD, CHF, and NZD). Indicator capabilities Determines the direction and strength of the trend of currencies and symbols and builds multi-colored histograms, tables, informing with digital values and graphs based on this Shows the re

Join trading with the WolfeWaveBuilder indicator! This is a unique tool created specifically for obtaining the most successful and profitable investment decisions. It is ideal for live accounts and benefits from a thoroughly tested and virtually guaranteed trading strategy. Don't miss your opportunity! Start making money trading with the WolfeWaveBuilder indicator!
MT5 version https://www.mql5.com/ru/market/product/82360
Indicator Features
Gives signals for the Wolfe Waves strategy.

This is an interactive and easy-to-set indicator which allows to form seven equally spaced channels which have your settings simultaneously. All seven channels are enabled by default. But you can easily enable one or another channel using control buttons located in the upper case of the indicator's control panel. You can change a period of the indicator calculation by clicking one of buttons indicating number of the channel in the lower case of the control panel. Two other buttons (one of them i

This indicator shows data from 9 currency pairs by your choice for all 9 Time Frames. If a digital value of the RSI is less or equal to DnLevel = 30 (or whatever number you decided to put) then a Green square will appear. This is potentially an oversold condition and maybe a good time to go Long. If a digital value of the RSI is greater or equal to UpLevel = 70 (or whatever number you decided to put) then a Red square will appear. This is potentially an overbought condition and maybe a good time

This indicator shows an Up trend ( Green square ) if a parabolic SAR value is below the current price, and Down trend ( Red square ) if a parabolic SAR value is above the current price from all Time Frame for each currency pairs. Input parameters from Symb1 to Symb9 — You may change any of these Symbols to any legal currency pair existed on your platform. step=0.0; — Represents the acceleration factor for PSAR indicator. maximum=0.2; — Maximum value for the acceleration factor for PSAR indicator
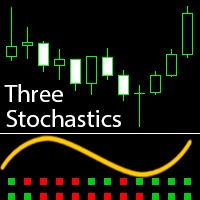
This indicator signals about crossing of the main and the signal lines of stochastic (lower stochastic) in the trend direction which is determined by two stochastics of higher time frames (higher stochastics). It is not a secret that stochastic generates accurate signals in a flat market and a lot of false signals in a protracted trend. A combination of two stochastics of higher time frames performs a good filtration of false signals and shows the main tendency. The indicator is recommended for
FREE

This indicator is designed for drawing equidistant channels. Two options are available: based on the number of hours in the indicator calculation and by the number of bars. To draw a channel, enter a number 1 or greater. The maximum value is limited by the amount of visible bars. If the parameters you enter are beyond the allowable limits, you will get notified if the indicator restrictions. Please note that the time involved in calculation of the channel must be greater than the timeframe it wi
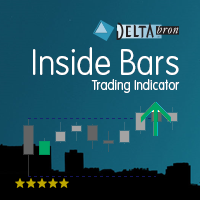
The Inside Bars indicator shows Inside Bars, the Breakout Zone and Breakouts thereof. Inside Bars are an important price action pattern. The price action of an Inside Bar is completely covered by the price action of the previous bar. Inside Bars are most often used on higher timeframes. Settings Inside Bars default settings are good enough most of the time. Feel free to fine tune them to your needs. ATR factor to skip large candles - very large candles should be filtered as they often cover othe
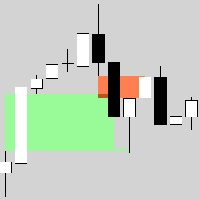
Hidden123Gap (123Gap) is universal business tool from the professional traders that helps to visualize market situation. It previews markets using a price action and a sentiment in the market. The tool is necessary to understand the market situation and the anticipation of further movement. Finally, you will see how traders estimate the market. With this tool, you will see important supports and resistances. It shows you the entry of big players on the market. The indicator works on all timefram
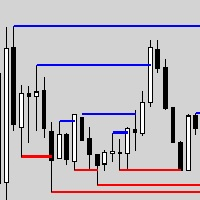
PivotHighLow. Universal business tool from professional traders that helps to visualize interest market situations. It previews markets using a price action and sentiment in the market. Tool is necessary to understand the market situation and the anticipation of further movement. Finally, you will see how traders estimate the market. With this tool, you will see important supports and resistances. It shows you the entry of big players on the market. The indicator works on all timeframes. You are
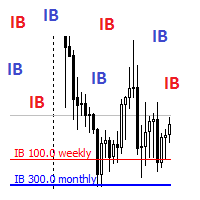
InitialBalance. Universal business tool from professional traders that helps to visualize interest market situations. It previews markets using a price action and sentiment in the market. Tool necessary to understand the market situation and the anticipation of further movement. Finally, you will see how traders estimate the market. Who knows the first steps in the market can estimate the point where the market will stop and reflect! With this tool, you will see important supports and resistance

Bull Bear Powers indicator shows the absolute power of bulls and bears in the market. Both powers are shown simultaneously with red and green colors for bear and bull powers respectively. When red line goes over the green line it means that bears are controlling the market. When green line goes over the red line it means that bulls are controlling the market. The green/red horizontal symbol line at the bottom of the indicators shows which party has more strength. Time Frame: M30 and H1 are recom
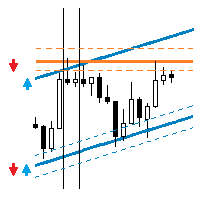
This EA trades support/resistance levels which were placed by a trader (Trend Line from toolbar). The direction of a trade is set graphically by arrows: ↑ - buy; ↓ - sell; - buy or sell in case of crossing support/resistance level. The level is off if inconsistent directions were set, like: ↑↓, ↑, or ↓. If the price is lower than a level it is a resistance level. And opposite is true for support level. There are a few methods available for levels defining, for testing with visualization as
Purpose The indicator is intended for manual multi-currency trading based on the Triple Screen Strategy. It works with any symbols located in the Market Watch window of the MT4: currencies, metals, indexes, etc. The number of instruments can be limited by capacity of the МТ4's parameters. But if desired, you can create several windows with various set of instruments and parameters.
Operation Principle The indicator uses the modified Triple Screen Strategy for determining trend direction in the

This indicator shows an Up trend (Green square) if a fast MA is above a slow MA and Down trend (Red square) if a fast MA is below a slow MA from all Time Frames for each currency pair. Input parameters: From Symb1 to Symb9. - You may change any of this Symbol to any legal currency pair existed on your platform. Period_Fast = 5; Method_Fast = MODE_EMA; Price_Fast = PRICE_CLOSE; Period_Slow = 21; Method_Slow = MODE_SMA; Price_Slow = PRICE_TYPICAL; Attention: Before using this indicator you have t

The Advanced SovPattern is a multi-currency robot which trades on M30. The Expert Advisor's performance on a real account is shown using the AdvancedSovPatern2025 signal.
Trade Strategy: This EA tests and reveals market changes. Then it uses mathematical analysis to discover patterns and adjusts to changing trading conditions. It allows this EA to work without time restrictions regardless any changes of the market. The EA is based on our study of regular currencies behavior on the market de

Marcus = market customization is 3 in 1 indicator. Universal business tool from professional traders that helps visualizing interesting market situations. Preview markets using price action and sentiment in the market. Three tools necessary to understand the market situation and the anticipation of further movement. Finally, you will see what parquet traders see. With these tools, you will see the important supports and resistances. It shows you the entry of big players on the market. The indica
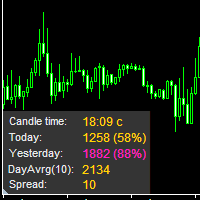
The information panel displays important trading information on the chart. Visual display of the information will help you to make a prompt and precise trading decision. Screenshots depict information which I use in my trading system. But you can add any other desired information. To do this contact me via MQL5 web-site. Displayed information: Time till the end of the current candle and formation of a new one. Time set format: hh:mm, if there is at least one full hour, or mm:ss, if you have les
FREE
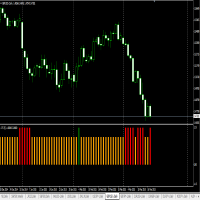
This is an indicator for finding the strongest trend each day, suitable for intraday trading or a swing trading. See the live performance at : https://www.mql5.com/en/signals/93383
How to Use: RED BAR means Bearish Trend for the next candle GREEN BAR means Bullish Trend for the next candle ORANGE BAR means Sideways Trend for the next candle
Example:
If we are using D1 timeframe, see the last BAR, if the bar is RED BAR, open short/sell for today. If we are using H1 timeframe, see the last BAR,
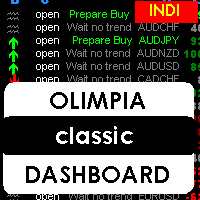
This indicator is a multipairs dashboard which recognizes the best pair setup to open orders with 8 families of currencies. Families of currencies include: AUD, USD, EUR, GBP, CAD, NZD, CHF, JPY; 28 pairs in total. The precise moment to open an order is shown at Column A on the dashboard, you can also setup alerts, e-mails and notification to mobile devices. You can filter alerts by spread value of pairs.
What is the dashboard showing? RED values mean short trends, GREEN values mean long trends

The indicator colors bars displaying prices of overbought and oversold areas on the chart. It will help you to estimate moments when market climate changes and the price has its local extreme values. It can be used both independently and as a good supplement to any channel trading system. And this indicator is easy-to-use in expert advisors due to usage of indicator buffers instead of graphical objects. Settings ExtPeriod = 100 — indicator period; Sensitivity = 80 — indicator sensitivity.

Olimpia Dragged Trends! This dashboard indicator is a visual tool which recognizes dragged trends of 28 pairs in a easy-to-read histogram. You will see a group of squares indicating the sum and average values of trends of the last "...." minutes for each square from L to A in a dragged way. "Dragged Way" means that regardless the hour of the day or opened or closed candle it always shows the present and the pastinformation. You can configure a sequence of numbers with values between 1 minute to

Fibolopes (converted from Envelopes) Indicator is based on the Fibonacci sequence. The input parameter FiboNumPeriod is responsible for the number in the integer sequence (0, 1, 1, 2, 3, 5. 8 13, 34, 55, 89...) The indicator will calculate the Main Yellow dot line and 2 bands as a +/- Deviation to it. This indicator is calculating a ZigZag (Aqua line) which combine with Fibolopes together form a system signals for Open (Z crossing Fibolopes) a new position and Close (Z crossing Fibolopes in oppo
Introduction to Order Risk Management EA ORM EA is specially designed for fast and accurate market order execution to be used with our Price Action and Econometric Trading strategies listed below. ORM EA is fully automatic and ORM EA is also very easy to use. ORM EA is totally free of charge. You can also use this robust order execution feature of this ORM EA for any other your own trading strategy.
Trading Strategy Guide Order Risk Management EA provides the guide for the risk management for y
FREE
Provides the simplicity of binary options but addresses the shortcomings of regular binary options, namely: Poor risk reward ratio, fixed duration trades, poor broker choice, poor indicators/alerts, no hidden (stealth) stop loss/take profit, etc.
Features 1 to 1 risk reward ratio, calculated automatically (configurable) Manual (with alert) or automatic trade entry (on alert conditions) Lot size calculation (money management) - based on % of account to risk or fixed amount Compact interactive on

Pending Orders Grid Complete System opens any combination of Buy Stop, Sell Stop, Buy Limit and Sell Limit pending orders and closes all existing pending orders. You will have a possibility to put a legitimate Open Price for the first position in the grid. Usually it should in the area of Support/Resistance lines. You just need to drop this script on the chart of a desired currency pair.
Input Parameters Before placing all pending orders, the input window is opened allowing you to modify all in

A portfolio night scalper for Canadian dollar instruments: AUDCAD, EURCAD, GBPCAD, CADJPY, CADJPY, CADCHF, USDCAD. Timeframe - M15.
Parameters Orders_Comment - comment to orders opened by the EA. Lot_Size - fixed lot size if Auto_MM = 0. Auto_MM - percent of equity to be used in trading. If Auto_MM = 0, it will use a fixed lot. Magic_Number - unique number of orders (set different values for each trading symbol). Start_Time - the EA's operation start hour (default is 00.00; we do not recommend

The indicator displays on the chart a map, on which markers show the current trading session, as well as shows a text. The indicator provides two types of background display: white and black. The indicator is displayed as the background and does not hinder tracking the current market situation.
Parameters: GMT - the time difference of the terminal and GMT. Background - selection of background - black or white.
FREE

This is an indicator for additional signal filtering. It can be used as an additional filter in a trading system. The indicator does not redraw its data and can be used both in forex trading and with binary options. It has 3 operation modes and flexible sensitivity settings. The indicator uses multiple buffers, therefore it can be easily used in various Expert Advisors.

The indicator is designed for visual determining market directions. It allows to determine the distance from a price and helps in drawing correct conclusions. Perfectly defines flat zones, horizontal intraday trends and trend movements, and an additional setting allows to use the indicator on any instrument. Does not redraw its readings. You get professional trading indicator for a reasonable price.
Settings: Period_FF = 7 - indicator period Sensitivity_FF = 5 - sensitivity in % Wish you all su

The purpose of the indicator is drawing an equidistant channel. It is somewhat different from the traditional model. The choice of control parameters is simple and does not require any special description. Enter the calculation interval in hours and the solution to the problem will appear on the screen. Please note that the time involved in calculation of the channel must be greater than the timeframe it will be displayed on. If the parameters you enter are beyond the allowable limits, you will
This EA represents an interactive panel with adjustable parameters destined for installation and deletion of pending orders (orders grid generator). You can place the panel anywhere on the screen or hide it into a dot clicking on the button in the upper left part of the chart (it will be shown after clicking on it for the second time). Number and step of orders, lot size, vertical shift for limit orders - all these things make your work easier. There are functions for restoring according to pend
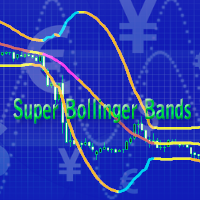
This is a forward-looking indicator for trading on all instruments. An advanced version of Bollinger Bands indicator created by outstanding analyst John Bollinger. One of the main differences of Super Bollinger Bands indicator from its predecessor consists in displaying upper and lower bands behavior on the middle line with some specific colors. Thus, the indicator gives a trader some visual information about trend development at the moment, and not in the past, as majority of other indicators d

BB St Dev BB St Dev is analogous to the Bollinger indicator. Upper and lower parts of the Bollinger channel are calculated by means of iStdDev . iStdDev is a standard indicator of МetaТrader 4. Moving average has a special smoothing algorithm. Settings M - period of Moving average BandsDeviations parameter - channel generation factor. Apart from classic Bollinger Bands, BandsDeviations can possess any value here. Visio parameter If Visio = False , this indicator will coincide with the Bollinger

The Breakout Indicator That Has Been Proven & Tested! Breakout Analyzer uses an advanced algorithm based on high probability price patterns. Each trade is analyzed on the statistics panel to help you evaluate the best breakout setups.
Bonus Strategy 1
Breakout Analyzer with Volume Critical Watch Video: (Click Here)
Bonus Strategy 2
Breakout Analyzer with Strength Meter
Watch Video: (Click Here)
Features Universal compatibility to different trading systems Analyzes statistics of breakout sign

This indicator is designed for M1 time frame and shows 2 lines: Sum of Points when the price goes up divided on Sum of Ticks when the price goes up (Aqua color). Sum of Points when the price goes down divided on Sum of Ticks when the price goes down (Orange color). You will see all major data as a comment in the left upper corner of the chart. Keep in mind that Sum of Points will be greater or equal to Sum of Ticks. Of course, the ATT is calculating all ticks forward only, beginning from the tim

THE [VIZUALIZER] is a MetaTrader (MT4) Script designed to visualize an account history. It will read the account statement and then will visualize the positions on chart in form of rectangles, showing the OpenTime, OpenPrice, CloseTime and ClosePrice. Generally, it has been developed to analyze the trading history, to observe how risky the particular positions were, allowing you to analyze the trading strategy from the account statement. It is working with standard MS Excel CSV files It is visua
The B150 model is a fully revised version of the Historical Memory indicator with an improved search algorithm. It also features a graphical interface what makes working with this tool quick and convenient. Indicator-forecaster. Very useful as an assistant, acts as a key point to forecast the future price movement. The forecast is made using the method of searching the most similar part in the history (patter). The indicator is drawn as a line that shows the result of change of the close price o
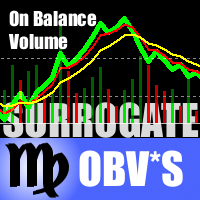
This is a special edition of the On-Balance Volume indicator based on pseudo-real volumes emulated from tick volumes. It calculates a near to real estimation of trade volumes distribution for Forex instruments (where only tick volumes are available) and then applies conventional OBV formula to them. Volumes are calculated by the same algorithm that's used in the indicator TrueVolumeSurrogate . The indicator itself is not required but can be used for reference.
Parameters MAfast - fast moving av
Advanced ADX indicator that allows operating on many timeframes simultaneously! Unique indicator with the ability to display ADX charts not only on the current timeframe, but also on higher ones. The example attached shows how it is possible to see 3 ADX chart on M5, M15 and M30 timeframes respectively. This functionality allows to significantly improve the accuracy of determining the trend. The Timeframe Delta parameter specifies how much the indicator’s timeframe should be different from the t
Pipfinite creates unique, high quality and affordable trading tools. Our tools may or may not work for you, so we strongly suggest to try the Demo Version for MT4 first. Please test the indicator prior to purchasing to determine if it works for you. We want your good reviews, so hurry up and test it for free...we hope you will find it useful.
Combo Energy Beam with Swing Control Strategy: Confirm swing pullback signals Watch Video: (Click Here) Energy Beam with Trend Laser Strategy: Confirm Tre

A portfolio night scalper for yen instruments: AUDJPY, EURJPY, GBPJPY, SGDJPY, CADJPY, USDJPY. Timeframe - M15.
Parameters Orders_Comment - comment to orders opened by the EA. Lot_Size - fixed lot size if Auto_MM = 0. Auto_MM - percent of equity to be used in trading. If Auto_MM = 0, it will use a fixed lot. Magic_Number - unique number of orders (set different values for each trading symbol). Start_Time - the EA's operation start hour (default is 00.00; we do not recommend changing this value

Description Shows whether market is trending or not, to what extent, which direction, and if the trend is increasing. The indicator is very useful for trend following strategies. The indicator can also alert when the market transitions from being flat to trending, which can serve as a great entry point. The alert is controllable directly from the chart, with an on-chart tick box to enable the alert. Also includes bonus indicators of current spread and ask/bid prices in large text, color coded as
New indicator Impostol is based on the relative strength index (RSI) and trend indicator ADX. With it, you can identify a trend for your trade. Its signals are easy ti interpret, because it shows the recommended entries using up and down arrows. The indicator has a minimum of settings and is easy to use.
Impostol Expert for MetaTrader 4 — HERE
Main features Uses arrows to show market entry points. The indicator is not redrawing. Recommended timeframe is H1 and higher (lower timeframes can sh

The indicator for presenting current spread in real time. It is a very simple still useful indicator for manual trading and market analysis. The indicator shows current spread (in 4-digit format) for the selected instrument. You can specify the place on the chart where indicator shall print the output as well as output color. Please contact the author if any changes are required.

Japanese Candlesticks Monitor scans Japanese candlesticks. It shows a vertical line and a name of a probable candlestick pattern. The indicator is constantly updated, and new patterns are added. Your feedback is most welcome. I have just started working on the indicator, and your opinions are highly appreciated . The indicator does not work on history data . If the indicator has not been launched at a candle opening, that candle is not considered. This means that the indicator works in real time

This indicator is a plug-in for Controladora Expert Adviser , which allows you to set a specific area, and the Controladora will open a buy or a sell, if the candle closes inside this area. To make it work in a chart with the Controladora installed, add the Act Inside indicator, then add a rectangle shape into the chart and re-size it to cover only the area where the close of a candle should be in order to send the buy or sell order. Rename the rectangle as AI and in it's description write buy,
FREE

This indicator is based on the classical indicators: RSI (Relative Strength Index) and PSAR (Parabolic Stop and Reverse) and will be helpful for those who love and know how to use not a visual but digital representation of the indicators. The indicator shows values from 9 currency pairs. You will be able to change the main input parameters for RSI: OverboughtLevel = 70; OversoldLevel = 30; Period = 14; Price = PRICE_CLOSE; and PSAR: step = 0.02; maximum = 0.2; Also you may change Symb1 - Symb9 t
Volume Gives Depth To Price Action! Volume Critical can accurately locate the cheapest areas to place trades. Enter reversals as early as possible to get the best Risk Reward setups!
Features Aggressive algorithm that anticipates reversals Volume Classifications Gray Histograms - Normal Volume, average market activity Orange Histogram - Trending Volume, increased market activity Pink Histograms - Overbought Volume, we can wait for further confirmation to sell Blue Histograms - Oversold Conditio

AD Trend line draws trend lines on the basis of A/D indicator (Accumulation/Distribution). When A/D indicator breaks a trend line, the probability of the trend reversal is very high. This is a multitimeframe indicator which can display values from higher timeframes. Parameters Time-frame — Select a timeframe; zero is the current timeframe of the chart; Trend Line — Display lines on the chart; Apply to — Apply lines to close the candle's highest/lowest value; Width line — Width of the line; Style
FREE

Dedicated to grid trading fans. For a long period I was trading using Manual Trader by Ramil Minniakmetov. I liked this program but soon I came up with an idea to improve the program by making the grid vivid and adding something mine. 1) I taught the program to take swaps and commission into account. 2) If the market allows, the program trails a gain by moving Profit. 3) The program spends a part of the gain partially killing the lower order and moving to a smaller lot, preventing it from going
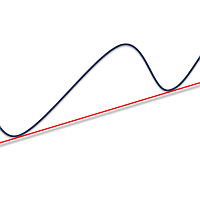
Simply drop the indicator to the graph and support and resistance levels will be shown automatically! The indicator for automatic drawing of support and resistance levels based on THREE points. Identified points are marked on the chart Indicator shows break through price for both bullish and bearish trends (if found) You can specify on how many bars the indicator shall look in order to identify supporting points. In addition, you can select on which time frame the indicator will work. That means

The indicator for automatic drawing of Fibonacci-based Moving Averages on the chart. It supports up to eight lines at a time. The user can configure the period of each line. The indicator also provides options to configure color and style of every line. In addition, it is possible to show indicator only on specific time frames. Please contact the author for providing additional levels or if you have any other suggestions.

VR MultiPrice Analysis is an indicator that determines the strength of a currency in a currency pair. Let's take the EUR / USD pair as an example. How can we determine which currency is currently weak and which is strong? The easiest and most reliable way is to compare the EUR against other currencies, excluding the USD. The variants of power distribution: The EUR is rising against other currencies - this is a sign that the currency has become more attractive to traders and investors, or good ne

This is a plug-in indicator for Control-adora that eliminates all the listed labels when a specific price is reached. Just add the indicator to the same chart where Control-adora runs and place a price label named Killer at the level where you want to trigger the label deletion. The trigger will be activated when the price goes beyond the Killer label. In its properties, set the labels you wish to delete separated with comma, replace the default values with the list of your desired labels to rem
FREE

The Currency Barometer indicator is a unique tool that measures the strength of two currencies represented in the pair and compares the difference between them. The result is shown as a histogram where you can simply identify which currency is the strongest. This indicator is designed to measure the strengths and weaknesses of eight major currencies (USD, EUR, GBP, CHF, CAD, JPY, AUD, and NZD) and works on 28 currency pairs. The indicator uses the CI method (Commodity Channel Index) to calc
The Volume Spread Analysis indicator is based on the original Volume Spread Analysis method. It was designed for quick and easy recognition of VSA patterns. Even though this indicator looks very simple, it is the most sophisticated tool we've ever made. It is a really powerful analytical tool that generates very reliable trading signals. Because it is very user-friendly and understandable, it is suitable for every type of trader, regardless of his experience.
What is VSA? VSA - Volume Spre

The Volume Weighted ATR indicator is a helpful tool for measuring market activity. It is based on the idea of the Volume-Weighted ATR. Combining these two elements helps identify potential turning points or breakout opportunities. The indicator for the classification of the activity of the market uses the moving average and its multiples. Accordingly, where the VWATR bar is located (relative to the moving average), it is labelled as ultra-low, low, average, high, very high or ultra high. Th
FREE

Overbought describes a period of time where there has been a significant and consistent upward move in price over a period of time without much pullback. Oversold describes a period of time where there has been a significant and consistent downward move in price over a period of time without much pullback. This indicator will show the Overbought conditions (Green Bars) and Oversold conditions (Red Bars). The value of Green/Red Bars represents a power of the price movement. Input parameters numBa

Pipfinite creates unique, high quality and affordable trading tools. Our tools may or may not work for you, so we strongly suggest to try the Demo Version for MT4 first. Please test the indicator prior to purchasing to determine if it works for you. We want your good reviews, so hurry up and test it for free...we hope you will find it useful.
Combo Razor Scalper with Trend Laser Strategy: Scalp in the direction of the trend Watch Video: (Click Here)
Features Scalping indicator using a confirme
Did You Have A Profitable Trade But Suddenly Reversed? Exiting a trade is equally important as entering! Exit Scope helps maximize your current trade profit and avoid turning winning trades to losers.
Attention Exit Signals are NOT to be used in entering a trade! Exit means closing your trades to avoid correction/reversal which can wipe out existing profit or haunt break-even orders. Please watch presentation (Click Here)
Features Generates instant exit signals based on price action, volatili
When the price is moving Up/Down rapidly majority of brokers are increasing the Spread. This indicator will show the Spread for 9 currency pairs by your choice ( Yellow digits ) - you allow to change all input parameters, including changing the name of the currency pairs. This indicator also shows classical indicator RSI (Relative Strength Index) for defined currency pairs and will be helpful for those who love and know how to use not a visual but digital representation of the indicator.
The MetaTrader Market offers a convenient and secure venue to buy applications for the MetaTrader platform. Download free demo versions of Expert Advisors and indicators right from your terminal for testing in the Strategy Tester.
Test applications in different modes to monitor the performance and make a payment for the product you want using the MQL5.community Payment System.

You are missing trading opportunities:
- Free trading apps
- Over 8,000 signals for copying
- Economic news for exploring financial markets
Registration
Log in
You agree to website policy and terms of use
If you do not have an account, please register