 MetaTrader 5
 エキスパート
 インディケータ
 ライブラリ
ライブラリ
 ユーティリティ
 ウィジェット
 ルール
ルール
YouTubeにあるマーケットチュートリアルビデオをご覧ください
ロボットや指標を購入する
仮想ホスティングで
EAを実行
EAを実行
ロボットや指標を購入前にテストする
マーケットで収入を得る
販売のためにプロダクトをプレゼンテーションする方法
MetaTrader 4のための新しいエキスパートアドバイザーとインディケータ - 353
 自動売買ロボットは市場取引を自動的に実行しますが、インジケータを使用すると、相場をより適切に分析し、価格行動を予測できます。
これらのアプリケーションを使用すると、より多くの機会を獲得しながら、より多くの情報に基づいた方法でMetaTrader4で取引を実行できるようになります。
自動売買ロボットは市場取引を自動的に実行しますが、インジケータを使用すると、相場をより適切に分析し、価格行動を予測できます。
これらのアプリケーションを使用すると、より多くの機会を獲得しながら、より多くの情報に基づいた方法でMetaTrader4で取引を実行できるようになります。 
The indicator has been developed as a trading system component. It has proven to be an efficient technical tool when following a trend. The indicator shows the most suitable market entry points. It can be especially useful to those who add to positions after corrections in the trend direction. When a signal appears, the indicator generates an alert.
The settings contain the depth of the indicator display history and ability to disable alerts. The signal is generated upon closing of the current

This indicator is customized for binary option trading like M1 timeframe or turbo option trading. The way a binary option works is from the traders perspective is that you choose whether or not a certain underlying asset (a stock, commodity, currency etc.) is going to go up or down in a certain amount of time. You essentially bet money on this prediction. You are shown how much money up front you will earn if your prediction is correct. If your prediction is wrong, you lose your bet and the mone
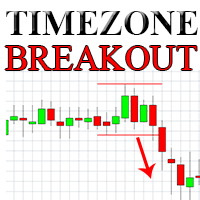
Simply breakout EA on highest and lowest point of choosen period of time. EA works on H1. This is not full EA. You need to set your strategy and know profitability. I am using it for London breakout 08:00 to 09:00 (set for UTG+1, if you want to used it too, change time to fit your timezone), picture of setting are below.
Parameters Start of timezone - When your zone start (xx:xx) - minutes must be 00 End of timezone - When your zone end (xx:xx) - minutes must be 00 Max width of zone - Max allow

Robo Grid FX ROBO GRIDFX はグリッドエキスパートアドバイザーです。 活発な市場と速い通貨ペアでの日中取引用に設計されています。これは、クローズドアベレージングシステムを備えたグリッドアドバイザーです。閉ループ平均化システムは、高速で積極的な通貨ペアで預金がドローダウンした場合の安定したブレークイーブン戦略です。 Expert Advisorは、保留中の注文のグリッドを両方向に配置し、負のポジションが表示された場合、価格変動が40〜60ポイントのコリドーに発生したときにそれをロックします。そして、損益分岐点まで(露出したグリッドを両方向に削除せずに)グリッド内に表示を開始します。そして、引用がチャネルを壊す方向(上または下)は関係ありません。エキスパートアドバイザーは、25〜40ポイントを超える市場ポジションのドローダウンをなくすことはできません。StopLossとTakeProfitは、状況と見積もりの方向または逆転に応じて絶えず変更されます。強いトレンドの動きで、ロボットは単にトレンドを追跡します。 すべての計算は、エキスパートのコア内の所定のアルゴリズム

Pyramid MA ピラミッドMA- アドバイザーの特性:移動平均(MA)インジケーターを使用します。トレンドが逆転したときに注文のグリッドを変更する。平均ポジションに対するメイントレーディンググリッドの注文量の増加の指数。保留中の注文BUYSTOPおよびSELLSTOPに取り組みます。オープントレードのバランスを制御し、損益分岐点に到達させる損失平均化システムを使用します。オープンおよび完了した取引に関する適切な通知。 PYRAMID MA Expert Advisorに基づいて、独自の取引戦略を簡単に作成できます。
アドバイザ設定の説明: koef_grid = 0.5-多くのグリッドオーダーの乗算係数 インジケーター設定: tf_grid = 0-開始注文時にインジケーター信号を受信するためのチャート期間。チャートの期間の1つにすることができます。 0は現在のチャートの期間を意味します。 1分。 5〜5分。 15〜15分。 30〜30分。 60-1時間240-4時間。 14 40-1日。 10080-1週間。 43200-1か月。 tf_lock = 60-注文をロックす

Boom トレーディングロボットは指標分析に基づいています。取引の決定は移動平均の読み取りに基づいて行われ、インジケーターは外部変数を使用して構成できます。 TF = 0-チャートの稼働期間の選択。チャートの期間の1つにすることができます。 0は現在のチャートの期間を意味します。 1分。 5〜5分。 15〜15分。 30〜30分。 60-1時間240-4時間。 14 40-1日。 10080-1週間。 43,200-1か月。 shift = 0-インジケーターバッファーから受け取った値のインデックス(現在のバーに対して指定された期間だけシフトバック)。 period_fast = 5-高速移動平均インジケーターの期間。 period_slow = 12-遅い移動平均インジケーターの期間。 mehod = 0-平均化方法。移動平均メソッドの任意の値にすることができます。 0-(SMA)単純移動平均。 1-(EMA)指数移動平均。 SMMA 2-(SMMA)平滑化移動平均。 LWMA 3-(LWMA)線形加重移動平均。 適用= 0-適用価格。価格定数のいずれかにすることができます。 0

Forex Jumper 外国為替ジャンパー -EURJPY通貨ペアで動作するように設計されたエキスパートアドバイザー。ローソク足パターンの分析は、取引決定を行うためのシグナルです。 EAは、取引時に保留中の注文BUYSTOPとSELLSTOPを使用します。 設定: ロット= 0-未決済注文の量の手動設定 リスク= 13-MMのリスクのパーセンテージ、ロット= 0で機能 MagicNumber = 208-アドバイザーの注文と位置の識別子、マジックナンバー TP = 20-市場に一方向のオープンポジションが1つある場合の、ポイント単位の仮想レベルの利益 TP2 = 20-市場に複数のオープンな一方向のポジションがある場合のポイント単位の仮想レベルの利益 StopLoss = 500-ポイント単位の損失レベル。値が0(ゼロ)の場合、レベルは設定されません。 count_BUY = 1-市場での買い注文の同時存在数の制限。0では注文は行われません。 count_SELL = 1-市場での売り注文の同時存在数を制限します。0では注文は行われません。 すべり= 3-すべりレベル(ポイント

Hammering ハンマー は、任意の通貨ペアで機能するように設計された自動取引システムです。取引時には、多通貨モードと単通貨モードが使用されます。 取引の決定を行うために、EAは スロープ方向ライン インジケーターからのシグナルを使用します。 設定の説明。 Profit_Percent_AccountEquity = 0.4; -利用可能な資金のパーセンテージとしての利益のレベル Fix_AccountEquity = 0; -強制レベルの無料資金 FIX_PROFIT = 1000; -強制利益レベル 期間= 55; -指標期間。 FilterNumber = 2; -インジケーターフィルター。 ma_method = 3; -インジケーターの平均化方法。 apply_price = 0;インジケーターの使用価格です。 TF = 15; -インジケーターのチャート期間。 ペア= "EURUSD、GBPUSD、USDCHF、USDJPY"; -多通貨取引用の通貨ペアのセット。 MagicNumber = 6; -アドバイザーの注文ID TrailingStart = 9.5;
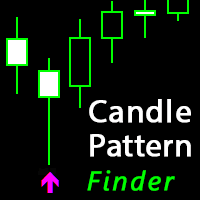
The indicator finds candlestick patterns based on Gregory L.' Morris "Candlestick Charting Explained: Timeless Techniques for Trading Stocks and Futures". If a pattern is detected, the indicator displays a message at a bar closure. If you trade using the MetaTrader 5 terminal, then you can download the full analogue of the " Candle Pattern Finder for MT5 " indicator It recognizes the following patterns: Bullish/Bearish (possible settings in brackets) : Hammer / Shooting Star (with or without con
The product combines a manual trade panel with the ability to perform actions automatically in a highly configurable way. Actions include capturing indicator values and then based on those values raising alerts, open/close or partially close trades, scale-in, setting up pending orders, adjusting stop loss, take profit and more. On-chart controls can be configured, such as tick boxes and buttons, so can be fully interactive. The EA also handles money management, news events, hidden stop loss, tak

The "Market Profile" indicator displays the profiles and volumes of periods – weekly, daily, session (8-hour), 4-hour, hour, summary. The VAH/VAL price area is automatically highlighted by a dotted line for each profile (except for the summary). The indicator includes chroma Delta, which colors the profile areas. The areas of prevailing Buys is colored in green, that of Sells - in red. The intensity histogram features blue/red respectively. In the filter mode, the indicator displays the volume a

This is a very simple script that will show you the following info about any symbol in your chart: Point, digits, spread, stop level, lot size, tick value, tick size, swap long, swap short, starting date (if future contract), expiration date (if future contract), trade allowed, minimum lot size, lot step, maximum lot size, swap type, profit calculation mode, margin calculation mode, initial margin, margin maintenance, margin when hedged, margin required, freeze level. All this info is extracted
FREE
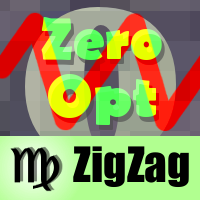
This is yet another non-parametric ZigZag. Its every upward edge continues until next bar's high is formed below highest low of its bars, and every downward edge continues until next bar's low is formed above lowest high of its bars. In addition to zigzag itself (shown in orange color), the indicator shows signal marks on those bars where zigzag direction changes. The blue arrow up denotes that new bullish edge is started (but not yet completed), whereas the red arrow down denotes that new beari
FREE
TrafficLight provides simple trading buy and sell signals. The indicator shows reversal points and ambiguous points on current chart using cross rates. Only completed bars are counted. Buys are denoted by green arrows, sells - by red arrows. Yellow diamonds denote bifurcation points. Distance to the arrows relatively to the current price is a measure of volatility on the cross rates, and can be used as future price movement estimate for the work symbol. Due to the fact that indicator is calculat
Most of brokers make slippage for your orders (stop orders or market orders). When you make limit orders (Buy or Sell), they don't make slippage for you. Because it is for your advantage. This EA will resolve limit slippage problem for you with any brokers. Slippage Problem Example: The price now is 1.31450, you put sell limit at 1.31500. If the price jumps to 1.31550. The Broker will execute your sell limit at 1.31500 NOT 1.31550. If you put buy stop, the Broker will execute it at 1.31550 (or m
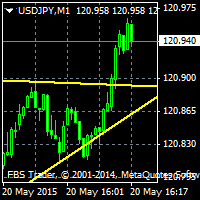
This Indicator will draw support and resistance (SR) in chart and give alert whenever there is a Support or Resistance Breakout. It has a variable to control SR line length (default 100) 500 is recommended. Support and resistance (SR) The concepts of support and resistance are undoubtedly two of the most highly discussed attributes of technical analysis and they are often regarded as a subject that is complex by those who are just learning to trade or even the expert traders. As we all know that
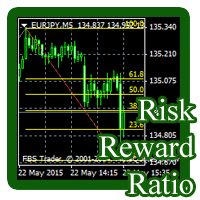
This indicator draws Fibonacci level automatically from higher high to lower low or from lower low to higher high. With adjustable Fibonacci range and has an alert function.
How to use Fibonacci Risk Reward Ration (R3) into trading strategy Forex traders use Fibonacci-R3 to pinpoint where to place orders for market entry, for taking profits and for stop-loss orders. Fibonacci levels are commonly used in forex trading to identify and trade off of support and resistance levels. Fibonacci retracem
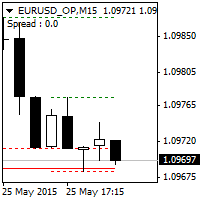
This indicator automatically draws Support and Resistance lines based on High and Low Candle at every timeframe. Support and resistance have a recurring nature as a trader goes through the process of building a strategy. Because of its importance, it is often reasonable for a trader to build object patterns for incorporating these prices into a strategy. When strong support and resistance levels are found, this can enable traders to effectively plot their approach, manage trades, and adjust risk

Fibox4 indicator displays Fibonacci Retracement, Pivot Point, and many other useful information for analysis. The interface is improved by providing clickable button on chart to switch on/off H4, daily, weekly, monthly swing retracement level.
In addition, fibox4 displays Current Daily Range and Weekly Range.
This version can be used for all pairs..
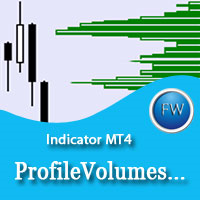
The ProfileVolumesMarket indicator calculates tick volume on each price level in a selected range. Volume is vital when determining strength and therefore significance of price levels. The calculation range is set by a trader by means of moving two vertical lines. Thus the indicator allows to track important levels on different steps of a symbol price formation. A histogram of volume profile can be displayed on the chart (or removed from the chart) if you press "ON" ("OFF") button. When you chan
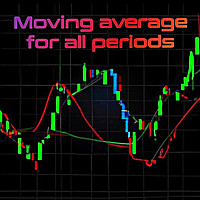
The indicator displays the moving average of all periods on one chart. It shows the MA of a one step lower timeframe and all the MAs equal to and higher than it.
Parameters Period moving average - Moving Average period (default is 34); Used to calculate price - price used for the MA calculation (default is the average price = (high+low)/2); The averaging method - default is linear-weighted; Moving average shift - MA shift (default is 0). Just enter the MA calculation period and its parameters,
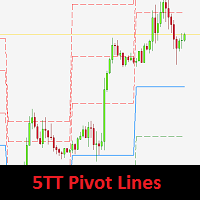
5TT Pivot Lines is a visual display of pivot lines. These are primarily support and resistance points with the 'Blue' Pivot Point. Pivot points are useful for determining key levels for entry or exits (setting targets and stop loss levels). Having these support & resistance lines visually displayed on the chart is very useful for intraday traders. 5TT Pivot Lines come with some user-friendly settings to decide if to display the lines or connectors on the chart Settings CandlesBack: This gives th

The indicator is created for professional trading by Fibonacci levels. AutoFiboLevels plots Fibonacci retracement and extension levels on impulse and corrective wave. The indicator unambiguously interprets a market situation. Points of extremum for level plotting are calculated using fractal analysis. A trader can independently set retracement and extension levels and calculation time frame adjusting the indicator for various strategies.
Parameters: WorkTF - time frame for indicator calculation
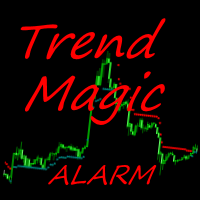
The Trend Magic Alarm shows the direction of a trend and indicates when it changes with a sound, popup window, push or email notice. Blue dots in the chart indicate an uptrend, red dots indicate a downtrend. Levels of former highs + lows give orientation in a chart. Trend Magic Alarm can draw these levels as lines in the chart, see inputs.
Input Parameters Counter : number of bars used for calculation PowerSet : shows how near to the bars the trigger dots are placed DotSize : size of the shown
How To Determine If The Market is Strong Or Weak?
Strength Meter uses an Adaptive Algorithm That Detect Price Action Strength In 4 Important Levels! This powerful filter gives you the ability to determine setups with the best probability.
Features Universal compatibility to different trading systems Advance analysis categorized in 4 levels Level 1 (Weak) - Indicates us to WAIT. This will help avoid false moves Weak Bullish - Early signs bullish pressure Weak Bearish - Early signs bearish press

TraderTool is a tool/panel that will help any trader to perform trades quickly and easily. The product has been developed with user friendliness and ease of use in mind. It has the ability to manage multiple types of orders, either placed by an Expert Advisor, or manually. It also allows you to place orders in a single click. You can add stop loss and take profit, initiate a trailing stop or start break even operation, and all these with the simple panel. With the advanced panel (you can call it
FREE
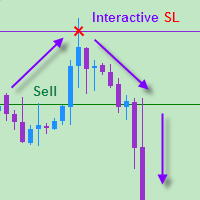
The EA allows a trader to place stop loss invisible for brokers and thereby prevent false breakthroughs and unwanted stop loss triggering. When you use standard stop loss, the price may break through stop loss before moving to the direction of an open order and therefore the orders is closed. Interactive Stop Loss removes standard stop loss of the open order and adds a horizontal line instead. After this it maintains the order until the line is crossed by the price. And then it finally closes th
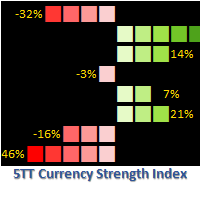
Want to know if to go long or short on any currency pair? 5TT Currency Strength Index is the answer! 5TT Currency Strength Index is a unique indicator for determining the short-term strength of any currency. Each currency strength is determined by an index of the currency with the strength of 7 other major currencies. The indicator is constantly monitoring price action across 28 currency pairs and 56 combinations; taking the following into consideration Price volatility. Short-term price range.
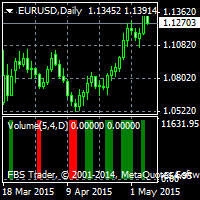
Alpha Trend Spotter (ATS) Volume Break Out This is an indicator that combines Volume breakout/breakdown and Moving Average Breakout/breakdown. It is able to predict further price changes. It is not repainted, not recalculated. All lines are shown at the open of a new candlestick, never winking or vanishing in the current candle. These lines are appeared at the beginning of the current candle. Suitable for M5 to D1 Timeframe. How to Use: If Green line appears, that shows the "oversold" area, so t

Simply drop the indicator on a chart, and you will always know when candlesticks form one of the Price Action patterns! The indicator automatically analyzes recently closed candles, and notifies if they form any of the Price Action patterns. The following classical patterns are analyzed: Pin bar Outer bar Pivot Point Reversal Double base Closing price reversal Force bar Mirror bars Move-congestion-move For each pattern, the indicator also shows trade direction in accordance with the classical Pr

The indicator determines Dragon pattern. It is based on the zigzag. There is buffer 0 which has no color located in the Colors tab. You will see the zigzag if you set it to some color. The indicator draws an up arrow when it detects a pattern which assumes further upward movement of the indicator. Similarly, the indicator draws a down arrow when it detects a pattern which assumes further downward movement of the indicator. Parameters: Alerts - show alert when an arrow appears. Push - send a pus
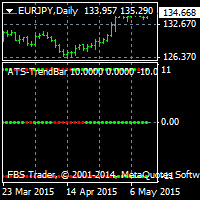
This indicator searches for the strongest trend and works on any timeframe. D1 timeframe is recomended. The product features three lines showing fast, medium and slow bars. If red bars appear at each of the three lines simultaneously, there is a strong bearish trend.
If green bars appear at each of the three lines simultaneously, there is a strong bullish trend. The indicator does not repaint and can be combined with other indicators. It is also suitable for binary option trading.
The Expert Advisor is based on simple mathematics. The EA places two opposite-directed orders. Wherever the price goes, one order will always have a positive result, the second one will have negative. If we average it, then on the return movement of the price (only a few spreads) the averaged orders are closed and there is only profitable order left! The EA trades through its profit. Of course, the averaging positions also add profit due to MinProfit , especially if you use rebate programs to re

The Monday EA trades on Mondays depending on price movement on Fridays. Its aim is to take 10-20 points of profit and leave the market. This strategy works from March 2014. Currency pairs are EUR/USD and GBP/USD. For GBP / USD trading on the CCI indicator is recommended not to use Time frame is daily D1 Settings: Sig_Open1 = true; - if true, the EA trades on Mondays StartTime = "00:00"; time to start trading (applies only to "Sig_Open1")
Sig_Open2 = true; - enable only on EUR/USD (works only on
FREE
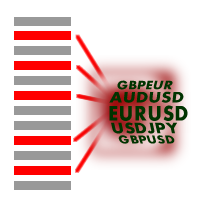
This script is to be used with the Market Patroller indicator as a constructor for a specialized list of symbols based in all the available symbols listed in your MT4's Market Watch window. You can reduce the list depending upon several considerations: List only some symbols that have some instrument, for example, if your broker have 5 EUR pairs (EURXXX or XXXEUR). Exclude some symbols, for example, if you do not want to trade today GBP related pairs, this will avoid any GBPXXX or XXXGBP symbol
FREE

This indicator is designed for H1 and H4 timeframes (TF) only. No input parameters because it is tuned to these two TF. It draws two step-like lines: a main Silver line and a signal Red line. These two lines are calculated so that to enhance the filtration of the market noise. Buy when the main line goes above the signal line. Sell when the main line goes below the signal line.

This indicator works on every currency pairs and time frames (TF). One input parameter: nPeriod - number of bars for histogram calculation. I recommend to optimize nPeriod value for each TF. If Green histogram poles are crossing the zero line from below then Long position may be opened. If Red histogram poles are crossing the zero line from above then Long position may be opened.

This is a well-known ZigZag indicator. But it differs by the fact that its plot is based on values of the middle line which is set by a user. It can display Andrews’ Pitchfork and standard or Bobokus Fibo levels. NO REPAINTING.
Parameters Period МА — middle line period. Default value is 34. Minimum value is 4. Maximum value is set at your discretion. Used to calculate price - base price to calculate the middle line. The averaging method - method of smoothing the middle line. Turning pitchfork —
FREE

The main aim of this indicator lies in determining entry and exit points, that is why the ExactArrow indicator does not draw nothing but arrows which show entry and exit points. In spite of apparent simplicity of the indicator, it has complicated analytic algorithms which determine entry and exit points. The indicator generates exact and timely entry and exit signals which appear on the current candle. The indicator generates an average of 1-2 candles before its analogues do. The indicator is ve

The indicator generates early signals basing on ADX reading data combined with elements of price patterns. Works on all symbols and timeframes. The indicator does not redraw its signals. You see the same things on history and in real time. For better visual perception signals are displayed as arrows (in order not to overload the chart).
Features Easy to use. Filter configuration only requires selection of sensitivity in the " Sensitivity of the indicator " input.
Signals can be filtered using
Supplement for Alpha Trend Spotter (ATS) Indicator: https://www.mql5.com/en/market/product/8590 This indicator acts by price action. Use it when ATS shows clear Bullish or Bearish Trend for finding the strongest trend each day. Suitable for timeframes M5, H1, H4 and D1. Suitable for Binary Option 5 minutes signal. How to Use: RED Arrow means Sell
GREEN Arrow means Buy

This is a must have tool for a serious trader. It saves your precious time spent for opening/closing trades, creating pending trades and modifying your TP/SL in bulk according to either pips or price. If you need to quickly open several pending orders (Buy Stop, Sell Stop) at a certain distance from each other, this script will do all the routine for you! The first time you use this handy tool, you will realize it has already paid for itself. Instructions: Drag and drop this script onto a chart.
Pending Orders Grid Complete System opens any combination of Buy Stop, Sell Stop, Buy Limit and Sell Limit pending orders and closes all existing pending orders. You will be able to Drag-and-Drop the Script on the chart and it will pick up the start price for the first position in the grid from the "Drop" point. Usually it should be in the area of Support/Resistance lines.
Input Parameters Before placing all pending orders, the input window is opened allowing you to modify all input parameters:

StarDust searches for divergences in the values of several indicators considering them as signs of flat and enters the market if a relatively steady trend is detected. The Expert Advisor trades "basic" symbols with a low spread. The best results are achieved on М15. The EA automatically adjusts to 4 and 5-digit quote flows.
Settings Comment_to_orders – comment to a placed order. The field can be left blank if no comment is required. MM – enable money management with automatic setting of a worki

This indicator automatically builds an alternative set of resistance and support lines based on areas where price are concentrated (instead of extremum points). The algorithm utilizes Linear Hough Transform ( Wikipedia ). New lines are used for trading in the similar way as in the classical approach, that is they indicate points for possible reversal or breakthrough in the future price actions. Yet their main advantage is that they cover most populated and consistent price regions, discovering a
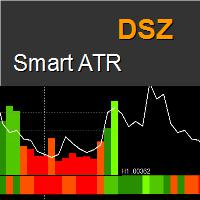
DSZ Smart ATR indicator displays the current and future values of the True Range . Indicator analyzes volatility statistically and create Average True Range distribution over day. Unique future is that time frame of indicator can be set freely from main window allowing to have different perspective. Bars are red if values are below average and green when above.
Benefits Gives true value of ATR filtered from data from non regular trading time. Indicates significant candles when they exceed expec
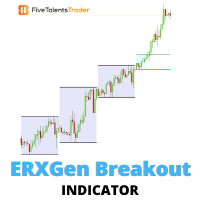
Without volatility, trading the financial market is close to impossible. Profit is made ONLY when the price is moving. The ERXGen (Early Riser Next Generation) system is a short-term trading technique built around the phenomenon that there are certain times during a trading day when the price volatility has the tendency to be high. In essence, ERXGen is based on the very popular London Open Breakout strategy, although with bespoke tried and tested rules that increase consistency and profitabilit

"Nice Forex Pro" is particularly effective for the EUR/USD currency pair, which is one of the most popular and liquid pairs in the Forex market. The EA can be optimized for this pair due to several reasons: Why "Nice Forex Pro" is Best for EUR/USD : High Liquidity : The EUR/USD pair is the most traded currency pair in the world, which means it offers high liquidity. This results in tighter spreads and less slippage, making it ideal for automated trading systems like Nice Forex Pro , which rely
DeMarker (DeM) indicator is another member of the Oscillator family of technical indicators. Traders use the index to determine overbought and oversold conditions, assess risk levels, and time when price exhaustion is imminent. This indicator shows DeMarker data from 9 currency pairs of your choice for all 9 timeframes. If a digital value of DeM is less or equal to DnLevel = 0.3 (or whatever number you decided to put), Green square appears. This is potentially an oversold condition and may be a
The Average Directional Index (ADX), Minus Directional Indicator (-DI) and Plus Directional Indicator (+DI) represent a group of directional movement indicators that form a trading system. This indicator shows ADX data from 9 currency pairs by your choice for all 9 Time Frames. Input parameters From Symb1 to Symb9 - you may change any of this Symbol to any legal currency pair existed on your platform. MainLine = false; - if TRUE then the ADX measures trend strength without regard to trend direct

Multi Timeframe Indicator includes a lot of functions and can be considered as a universal helper for a trader. It's main objective is to display up to 10 indicators at a time using just one small brick per each of them. These indicators involve Awesome Oscillator, CCI, DeMarker, MACD, RSI, RVI, Stochastic, Larry Williams' Percent Range, Bulls Power and Bears Power. An important function of the indicator is an ability to monitor signals from different timeframes. You can choose different combina
FREE
This is a multi timeframe version of the Supply and Demand indicator . It allows you to analyze a chart using the law of supply and demand on three different timeframes at a time. You will see zones of sales and purchases and determine the most profitable points to open positions. The indicator is based on the principle of market fractality. Supply and demand zones show places where a strong buyer or seller has made the price reverse and change its direction. The indicator has several types of
FREE

Trend Stop Introduction Trend Stop is a simple yet powerful trend-following and stop-placement tool for MetaTrader 4.
It calculates the highest high or lowest low of the last N periods and plots a dynamic line that reacts instantly to trend changes. The result is a clean, reliable trend filter and a practical guide for placing optimal stop levels — without unnecessary noise or lag. Whether you’re a trend trader, swing trader, or scalper, Trend Stop helps you stay on the right side of the marke
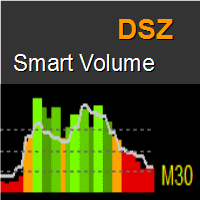
DSZ Smart Volume indicator displays the current and future values of the volume. Every instrument has its own personality which comes from events like market openings, lunch times, news releases and night. DSZ Smart Volume simply analyzes volume statistically to create volume distribution over day. Volume bars are red if values are below average and green when above. The line represents volume distribution over a day. Colored band in the bottom represents volume distribution.
Interpretation Red
The Expert Advisor forms a virtual representation of Renko chart (no indicators used) and then trades on predefined formations of Renko boxes. An order is opened when a predefined number ( SignalSize ) of unidirectional Renko bars are formed after reversal. The EA advantages: No more than one order on a symbol is opened in the market; No martingale, no drawdown, no averaging; Optional stop loss with trailing; Optional management of lot size according to deposit exposure or risk of losses with sp

メイン チャートのヒストグラムとテーブル、通貨トレンドの変化のチャート、および追加のチャート ウィンドウの分析ブロックの形で、通貨のトレンドと強さを視覚的に示します。 8 つの主要通貨 (EUR、USD、GBP、JPY、AUD、CAD、CHF、NZD) から形成された 28 の通貨ペアを分析します。
インジケーターの機能 通貨とシンボルのトレンドの方向と強さを判断し、これに基づいて多色のヒストグラム、表を作成し、デジタル値とグラフを通知します 通貨の相対位置と変化傾向をリアルタイムで表示します。 チャートの形式で、インジケーターがインストールされているペアの各通貨のトレンドの履歴を表します。 選択したモードのいずれかに従って通貨を分析します (分析ブロック)
解析ブロック 解析結果の一覧とボタンで構成されています。デフォルトの分析モードは Analisis パラメータで設定できます。 [次へ] ボタンと [前へ] ボタンを使用して、分析モードを切り替えることができます。[Revs] ボタンを使用して、評価の並べ替えを逆にすることができます。 分析モード: 通貨格付け (Analys

WolfeWaveBuilder インジケーターで取引に参加しましょう! これは、最も成功した収益性の高い投資決定を得るために特別に作成された独自のツールです。 ライブ口座に最適で、徹底的にテストされ、事実上保証された取引戦略から利益を得られます。 チャンスをお見逃しなく! WolfeWaveBuilder インジケーターでお金の取引を始めましょう!
MT5 バージョン https://www.mql5.com/ru/market/product/82360
インジケーターの機能
Wolfe Waves 戦略の合図を出します。 トレンドを表示します。 1980 年から使用されている実績のある効果的な戦略です。 シンプルなエントリーシグナル。 再描画せず、遅れません。 音、メール、電話でのお知らせがあります。
命令
矢印が表示されるか、端末にメッセージが表示されるか、メール、電話に通知されるまで待ちます。 あなたは取引を開きます。 価格がライン 1 ~ 4 を超えたときに終了することをお勧めします。 戦略をよりよく理解

This is an interactive and easy-to-set indicator which allows to form seven equally spaced channels which have your settings simultaneously. All seven channels are enabled by default. But you can easily enable one or another channel using control buttons located in the upper case of the indicator's control panel. You can change a period of the indicator calculation by clicking one of buttons indicating number of the channel in the lower case of the control panel. Two other buttons (one of them i

This indicator shows Commodity Channel Index (CCI) data from 9 currency pairs by your choice for all 9 Time Frames. If a digital value of the CCI is less or equal to DnLevel = -100 (or whatever number you decided to put) then a Green square will appear. This is potentially an oversold condition and maybe a good time to go Long. If a digital value of the CCI is greater or equal to UpLevel = 100 (or whatever number you decided to put) then a Red square will appear. This is potentially an overbough

This indicator shows bands (flexible corridor) for a current price movement and the change of trend. The indicator can be used on any time frames and currency pairs. The following input parameters can be easily changed for your needs: nPeriod = 13; - number of bars which the indicator will use for calculation Deviation = 1.618; - coefficient for bands distance from the middle line MaShift = 0; - shift from current bar
Pipfinite creates unique, high quality and affordable trading tools. Our tools may or may not work for you, so we strongly suggest to try the Demo Version for MT4 first. Please test the indicator prior to purchasing to determine if it works for you. We want your good reviews, so hurry up and test it for free...we hope you will find it useful.
Combo Swing Control with Energy Beam Strategy: Confirm swing pullback signals Watch Video: (Click Here)
Features Detects overall bias and waits for overb

This indicator allows to analyze a chart using the rule of supple and demand. You will see zones of sales and purchases and determine the most profitable points to open positions. The indicator is based on the principle of market fractality. Chart zones show places where a strong buyer or seller has made the price reverse and change its direction. The indicator has several types of zones calculation. Color and type of zones displaying are set as desired. The zone width can be displayed in pips.
FREE

This indicator is designed for drawing equidistant channels. Two options are available: based on the number of hours in the indicator calculation and by the number of bars. To draw a channel, enter a number 1 or greater. The maximum value is limited by the amount of visible bars. If the parameters you enter are beyond the allowable limits, you will get notified if the indicator restrictions. Please note that the time involved in calculation of the channel must be greater than the timeframe it wi

Bull Bear Powers indicator shows the absolute power of bulls and bears in the market. Both powers are shown simultaneously with red and green colors for bear and bull powers respectively. When red line goes over the green line it means that bears are controlling the market. When green line goes over the red line it means that bulls are controlling the market. The green/red horizontal symbol line at the bottom of the indicators shows which party has more strength. Time Frame: M30 and H1 are recom
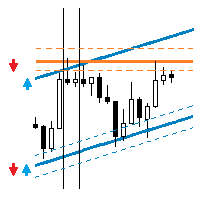
This EA trades support/resistance levels which were placed by a trader (Trend Line from toolbar). The direction of a trade is set graphically by arrows: ↑ - buy; ↓ - sell; - buy or sell in case of crossing support/resistance level. The level is off if inconsistent directions were set, like: ↑↓, ↑, or ↓. If the price is lower than a level it is a resistance level. And opposite is true for support level. There are a few methods available for levels defining, for testing with visualization as

The Advanced SovPattern is a multi-currency robot which trades on M30. The Expert Advisor's performance on a real account is shown using the AdvancedSovPatern2025 signal.
Trade Strategy: This EA tests and reveals market changes. Then it uses mathematical analysis to discover patterns and adjusts to changing trading conditions. It allows this EA to work without time restrictions regardless any changes of the market. The EA is based on our study of regular currencies behavior on the market de

This indicator shows data from 9 currency pairs by your choice for all 9 Time Frames. If a digital value of the RSI is less or equal to DnLevel = 30 (or whatever number you decided to put) then a Green square will appear. This is potentially an oversold condition and maybe a good time to go Long. If a digital value of the RSI is greater or equal to UpLevel = 70 (or whatever number you decided to put) then a Red square will appear. This is potentially an overbought condition and maybe a good time

This indicator shows an Up trend ( Green square ) if a parabolic SAR value is below the current price, and Down trend ( Red square ) if a parabolic SAR value is above the current price from all Time Frame for each currency pairs. Input parameters from Symb1 to Symb9 — You may change any of these Symbols to any legal currency pair existed on your platform. step=0.0; — Represents the acceleration factor for PSAR indicator. maximum=0.2; — Maximum value for the acceleration factor for PSAR indicator
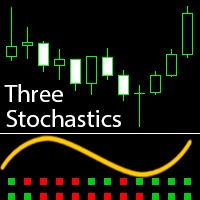
This indicator signals about crossing of the main and the signal lines of stochastic (lower stochastic) in the trend direction which is determined by two stochastics of higher time frames (higher stochastics). It is not a secret that stochastic generates accurate signals in a flat market and a lot of false signals in a protracted trend. A combination of two stochastics of higher time frames performs a good filtration of false signals and shows the main tendency. The indicator is recommended for
FREE

Marcus = market customization is 3 in 1 indicator. Universal business tool from professional traders that helps visualizing interesting market situations. Preview markets using price action and sentiment in the market. Three tools necessary to understand the market situation and the anticipation of further movement. Finally, you will see what parquet traders see. With these tools, you will see the important supports and resistances. It shows you the entry of big players on the market. The indica
MetaTraderマーケットが取引戦略とテクニカル指標を販売するための最適な場所である理由をご存じですか?宣伝もソフトウェア保護も必要なく、支払いのトラブルもないことです。これらはすべて、MetaTraderマーケットで提供されます。

取引の機会を逃しています。
- 無料取引アプリ
- 8千を超えるシグナルをコピー
- 金融ニュースで金融マーケットを探索