Watch the Market tutorial videos on YouTube
How to buy а trading robot or an indicator
Run your EA on
virtual hosting
virtual hosting
Test аn indicator/trading robot before buying
Want to earn in the Market?
How to present a product for a sell-through
Technical Indicators for MetaTrader 4 - 3

Gold Venamax - this is a best stock technical indicator. The indicator algorithm analyzes the price movement of an asset and reflects volatility and potential entry zones. Live Signal of manual trading >>> [ Click Here ] Indicator features: This is a super indicator with Magic and two Blocks of trend arrows for comfortable and profitable trading. Red Button for switching blocks is displayed on the chart. Magic is set in the indicator settings, so that you can install the indicator on two chart

The price is indicated only for the first 30 copies ( only 2 copies left ). The next price will be increased to $150 . The final price will be $250. Sniper Delta Imbalance is a professional tool for deep delta analysis — the difference between buyer and seller volumes. It takes volume analysis to the next level, allowing traders to see in real time who controls the price — buyers or sellers

Matrix Arrow Indicator MT4 is a unique 10 in 1 trend following 100% non-repainting multi-timeframe indicator that can be used on all symbols/instruments: forex, commodities, cryptocurrencies, indices, stocks. Matrix Arrow Indicator MT4 will determine the current trend at its early stages, gathering information and data from up to 10 standard indicators, which are: Average Directional Movement Index (ADX)
Commodity Channel Index (CCI)
Classic Heiken Ashi candles
Moving Average
Moving Avera

Super Signal – Skyblade Edition Professional No-Repaint / No-Lag Trend Signal System with Exceptional Win Rate | For MT4 / MT5 Core Features: Super Signal – Skyblade Edition is a smart signal system designed specifically for trend trading. It applies a multi-layered confirmation mechanism to detect only strong, directional moves supported by real momentum. This system does not attempt to predict tops or bottoms . It only triggers signals when all three of the following conditions are met: Clear

Auto Optimized MFI is a dynamic, self-tuning indicator that adapts to your market and timeframe by running real trade simulations on historical data. Unlike traditional indicators that rely on fixed 80/20 MFI thresholds, this tool adjusts to actual price and volume behavior to identify more effective Buy and Sell zones. How it works The indicator analyzes historical candles across a customizable range and simulates trades based on MFI signals. It records metrics like win rate, drawdown, and TP/S

Auto Optimized Bollinger Bands – Adaptive Volatility Tool for Real Markets Auto Optimized Bollinger Bands is an advanced MT4 indicator that improves the traditional Bollinger Bands by automatically selecting the best period and deviation values using historical trade simulation. Instead of fixed inputs, the indicator runs real-time optimization to find the most effective parameters based on actual market behavior. This allows the bands to adjust to changing volatility and price structure without

How many times have you bought a trading indicator with great back-tests, live account performance proof with fantastic numbers and stats all over the place but after using it, you end up blowing your account?
You shouldn't trust a signal by itself, you need to know why it appeared in the first place, and that's what RelicusRoad Pro does best! User Manual + Strategies + Training Videos + Private Group with VIP Access + Mobile Version Available
A New Way To Look At The Market
RelicusRoad is th

Currency Strength Meter is the easiest way to identify strong and weak currencies. This indicator shows the relative strength of 8 major currencies + Gold: AUD, CAD, CHF, EUR, GBP, JPY, NZD, USD, XAU. Gold symbol can be changed to other symbols like XAG, XAU etc.
By default the strength value is normalised to the range from 0 to 100 for RSI algorithm: The value above 60 means strong currency; The value below 40 means weak currency;
This indicator needs the data of all 28 major currency pairs a

Main purpose: "Pin Bars" is designed to automatically detect pin bars on financial market charts. A pin bar is a candle with a characteristic body and a long tail, which can signal a trend reversal or correction.
How it works: The indicator analyzes each candle on the chart, determining the size of the body, tail and nose of the candle. When a pin bar corresponding to predefined parameters is detected, the indicator marks it on the chart with an up or down arrow, depending on the direction of
FREE
Binary Trader Master is an arrow based indicator that predicts the close of the candle. It does its analysis within one candle only. When the candle opens it requires a few moments to make the analysis and predict the close of the candle. Then it generates a signal. The indicator also allows you to apply time limits that it can use for the analysis which means that you can actually tell the indicator how much time it is allowed to have for the analysis within the candle. The indicator monitors s

MT4 Version : https://www.mql5.com/en/market/product/125434 MT5 Version : https://www.mql5.com/en/market/product/157662
MT4 ASSISTANT : https://www.mql5.com/en/market/product/107986
RALLY BASE RALLY (RBR), DROP BASE RALLY (DBR), DROP BASE DROP (DBD), RALLY BASE DROP (RBD), FAIR VALUE GAP (FVG) / IMBALANCE, HIDDEN BASE
Introducing the "Supply Demand MT4" Indicator – your ultimate tool for navigating the dynamic world of financial markets with precision and confidence. This cutting-edge Indica
FREE
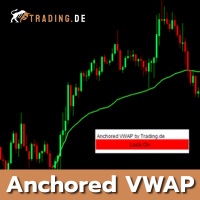
With the Anchored VWAP for MT4 from Trading.de, you can easily calculate and display the volume-based average price starting from a specific point in the chart (anchor). The indicator is ideal for our Trading.de 1-minute chart strategy, but can also be used in all other timeframes. The AVWAP for MetaTrader 4 is calculated using volume or an average period. In the settings, you can specify whether or not to use real trading volume. The indicator also has a "Lock" button in the upper right corner
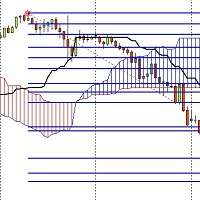
I have developed an indicator based on both the fibo musang strategy and the price breaking of the ichimoku cloud and it has amazing results
the features are:
1- Once activated it give you the trend where you are from the chart
2- After a trend change it gives you an alert on PC or notification on your phone if you are away.
3- It sends you the exact prices to take an order and 3 take profit levels and your stoploss.
4- It works on every timeframes from 1m to MN.
5- It works on pairs and C

volatility level indicator is a volatility oscillator to see trend reversal points. price trends has reverese when volatility inreased . this indicator show trend reversal points volatility. mostly same level up and down volatility is reversal points. red colour shows up points of volatilty.and probably trend will down. blue colour oscillator shows deep point of price when increased volatiliyty. on pictures horizontal lines on oscillator has drawed by hand.to see the before level and compare now

Currently switched to the 4 hour chart - but use other time frames for confirmation. :-) I change my main time frame based on the market movement at the time. The Hurricane Forex Indicator is a multi time frame indicator that includes such things as Trade Notifications, Trade Calculator, Momentum Indicator, risk reward and much more. We have a free Trade room for our users as well. Please check out the video for full details of how this indicator works as it has over 15 years worth of developme

This indicator is another variant of the famous powerful indicator Fibonacci-SS https://www.mql5.com/en/market/product/10136 but has different behaviour in placing Pending Order and TP Line. Automatically places Fibonacci retracement lines from the last highest and lowest visible bars on the chart with: An auto Pending Order (Buy/Sell). Taking Profit 1, Taking Profit 2 is pivot point and Taking Profit 3 for extended reward opportunity. The best risk and reward ratio.
Simple and powerful indicat

Contact me after payment to send you the user manual PDF file. Introduction The moving average indicator is the most well-known and one of the most popular indicators among traders. It is very simple to work with, but a basic question has always become a big challenge among traders: What is the most optimal setting of the moving average for each chart-time frame? The answer to this question is very difficult, you have to try different settings of the moving average indicator for different chart
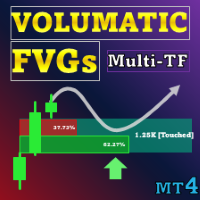
Special offer : ALL TOOLS , just $35 each! New tools will be $30 for the first week or the first 3 purchases ! Trading Tools Channel on MQL5 : Join my MQL5 channel to update the latest news from me Volumatic Fair Value Gaps (FVG) identifies and maintains meaningful price-imbalance zones and decomposes directional volume within each gap. Volume is sampled from a lower timeframe (default M1, user-selectable), split into Buy vs. Sell shares, and rendered as two percentage bars whose s

The "Gold Trader Pro Indicator" is an advanced technical analysis tool for the MetaTrader 4 platform, designed to help you make informed trading decisions about gold. Using a combination of moving averages, RSI, ADX, MACD, and volume analysis, this indicator provides clear trading signals across multiple timeframes, including M5, M15, M30, H1, H4, and D1. My indicators for free. I only ask that leave your feedback to help me improve them or as a thank you. Have a good trade! Main Features Multi
FREE
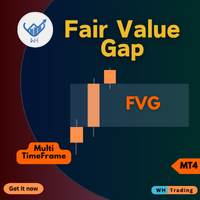
Experience trading like never before with our unparalleled Fair Value Gap MT4 Indicator,(FVG)
hailed as the best in its class. This MQL5 market indicator goes beyond the ordinary,
providing traders with an unmatched level of accuracy and insight into market dynamics. EA Version: WH Fair Value Gap EA MT4
SMC Based Indicator: WH SMC Indicator MT4 Features:
Best-in-Class Fair Value Gap Analysis. Multi-TimeFrame support. Customization. Real-time Alerts. User-Friendly Perfection Seamless Compat
FREE
# 33% off - limited time only #
ChartSync Pro MT4 is an indicator, designed for the MetaTrader 5 trading terminals. It enables the trader to perform better multi-timeframe technical analysis, by synchronizing symbols and objects into virtually unlimited charts. Built by traders for traders! Telegram Premium Support - Dd you purchase the Chart Sync indicator and need a bit of help? Send us a screenshot with your purchase and your Telegram ID so we can add you to our premium support Telegram
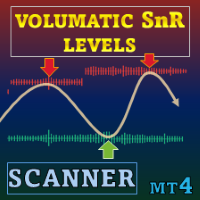
Special offer : ALL TOOLS , just $35 each! New tools will be $30 for the first week or the first 3 purchases ! Trading Tools Channel on MQL5 : Join my MQL5 channel to update the latest news from me Volumatic Support/Resistance Levels Scanner is a support‑and‑resistance indicator that adds volume context to price structure. By showing how trading activity clusters around recent pivots, it helps users see where buying or selling interest has been most active. See more MT5 version at:
The Trend Line PRO indicator is an independent trading strategy. It shows the trend change, the entry point to the transaction, as well as automatically calculates three levels of Take Profit and Stop Loss protection.
Trend Line PRO is perfect for all Meta Trader symbols: currencies, metals, cryptocurrencies, stocks and indices. The indicator is used in trading on real accounts, which confirms the reliability of the strategy. Robots using Trend Line PRO and real Signals can be found here:

Gartley Hunter Multi - An indicator for searching for harmonic patterns simultaneously on dozens of trading instruments and on all classic timeframes: (m1, m5, m15, m30, H1, H4, D1, Wk, Mn). Manual (Be sure to read before purchasing) | Version for MT5 Advantages 1. Patterns: Gartley, Butterfly, Shark, Crab. Bat, Alternate Bat, Deep Crab, Cypher
2. Simultaneous search for patterns on dozens of trading instruments and on all classic timeframes
3. Search for patterns of all possible sizes. From t
Delta Fusion Pro – Advanced Order Flow Analysis for Intraday Trading
Delta Fusion Pro is a professional indicator for MetaTrader 4 that reveals aggressive order flow, showing the intensity and direction of institutional pressure in real time. Unlike traditional volume indicators, it analyzes the delta between Ask and Bid volumes to anticipate reversals, confirm trends, and identify professional interest zones. Key Features Intelligent Auto-Tuning System
Automatically adjusts all parameters ba

Royal Wave is a Trend-Power oscillator which has been programmed to locate and signal low-risk entry and exit zones. Its core algorithm statistically analyzes the market and generates trading signals for overbought, oversold and low volatile areas. By using a well-designed alerting system, this indicator makes it easier to make proper decisions regarding where to enter and where to exit trades. Features Trend-Power Algorithm Low risk Entry Zones and Exit Zones Predictions for Overbought and Over

Royal Scalping Indicator is an advanced price adaptive indicator designed to generate high-quality trading signals. Built-in multi-timeframe and multi-currency capabilities make it even more powerful to have configurations based on different symbols and timeframes. This indicator is perfect for scalp trades as well as swing trades. Royal Scalping is not just an indicator, but a trading strategy itself. Features Price Adaptive Trend Detector Algorithm Multi-Timeframe and Multi-Currency Trend Low
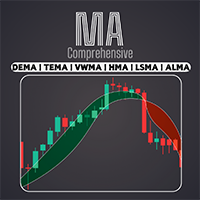
Access a wide range of moving averages, including EMA, SMA, WMA, and many more with our professional Comprehensive Moving Average indicator. Customize your technical analysis with the perfect combination of moving averages to suit your unique trading style / MT5 Version
Features Possibility to activate two MAs with different settings. Possibility to customize chart settings. Possibility to change the color of the candlesticks depending on crossed MAs or price crossed with MAs. Sending of a
FREE
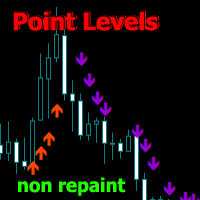
Point Directions - An indicator showing point levels of support and resistance when the price moves. The arrows show price bounces in the indicated directions.
The arrows are not redrawn, they are formed on the current candle. Works on all time frames and trading instruments. There are several types of alerts.
Has advanced settings to customize signals for any chart. Can be configured to trade with the trend and corrections.
For drawing arrows, there are 2 types of moving averages and an intens
SL Curruncy impulse https://www.mql5.com/en/market/product/82593 SL Session Strength 28 Pair flow of this intraday Asian London New York Sessions strength.SL Session Strength 28 indicator best for intraday scalper. market powerful move time you can catch best symbol. because you'll know which currencies are best to trade at that moment. Buy strong currencies and sell weak currencies (Diverging currencies). Suggested timeframes to trading : M5 - M15 - M30 - You can however just change session

Special offer : ALL TOOLS , just $35 each! New tools will be $30 for the first week or the first 3 purchases ! Trading Tools Channel on MQL5 : Join my MQL5 channel to update the latest news from me Introducing the revolutionary RSI Kernel Optimized with Scanner , a cutting-edge tool that redefines traditional RSI analysis by integrating the powerful Kernel Density Estimation (KDE) algorithm. This advanced indicator not only provides real-time insights into market trends but also in

The Fair Value Gap (FVG) is a price range where one side of the market liquidity is offered, typically confirmed by a liquidity void on the lower time frame charts in the same price range. Price can "gap" to create a literal vacuum in trading, resulting in an actual price gap. Fair Value Gaps are most commonly used by price action traders to identify inefficiencies or imbalances in the market, indicating that buying and selling are not equal. If you're following the ICT Trading Strategy or Smart
FREE

Special offer : ALL TOOLS , just $35 each! New tools will be $30 for the first week or the first 3 purchases ! Trading Tools Channel on MQL5 : Join my MQL5 channel to update the latest news from me Liquidation Reversal Signals is an indicator designed to mark directional liquidation phases and confirm reversal points by combining Z-score volume extremes with Supertrend state changes. Instead of printing an arrow whenever a trend simply “changes color,” this tool s
The indicator allows you to instantly determine the current trend by color and FIBO levels. Higher Timeframe the panel shows the current trend of higher periods, helping to determine the strength of the trend Trade according to the trend when changing the color of candles or trade against the trend when the price hit the extreme levels of the FIBO Trend PRO indicator Advantages of the FIBO Trend PRO
Indicator never repaint and does not change their values Very easy to use and intuitive
This VWAP is a simple VWAP, but we've incorporated notifications that inform you when the price hits or crosses the VWAP line. This indicator is a traditional VWAP indicator for MetaTrader 4 (MT4). The default parameters are those of the normal VWAP, but you have the ability to modify the VWAP calculation, and the best part: When the price touches or crosses the VWAP, you will be notified through alerts, mobile notifications, email, or sound events. Anchored VWAP indicator for MT4 . Parameters:
FREE

IX Power: Unlock Market Insights for Indices, Commodities, Cryptos, and Forex Overview
IX Power is a versatile tool designed to analyze the strength of indices, commodities, cryptocurrencies, and forex symbols. While FX Power offers the highest precision for forex pairs by leveraging all available currency pair data, IX Power focuses exclusively on the underlying symbol’s market data. This makes IX Power an excellent choice for non-forex markets and a reliable option for forex charts when deta

The official release price is $65 only for the first 10 copies, ( only 2 copies left ). Next price: $125 Gold Scalper System is a multifunctional trading system that combines a breakout strategy for key liquidity levels with confirmation and a built-in Smart DOM Pro module for market depth analysis. The system identifies zones of limit order accumulat

The indicator is a trading system for short-term trading.
Scalper Assistant helps to determine the direction of the transaction, and also shows the entry and exit points.
The indicator draws two lines (possible points for opening positions).
At the moment of the breakdown of the upper line up (and when all trading conditions are met), an up arrow appears (a buy signal), as well as 2 goals.
At the moment of the breakdown of the lower line down (and when all trading conditions are met), a down ar

Candle Binary Scalper - is a technical analysis product for forex and binary options.
Includes several technical indicators combined into a trading system.
Suitable for manual trading within a trend, for scalping and binary options. Works on all time frames and trading instruments.
Recommended Timeframes for trading M15, M30, H1 and H4, M5 and M1 should be used in case of high volatility. There are several types of alerts.
How to use the product
The optimal settings have already been selected

Best Solution for any Newbie or Expert Trader! This Indicator is an affordable trading tool because we have incorporated a number of proprietary features along with a new formula. The Advanced Accumulated Currency Volume Indicator is specialized for the main 28 Forex pairs and works on all time frames. It is a new formula that on a single chart extracts all the currency volume (C-Volume) of AUD, CAD, CHF, EUR, GBP, JPY, NZD, and USD. This is a great advantage in trading. Volume traders will know

What indicator do you look at most on your MT4 charts? Is it the Moving Average? I d o not believe that the default grid lines on MT4 charts—which you likely see hundreds or thousands of times—are designed with the intent of helping the user win. This is why MT4 users apply various indicators and go through trial and error. Because it is a chart you look at every day, it must present reliable information that we humans can recognize intuitively. This indicator was born from a single core concep

BinaryIndicator is a highly accurate indicator for trading binary options. It shows excellent results in scalping. This indicator is based in multifactor analysis of trend indicators, as well as confirmation oscillators, which in the end gives an increased accuracy of signals.
Advantages of the indicator Increased accuracy of signals. Excellent results when trading binary options with a short expiration time from M30 to M1 . It works on any timeframes. Works with any trade symbols.
Parameters
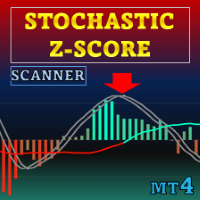
Special offer : ALL TOOLS , just $35 each! New tools will be $30 for the first week or the first 3 purchases ! Trading Tools Channel on MQL5 : Join my MQL5 channel to update the latest news from me Stochastic Z-Score is a momentum oscillator that normalizes price with a Z-Score, bounds it via stochastic logic, and smooths it with HMA, with ALMA for long-term context. Optional elements include a histogram, dynamic bands, and reversal labels.
See more MT5 version at: Stochastic Z S
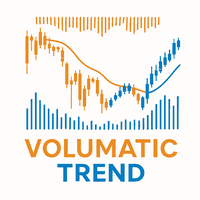
Volumatic Trend is a powerful, trend-following indicator that merges directional analysis with real-time volume behavior. By combining adaptive trend logic and volume overlays, it gives traders a detailed snapshot of market conviction and potential turning points. From instant trend shift detection to volume-weighted candle visuals, this tool brings deeper context to price movement. MT5 Version - https://www.mql5.com/en/market/product/136211/ Join To Learn Market Depth - https://www.mql5.com/
FREE
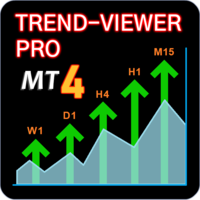
SEE THE TREND ON EVERY TIME FRAME. INTELLIGENT INDICATOR READS PRICE ACTION TO SPOT TRUE MARKET CYCLES AND TREND. This advanced multi-currency and multi-time frame indicator, reads trend in real-time so you always know the trends of the markets you want to trade.
Trend-Viewer Pro has been specifically designed to read the trend of every time frame and every market , simultaneously, making it much easier for you to find markets with time frame correlation , so you can focus on the best markets

Hydra Trend Rider is a non-repainting, multi-timeframe trend indicator that delivers precise buy/sell signals and real-time alerts for high-probability trade setups. With its color-coded trend line, customizable dashboard, and mobile notifications, it's perfect for traders seeking clarity, confidence, and consistency in trend trading. Setup & Guide: Download MT5 Version here. To learn how to use the Indicator: Indicator Manual & Guide - Read Here
Exclusively for you: It's your chance to st

ForexVitals Vital Trend Signals A trend-following indicator that prints clear buy/sell signals and projects risk levels directly on the chart. It is designed for traders who want a clean visual workflow: signal, stop reference, target projection, and optional on-chart statistics. What you get Buy/Sell arrows on the chart when trend conditions align Optional TP/SL projection lines based on the current stop distance and your TP_Ratio Optional dashboard with a compact signal summary Alerts (termin
FREE

Smart trading system . All timeframes, currencies, cryptocurrencies, metals... All MT4 and any screens and template are configured automatically. A beginner will simply trade based on a signal. The parameters of a unique flexible algorithm are open in settings.
Idea 1: In addition to “BUY/SELL”, signal “GET PROFIT” are given at extreme points. This tactic increases the result - you have profits when maximum and have more transactions. If "Take Profit" or "Stop Loss" triggered, or if you

Unveil Trading Insights with Auto Anchored VWAPs: Auto Anchored VWAPs serve as your guiding companion in the world of trading. These indicators pinpoint crucial market turning points and illustrate them on your chart using VWAP lines. This is a game-changer for traders who employ anchored VWAP strategies. How Does It Work? Identifying High Points: If the highest price of the current candle is lower than the highest price of the previous one, And the previous high is higher than the one before it
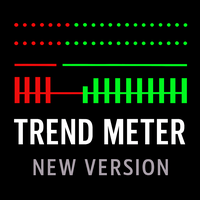
Multi-currency trend analysis indicator for MetaTrader 4 that visualizes trend direction and trend strength across multiple timeframes. For analysis purposes only. TREND METER – MULTI-CURRENCY TREND ANALYSIS INDICATOR (MT4) Trend Meter is a technical trend analysis indicator designed to visualize trend direction, trend strength, and trend alignment across multiple timeframes and symbols. The indicator is intended as a visual analysis tool and does not open trades automatically. Concept Market

Support And Resistance Screener Breakthrough unique Solution With All Important levels analyzer and Markets Structures Feature Built Inside One Tool! Our indicator has been developed by traders for traders and with one Indicator you will find all Imporant market levels with one click.
LIMITED TIME OFFER : Support and Resistance Screener Indicator is available for only 50 $ and lifetime. ( Original price 125$ ) (offer extended) The available tools ( Features ) in our Indicator are : 1. HH-LL
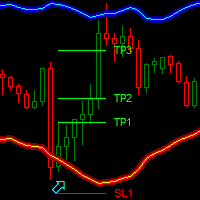
Dark Bands is an Indicator for intraday trading. This Indicator is based on Counter Trend strategy but use also Volatility. We can enter in good price with this Indicator, in order to follow the inversions on the current instrument.
Key benefits
Easily visible take profit/stop loss lines Reliable bands lines with futuristic colors, and Intuitive directional arrows Useful statistics , which indicate the win rate of the signals Plus Package available, leave a feedback to receive
FREE

ICT, SMC, SMART MONEY CONCEPTS, SMART MONEY, Smart Money Concept, Support and Resistance, Trend Analysis, Price Action, Market Structure, Order Blocks, BOS/CHoCH, Breaker Blocks , Momentum Shift, Supply&Demand Zone/Order Blocks , Strong Imbalance, HH/LL/HL/LH, Fair Value Gap, FVG, Invert FVG, IFVG, Premium & Discount Zones, Fibonacci Retracement, OTE, Buy Side Liquidity, Sell Side Liquidity, BSL/SSL Taken, Equal Highs & Lows, MTF Dashboard, Multiple Time Frame, Big Bars, HTF OB, HTF
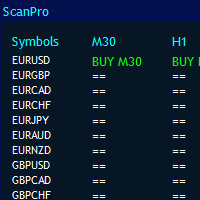
MT4 Universal Panel pro is designed for all indicators and timeframes as Universal Scanner, including ex4 files. It is a indicator signaler and indicator alerter.
It can scan limitless pairs based on your computers power and up to 10 time frame. Size of panel will arranged automatically. you can call any indicator by buffers.
It works for all default and custom indicators. You can simply use it for heikan ashi, rsi, parabolic, renko, fractals, support resistance, supply demand, divergence, hig

My Intraday trading session indicator. SL Session Strength 28 Pair https://www.mql5.com/en/market/product/57585 This strategy is even used by the Banks to make profits. They take a strong currency and pitch against a weak currency This indicator allows you to analyze the hidden trends and correlations between the 8 most traded currencies via unique strength meter which creates multiple charts in a single window based on the price action of each currency in relation to all other currenci

BUY INDICATOR AND GET EA FOR FREE AS A BONUS + SOME OTHER GIFTS! ITALO VOLUME INDICATOR is the best volume indicator ever created, and why is that? The Indicator works on all time-frames and assets, indicator built after 7 years of experience on forex and many other markets. You know many volume indicators around the internet are not complete, does not help, and it's difficult to trade, but the Italo Volume Indicator is different , the Italo Volume Indicator shows the wave volume, when market

This indicator I use with RENKO and RangeBar candle
Discover the Secret to Successful Forex Trading with Our Custom MT4 Indicator! Have you ever wondered how to achieve success in the Forex market, consistently earning profits while minimizing risk? Here is the answer you've been searching for! Allow us to introduce our proprietary MT4 indicator that will revolutionize your approach to trading. Unique Versatility Our indicator is specially designed for users who prefer Renko and Rangebar candle

MT5 version | Owl Smart Levels Indicator | Owl Smart Levels Strategy | FAQ
The Fractals Indicator is one of the elements of the author's trading strategy of Bill Williams . It is used to search for price reversal points on the price chart and, consequently, support and resistance levels. The Full Fractals Indicator is an improved Fractals which is available in the toolkit of almost all trading terminals. Its only difference is that to build a fractal we use 5 candles to the left and 2
FREE

The Currency Index indicator enables traders to display any index of eight major currencies. It uses a special calculation that considers specific currency pairs and their weights.
The default weights are based on the BIS Triennial Central Bank Survey results. Because of this advantage, the trader can see each currency's true strength and weakness.
Note: If the indicator is used in Strategy Tester (demo version), please keep in mind that all currency pairs' data must be downloaded in History

This indicator identifies the most popular Harmonic Patterns which predict market reversal points. These harmonic patterns are price formations that are constantly repeating in the forex market and suggest possible future price movements / Free MT5 Version Dashboard Scanner for this indicator: ( Basic Harmonic Patterns Dashboard ) Comparison of "Basic Harmonic Pattern" vs. "Basic Harmonic Patterns Dashboard" Indicators Feature Basic Harmonic Pattern
Basic Harmonic Patterns Dashboard
Fu
FREE

Supply Demand Analyzer is an advanced trading indicator meticulously designed for the precise identification, analysis, and management of supply and demand zones. By integrating real-time data and advanced algorithms, this tool enables traders to recognize market phases, price movements, and structural patterns with unparalleled accuracy. It simplifies complex market dynamics into actionable insights, empowering traders to anticipate market behavior, identify trading opportunities, and make info

Auto Optimized RSI: Professional Market Adaptation Most traders fail because they use static tools in a dynamic market. Using fixed RSI levels like 70/30 on every chart is a mathematical mistake. If you are looking for a "magic arrow" without logic, this is not for you. This is a tool for those who understand that Optimization is the only key to survival. Standard indicators don't care about the symbol or timeframe you are trading. Auto Optimized RSI does. It runs internal simulations on histori
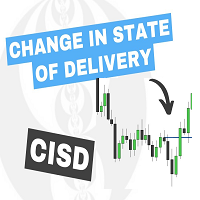
The Change In State Of Delivery (CISD) indicator detects and displays Change in State Of Delivery, a concept related to market structures.
Users can choose between two different CISD detection methods. Various filtering options are also included to filter out less significant CISDs.
USAGE Figure 2 A Change in State of Delivery (CISD) is a concept closely related to market structures, where price breaks a level of interest, confirming trends and their continuations from the resulting
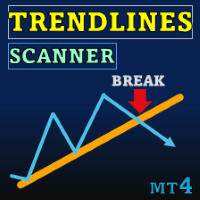
Special offer : ALL TOOLS , just $35 each! New tools will be $30 for the first week or the first 3 purchases ! Trading Tools Channel on MQL5 : Join my MQL5 channel to update the latest news from me The Trendlines with Breaks Scanner is a state-of-the-art trading tool designed to help traders identify critical trends and detect breakouts in real time. With automatically generated pivot-point-based trendlines, this indicator empowers traders to seize trading opportunities with precis

The Area of Interest (AOI) Indicator is a powerful tool designed to help traders identify key market zones where price reactions are highly probable. This indicator specifically highlights two critical zones: Seller AOI (Area of Interest) : This zone represents areas where sellers are likely to enter the market, often acting as resistance. When the price approaches or touches this zone, it signals that a potential sell-off could occur. Buyer A OI (Area of Interest) : The BOI zone identifies re
FREE
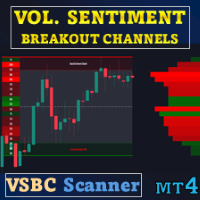
Special offer : ALL TOOLS , just $35 each! New tools will be $30 for the first week or the first 3 purchases ! Trading Tools Channel on MQL5 : Join my MQL5 channel to update the latest news from me Volume Sentiment Breakout Channels is an indicator that visualizes breakout zones based on volume sentiment inside dynamic price channels. Instead of looking only at pure technical breakouts, it focuses on how buy/sell volume is distributed within consolidation areas, thereby expressin

MT4 Multi-timeframe Order Blocks detection indicator. Features - Fully customizable on chart control panel, provides complete interaction. - Hide and show control panel wherever you want. - Detect OBs on multiple timeframes. - Select OBs quantity to display. - Different OBs user interface. - Different filters on OBs. - OB proximity alert. - ADR High and Low lines. - Notification service (Screen alerts | Push notifications). Summary Order block is a market behavior that indicates order collection

The indicator displays the horizontal volume profile in the specified area (BOX) and the maximum volume (POC).
Product Features. 1. You can use ticks or just price. 2. Adaptive grid spacing (M1-MN). 3. Adaptive high volume (median) search step depending on box size. 4. Automatic chameleon color for box lines and buttons. 5. Multiple boxes, easy to create and delete. 6. 70% volume area (enable in settings). 7. There is an alert for touching the maximum horizontal volume line (POC). 8. VWAP. 9. C

Overview Of Free But Advance Product Turbo Trend is a powerful indicator designed to help traders identify and act on market trends. It leverages a combination of advanced moving averages and volume analysis to provide clear signals for trend direction. Turbo Trend simplifies decision-making by categorizing market conditions into three distinct states: Uptrend , Downtrend , and Neutral Trend, using easily distinguishable color-coded lines and candle highlights. Would you like to have EA based on
FREE
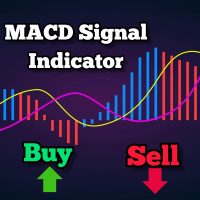
Ultimate Trend-Following Indicator: MACD-Based Signal Generator Unlock the power of trend-following with our advanced indicator, designed to optimize your trading strategy using the MACD (Moving Average Convergence Divergence) and a 200-period Moving Average (MA). This indicator not only provides precise buy and sell signals but also helps you manage risk with dynamic support and resistance levels. What is the MACD? The MACD is a popular trend-following momentum indicator that shows the relation
FREE
The MetaTrader Market is a simple and convenient site where developers can sell their trading applications.
We will help you post your product and explain you how to prepare your product description for the Market. All applications on the Market are encryption-protected and can only be run on a buyer's computer. Illegal copying is impossible.
You are missing trading opportunities:
- Free trading apps
- Over 8,000 signals for copying
- Economic news for exploring financial markets
Registration
Log in
If you do not have an account, please register
Allow the use of cookies to log in to the MQL5.com website.
Please enable the necessary setting in your browser, otherwise you will not be able to log in.