Watch the Market tutorial videos on YouTube
How to buy а trading robot or an indicator
Run your EA on
virtual hosting
virtual hosting
Test аn indicator/trading robot before buying
Want to earn in the Market?
How to present a product for a sell-through
Technical Indicators for MetaTrader 4 - 5

Scalpers Zone – Ultimate Supply/Demand + Stochastic Rejection & Triple Touch Indicator Scalpers Zone is designed for traders seeking high-probability scalp entries . It detects daily and 7-day supply/demand zones and highlights areas where these zones align perfectly , marking the strongest potential reversal points . For volatile assets like crypto and gold , the zone thickness can be increased for better visibility and precision . Key Features: Aligned Zone Detection: Daily and 7-day supply or
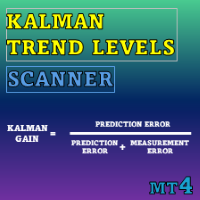
Special offer : ALL TOOLS , just $35 each! New tools will be $30 for the first week or the first 3 purchases ! Trading Tools Channel on MQL5 : Join my MQL5 channel to update the latest news from me Kalman Trend Levels is an advanced trend-following indicator that leverages cutting-edge Kalman filter technology to provide traders with powerful analytical signals. Designed for accuracy and adaptability, this tool not only identifies critical support and resistance zones but also offe

The We-Spread mt4 indicator is a spread trading tools and it is suitable for those who want to study the markets with a different approach to the contents that are normally available in online trading bookstores. I think the Spread Trading strategy is one of the best I've ever used in the last few years. This is a unique indicator for spread trading because allow you to study till 3 spreads in one time. What is Spread Trading on forex The Spread Trading is the study of the strength of 2 currency

Are you tired of manually drawing Fibonacci levels on your charts? Are you looking for a convenient and efficient way to identify key support and resistance levels in your trading? Look no further! Introducing DrawFib Pro, the ultimate MetaTrader 4 indicator that does auto f ibonacci levels drawing on your charts and provides timely alerts when these levels are breached. With Draw Fib Pro, you can enhance your trading strategies, save time, and make more informed decisions. My fibonacci bas
FREE

VWAP Ultimate Pro MT4 – Anchored VWAP | Session VWAP | Dynamic Bands & Smart Alerts Bring Institutional‑Grade VWAP Precision to the Classic MetaTrader 4 Platform
WHY TRADERS CHOOSE VWAP ULTIMATE PRO MT4?
VWAP (Volume‑Weighted Average Price) is the benchmark used by banks, prop desks, and hedge funds to gauge fair value. VWAP Ultimate Pro MT4 delivers that same power to retail traders, optimised for MT4’s architecture while preserving every professional feature you expect. This Indicator is cu

Trading doesn’t have to be complicated. With the right visual guidance, market decisions become clearer, calmer, and more confident.
Nebula Arrow is designed to help traders focus on what truly matters: high-quality entries based on refined market behavior. Just load it on your chart and let the arrows guide your trading decisions. Trade With Confidence We believe that simplicity is power. Nebula Arrow was created after extensive market observation and practical research, transforming complex
FREE
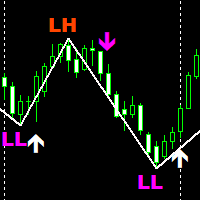
SMC Traders is a non-repaint indicator that is based on Price Action The indicator uses current market structure to predict future reversals. The indicator can be used with our free Market structure zig zag which can be found here: https://www.mql5.com/en/market/product/91579 Please note to find the HH AND HL CLINK ON LINK ABOVE Timeframes: 15 minutes for scalping 1 Hour for swing trading Purple Arrow look for sells in conjunction with LL White Arrow look for buys in conjunction with HL
FREE

Gold Trend - this is a good stock technical indicator. The indicator algorithm analyzes the price movement of an asset and reflects volatility and potential entry zones. Live Signal of manual trading >>> [ Click Here ] The best indicator signals: For SELL = red histogram + red SHORT pointer + yellow signal arrow in the same direction + red trend direction arrow. For BUY = blue histogram + blue LONG pointer + aqua signal arrow in the same direction + blue trend direction arrow.
Benefits of the

The indicator analyzes the volume scale and splits it into two components - seller volumes and buyer volumes, and also calculates the delta and cumulative delta. The indicator does not flicker or redraw, its calculation and plotting are performed fairly quickly, while using the data from the smaller (relative to the current) periods. The indicator operation modes can be switched using the Mode input variable: Buy - display only the buyer volumes. Sell - display only the seller volumes. BuySell -
FREE

MT5 version | Trend Monitor VZ Indicator | Owl Smart Levels Indicator | Owl Smart Levels Strategy | FAQ The Elliott wave theory is an interpretation of processes in financial markets that relies on a visual model of waves on price charts. The Valable ZigZag indicator displays the wave structure of the market, which can be used to make trading decisions. The Valable ZigZag indicator is more stable and does not often change its direction like the classic ZigZag indicator, misleadin
FREE
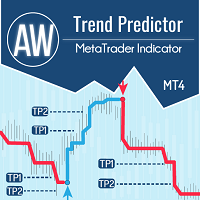
The combination of trend and breakdown levels in one system. An advanced indicator algorithm filters market noise, determines the trend, entry points, as well as possible exit levels. Indicator signals are recorded in a statistical module, which allows you to select the most suitable tools, showing the effectiveness of the signal history. The indicator calculates Take Profit and Stop Loss marks. Manual and instruction -> Here / MT5 version -> Here How to trade with the indicator: Trading with T
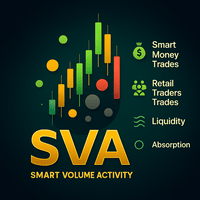
Smart Volume Activity [SVA] is an advanced analytical indicator designed for MetaTrader platforms. It reveals how institutional (Smart Money) and retail traders operate by analyzing volume behavior across multiple timeframes . Unlike ordinary volume tools, SVA automatically adapts to any chart timeframe and highlights zones of absorption — moments when large market participants absorb liquidity from weaker hands. By detecting abnormal volume spikes far beyond typical mark

AlphaTrend Pro - Enhanced Visual Trend Detection Indicator Product Title AlphaTrend Pro - Advanced Trend Detection with Crystal-Clear Visual Signals Brief Description AlphaTrend Pro is a sophisticated trend-following indicator that combines volatility analysis (ATR) with momentum oscillators (RSI/MFI) to create dynamic support and resistance levels. Enhanced with large directional arrows and smart visual positioning, this professional MT4 indicator provides unmistakable buy/sell signals that ada

Introducing the Parabolic Predictor Dashboard , an advanced multisymbol, multitimeframe, and non-repainting dashboard indicator based on the popular Parabolic Indicator. It filters traditional Parabolic signals to identify the exact trend and predict market entry and exit levels.
This indicator is not just a dashboard. With one click on the symbol, you can see the trend direction, accurate entry levels, and take profit levels on a new chart window. And with our fast Alert system, you'll never m

Title: SMC Structure for EURUSD Description: This indicator is designed to map market structures based on Smart Money Concepts (SMC). It identifies Swing Structure, Internal Structure, Order Blocks, and Fair Value Gaps (FVG). The tool is optimized for performance to manage resources efficiently on the MetaTrader platform. Key Features: 1. Market Structure Mapping Identifies Major Swing Structure with BOS (Break of Structure) and CHoCH (Change of Character). Displays Internal Structure to visual
FREE

The Candle Power Pro is a sophisticated trading tool designed to decode real volume pressure, tick data imbalances, and institutional order flow dynamics by measuring the battle between bull ticks and bear ticks in real time. This indicator transforms raw volume data into actionable insights , helping traders identify Smart Money movements, liquidity hunts, and hidden market psychology behind each price candle. By analyzing buyer/seller volume percentages, divergence pattern

The indicator automatically identifies the 1-2-3 pattern on the chart. The indicator is able to monitor the formation of pattern in real time. It informs the trader when the pattern is completely formed (when the price breaks the line in point 2) and displays the completed patterns in history. The patterns are never redrawn. The indicator can identify patterns on any instruments (currency pairs, stock market, gold, etc.) without the need to adjust to each instrument. Simple and clear visualizati

TrendSeeker Dashboard – Smart Market Filter for High-Probability Trades TrendSeeker Dashboard is a powerful multi-symbol market intelligence tool designed to help traders avoid ranging markets and focus only on high-quality trending pairs on the H4 timeframe. The dashboard continuously scans all available symbols and classifies each pair into: Trending UP Trending DOWN Ranging / No-Trade Conditions By combining EMA trend direction , ADX trend strength , and ATR volatility , TrendSeeker instantly
FREE
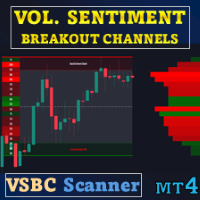
Special offer : ALL TOOLS , just $35 each! New tools will be $30 for the first week or the first 3 purchases ! Trading Tools Channel on MQL5 : Join my MQL5 channel to update the latest news from me Volume Sentiment Breakout Channels is an indicator that visualizes breakout zones based on volume sentiment inside dynamic price channels. Instead of looking only at pure technical breakouts, it focuses on how buy/sell volume is distributed within consolidation areas, thereby expressin

Place price Alerts on extended Rectangles and Trendlines - Risk reward indicator MT4 Extend Rectangles & Trendlines to the right edge Mark your supply demand zones with extended rectangle and draw support resistance lines with extended trendline. Find detailed manuals here . Find contacts on my profile . MT4 Rectangle extender indicator will simplify and make it easier for you to analyze markets and stay notified about important events. When you extend rectangle or trendline the action butto

MACD indicator in MetaTrader 4/5 looks different than MACD does in most other charting software. That is because the MetaTrader 4/5 version of MACD displays the MACD line as a histogram when it is traditionally displayed as a line. Additionally, the MetaTrader 4/5 version computes the Signal line using an SMA, while according to MACD definition it is supposed to be an EMA. The MetaTrader 4/5 version also does not compute a true MACD Histogram (the difference between the MACD/Signal lines). This
FREE

Multi-Timeframe Supply Demand Histogram Description:
The Multi-Timeframe Supply Demand Histogram is a powerful and clean indicator that shows market demand and supply strength across multiple timeframes , specifically H4 and D1. It displays histograms highlighting when buyers or sellers dominate , allowing traders to quickly identify key market pressure areas. Key Features: H4 & D1 Histograms: Clear visualization of higher timeframe market strength. Histogram Change Alerts: Optional notificatio
FREE

The Smart Liquidity Profile is color-coded based on the importance of the traded activity at specific price levels, allowing traders to identify significant price levels such as support and resistance levels, supply and demand zones, liquidity gaps, consolidation zones, Buy-Side/Sell-Side Liquidity and so on. Smart Liquidity Profile allows users to choose from a number of different time periods including 'Auto,' 'Fixed Range,' 'Swing High,' 'Swing Low,' 'Session,' 'Day,' 'Week,' 'Month,' 'Quar

The Reversal Master is an indicator for determining the current direction of price movement and reversal points. The indicator will be useful for those who want to see the current market situation better. The indicator can be used as an add-on for ready-made trading systems, or as an independent tool, or to develop your own trading systems. The Reversal Master indicator, to determine the reversal points, analyzes a lot of conditions since the combined analysis gives a more accurate picture of t

Auto Fibo is an indicator developed to enhance your manual trading. It will draw the golden ratio automatically, saving you time and facilitating your trading. Attach the indicator to the graph and it will automatically draw the exact golden ratio, saving you the trouble of having to find the critical point. The interface adjusts according to your computer to the approximate high and low points of the band. This indicator will correct most start and end point selection errors. For each band, th
FREE
About Range Explosion Range Explosion is a powerful and free trading tool designed to detect market ranges, draw precise support and resistance zones, and identify breakout opportunities with accuracy and style.
It is a part of the Break Out Explosion Project, offering traders a reliable and visually advanced solution for both beginners and professionals. MT5 Version of this product is available here : https://www.mql5.com/en/market/product/153004 If you are interested in breakout trading concep
FREE

The SuperTrend AI indicator is a novel take on bridging the gap between the K-means clustering machine learning method & technical indicators. In this case, we apply K-Means clustering to the famous SuperTrend indicator. USAGE Users can interpret the SuperTrend AI trailing stop similarly to the regular SuperTrend indicator. Using higher minimum/maximum factors will return longer-term signals. (image 1) The displayed performance metrics displayed on each signal allow for a deeper interpretat

The latest version of Indicator is fully integrated into an all-in-one package, including: Fair Value Gaps (FVG). Implied Fair Value Gap (IFVG). OrderBlock (OB). The options in the settings section are relatively easy to navigate, and you can even use them right away upon activation without encountering difficulties when using the default configuration. The indicator utilizes an algorithm to automatically draw and identify Order Blocks (OB), Fair Value Gaps (FVGs), and Implied Fair Value Gap

INSTRUCTIONS RUS / INSTRUCTIONS ENG - VERSION MT5 Main functions: Displays active zones of sellers and buyers! The indicator displays all the correct first impulse levels/zones for purchases and sales. When these levels/zones are activated, where the search for entry points begins, the levels change color and are filled with certain colors. Arrows also appear for a more intuitive perception of the situation. LOGIC AI - Display of zones (circles) for searching entry points when activa

1.Supply and demand are one of the core strategies used in trading. It focuses on the ancient laws of supply and demand, as well as the trends of prices in a free flowing market. The basis of this strategy is that the quantity of available tools and the demand for tools from buyers determine the price. It marks on the chart the areas where demand overwhelms supply (demand regions), driving prices up, or where supply overwhelms demand (supply regions), driving prices down. Most supply and demand
FREE
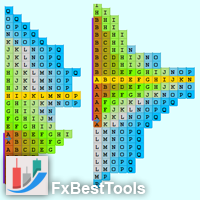
Definition : A Market Profile is an intra-day charting technique (price vertical, time/activity horizontal). Market Profile is best understood as a way to see order in the markets. Market Profile was a way for traders to get a better understanding of what was going on, without having to be on the trading floor. The current indicator is developed based on Easy-to-Use architecture including a wide range of visual settings.
Major Features of Indicator : Various Views of Market Profile The indicat

This is MT4 version of StochScanner It scans Stochastic from Multi Symbols and Multi Timeframes and displayed on the dashboard on a single chart. . 4 scanning modes: 1. Mode OverBought/OverSold Indicator scans Overbought and OverSold . OverBought : current stochastic is above level 80 and OverSold : current stochastic is below level 20 2. Mode Signal It means if the previous stochastic is on OverBought or OverSold ( either Main Line and Signal Line ) and the current Main Line cross over the curr

** All Symbols x All Timeframes scan just by pressing scanner button ** *** Contact me to send you instruction and add you in "All Divergences scanner group" for sharing or seeing experiences with other users. Introduction Divergence is a main technique used to determine trend reversing when it’s time to sell or buy because prices are likely to drop or pick in the charts. All Divergence indicator can help you locate the top and bottom of the market. This indicator finds Regular divergences for

"The trend is your friend" is one of the best known sayings in investing, because capturing large trendy price movements can be extremely profitable. However, trading with the trend is often easier said than done, because many indicators are based on price reversals not trends. These aren't very effective at identifying trendy periods, or predicting whether trends will continue. We developed the Trendiness Index to help address this problem by indicating the strength and direction of price trend

Wave Reversal Indicator - determines the direction of trend waves and price reversals.
The indicator shows wave movements and trend directions. It gives recommendations where to follow the trader, helps to follow the trading strategy.
It is an addition to an intraday or medium-term strategy.
Almost all parameters are selected for each time frame and are changed automatically, the only parameter for manual adjustment is the wavelength.
Works on various trading instruments and timeframes, recomme
FREE

Multicurrency and multitimeframe modification of the Commodity Channel Index (CCI) indicator. You can specify any desired currencies and timeframes in the parameters. Also, the panel can send notifications when crossing overbought and oversold levels. By clicking on a cell with a period, this symbol and period will be opened. This is MTF Scanner. The key to hide the dashboard from the chart is "D" by default.
Parameters CCI Period — averaging period.
CCI Applied price — price type.
Clear the

"Ppr PA" is a unique technical indicator created to identify "PPR" patterns on the currency charts of the MT4 trading platform. These patterns can indicate possible reversals or continuation of the trend, providing traders with valuable signals to enter the market.
Features: Automatic PPR Detection: The indicator automatically identifies and marks PPR patterns with arrows on the chart. Visual Signals: Green and red arrows indicate the optimal points for buying and selling, respectively. Arrow
FREE

The balance of supply and demand is a simple and effective market analysis method. The supply and demand diagram can show you in advance, even before the trend reversal, where the supply ends and the demand is already emerging, where the demand ends and the supply is emerging, while substantially increasing the probability of making a deal in the right direction and with a high profit factor.
Indicator Signals The indicator uses the price/volume values to generate signals: ED – excess demand. E
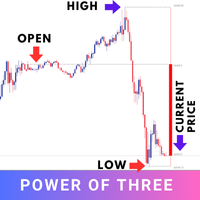
The "Power of Three" (PO3) is a concept developed by the Inner Circle Trader (ICT) to illustrate a three-stage approach used by smart money in the markets: Accumulation, Manipulation, and Distribution . ICT traders view this as a foundational pattern that can explain the formation of any candle on a price chart. In simple terms, this concept is effective for any time frame, as long as there's a defined start, highest point, lowest point, and end. MT5 - https://www.mql5.com/en/market/product/124
FREE
Squeeze Momentum Alert 1. Identifies Price "Explosion" Points (The "Squeeze") The greatest advantage of this indicator is its ability to catch periods where the market is "consolidating" or "gathering energy" before a massive move. Why it's good: Markets cycle between periods of calm (consolidation) and bursts of volatility (explosions). This tool tells you, "The chart is currently compressing tightly; get ready for the next big surge," ensuring you don't miss the start of a major trend. 2. Dist

Volume Footprint Analysis is a precision-engineered, volume-based indicator that transforms raw market volume into an intuitive, color-coded signal system. Built on concepts from Volume Spread Analysis (VSA) and Smart Money principles, this tool removes the guesswork from volume interpretation and gives traders clear, actionable insights on when to buy or sell — on any timeframe and across any trading instrument. MT5 Version - https://www.mql5.com/en/market/product/138565/ Join To Learn Mark

2 SNAKES is a first class scalping system. As the entries are quite precise, you are likely to become addicted to this system very quickly. You have 2 snakes. When you see a candle above or below them that does not touch them - that is your scalping signal.
Then buy or sell at the green line or close. If you use a larger time frame, scalping can become trend following.
The snakes are calculated precisely in relation to the current state of the market. They ARE NOT moving averages.
You decide
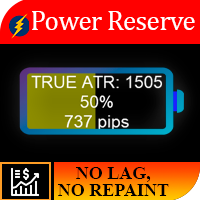
Work logic The importance of this indicator lies in the fact that it allows you to understand how much “fuel is still left at the instrument.” Imagine the situation, you left in a car with a half-discharged battery, on average, this amount of energy is usually enough for a car for 250 km, so if you want to, you cannot overcome a distance of 700 km. So for each instrument, there is a certain daily price movement, and as a result of statistical observations, it was revealed that 95% of the time t
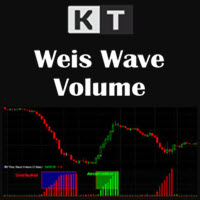
The KT Weis Wave Volume is a technical indicator based on the current market trend and description of the price movement's direction. The indicator is based on volume and displays the cumulative volumes for price increases and decreases in the price chart.
In addition, the indicator window shows a histogram of green and rising red waves.
The green color represents upward movement; the more the price rises, the larger the green volume. The red color represents a decreasing wave; the larger the

The Ultimate Trading Companion: Smart Trend Tracer Tired of getting lost in market noise? Ready to find the clearest trends with pinpoint accuracy? Introducing Smart Trend Tracer , the ultimate tool designed to cut through the clutter and reveal the most profitable market swings. This isn't just another indicator; it's your personal guide to spotting trends as they form, giving you the confidence to make smarter trading decisions. Smart Trend Tracer identifies significant highs and lows on your
FREE
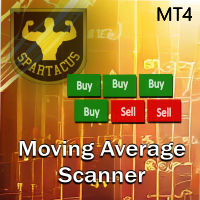
Moving Average Scanner is a multi-timeframe scanner perfect for seeing the trend over several time frames at a glance without changing the chart.
It can use up to 4 moving averages of your choice over 9 time units. It is fully configurable and can be moved anywhere on the graph by simply “drag and drop”.
Moving averages can be configured in 4 different calculation methods. You can also set alerts based on the number of moving averages and the number of periods.
MT5 version here.
Input param

In the "Masters of Risk" trading system, one of the main concepts is related to places where markets change direction. In fact, this is a change in priority and a violation of the trend structure at the extremes of the market, where supposedly there are or would be stop-losses of "smart" participants who are outside the boundaries of the accumulation of volume. For this reason, we call them "Reversal Patterns" - places with a lot of weight for the start of a new and strong trend. Some of the imp
Multi Timeframe Buy and Sell Power MT4
The Multi Timeframe Buy and Sell Power indicator for MetaTrader 4 is a versatile tool designed to provide traders with a clear visual representation of market pressure across nine standard timeframes, from M1 to MN1. By aggregating buy and sell strength percentages derived from recent price action and tick volume, it helps identify potential trends, reversals, and neutral conditions in real-time. The indicator displays this information in a compact dashbo
FREE

Trend Arrow Reaper is a trend-following indicator that provides clear buy and sell signals using arrows. It analyzes price action and identifies potential reversal points, displaying entry signals directly on the chart. Key Features: Arrow Signals: Blue Up Arrow – Buy signal (potential bullish reversal). Red Down Arrow – Sell signal (potential bearish reversal). Reduced False Signals – Advanced filtering to minimize noise. Works on All Timeframes – Suitable for scalping, day trading, a
Special offer : ALL TOOLS , just $35 each! New tools will be $30 for the first week or the first 3 purchases ! Trading Tools Channel on MQL5 : Join my MQL5 channel to update the latest news from me Maximize your trading edge with Follow Line with Scanner, an advanced volatility-based indicator designed for serious traders. This tool combines the power of Bollinger Bands with customizable settings, offering precise insights into price movements. See more MT5 version at: Follow Lin
FREE

The algorithm finds the zones of reduced volatility based on the UPD1 Trend Direction Indicator and builds the maximum horizontal volume based on the UPD1 Volume Box Indicator . As a rule, a strong trend movement occurs when exiting accumulation. If the price has left the accumulation, then it can test its maximum horizontal volume (POC). Smart alerts are available in the settings.
Input parameters.
Main Settings. Bars Count – the number of history bars on which the indicator will work. Timef
FREE
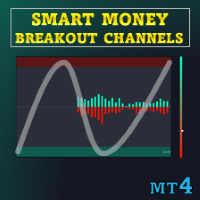
Special offer : ALL TOOLS , just $35 each! New tools will be $30 for the first week or the first 3 purchases ! Trading Tools Channel on MQL5 : Join my MQL5 channel to update the latest news from me This indicator plots breakout detection zones, referred to as “Smart Breakout Channels”, which are based on volatility-normalized price movement. These zones are shown as dynamic boxes with volume overlays. The tool detects temporary accumulation or distribution ranges using a custom nor

Capture every opportunity: your go-to indicator for profitable trend trading Trend Trading is an indicator designed to profit as much as possible from trends taking place in the market, by timing pullbacks and breakouts. It finds trading opportunities by analyzing what the price is doing during established trends. [ Installation Guide | Update Guide | Troubleshooting | FAQ | All Products ]
Trade financial markets with confidence and efficiency Profit from established trends without getting whip
Market Structure Order Block Dashboard MT4 – ICT / Smart Money Concepts Indicator for MetaTrader 4 Market Structure Order Block Dashboard MT4 is an advanced indicator for MetaTrader 4 designed for traders who use Smart Money Concepts (SMC) and the ICT approach: market structure, Order Blocks , BOS / ChoCH , Fair Value Gaps (FVG) , liquidity zones , Kill Zones and Volume Profile – all in a single visual dashboard. This is not an Expert Advisor and it does not open or manage trades. It is a techni
** All Symbols x All Time frames scan just by pressing scanner button ** Discount: The price is $50$, But now it is just $35, Limited time offer is active.
*** Contact me to send you instruction and add you in "Swing scanner group" for sharing or seeing experiences with other users. Swing EA: https://www.mql5.com/en/market/product/124747 Introduction: Swing Scanner is the indicator designed to detect swings in the direction of the trend and possible reversal swings. The indicator studies sev

** All Symbols x All Timeframes scan just by pressing scanner button ** *** Contact me to send you instruction and add you in "Market Structure group" for sharing or seeing experiences with other users. Introduction: Market structure is important for both new and professional traders since it can influence the liquidity and price action of a market (Breakout and Retest). It’s also one of the most commonly used techniques to understand trends, identify potential reversal points, and get a feel f

RSI divergence indicator finds divergences between price chart and RSI indicator and informs you with alerts (popup, mobile notification or email). Its main use is to find trend reversals in the chart. Always use the divergence indicators with other technical assets like support resistance zones, candlestick patterns and price action to have a higher possibility to find trend reversals. Three confirmation type for RSI divergences: RSI line cross 50 level (doesn't repaint) Price returns to
FREE

This indicators automatically draws the Trend Channels for you once you've dropped it on a chart. It reduces the hustle of drawing and redrawing these levels every time you analysis prices on a chart. With it, all you have to do is dropped it on a chart, adjust the settings to your liking and let the indicator do the rest. Get an alternative version of this indicator here: https://youtu.be/lt7Wn_bfjPE For more free stuff visit: https://abctrading.xyz
Parameters 1) Which trend do you want t
FREE
False Breakout MT4 is an indicator designed to spot cases where price briefly breaks a recent support or resistance level and then quickly returns to the prior range. These false breakouts are valuable for discretionary analysis or contrarian trading approaches, providing visual cues without making predictive or automatic decisions. Main Features: Automatic detection of false breakouts around recent highs and lows (e.g., extended daily levels over two days). Clear visual representation with arro
FREE
Non-Repainting Indicator dont; s forget this;s work well stronger trend fast markert lower time frame How to trade with SL Scalping Arrow * this system trend trading system we trade 15M chart using day tp,if you want identify Accumulation Distribution (H4) i am reccomend my SL Currency Strength Meter 28 Pair monthy weekly strenght you can easy filter best rank symbol list weekly monthy * we dont;s trade trend change time waiting trade next day pullback * if you want golden entry find. SL Cur

User Manual For more information pm me SL Currency28 Pair Dashboard is even used by the Banks to make profits. They take a strong currency and pitch against a weak currency This strategy i am made my other indicator SL Currency Strength Meter 28 Pair more improvement We can easily study the financial strength of multi-faceted trading SL Currency28 Pair Dashboard strength meter which creates multiple charts in a single window based on the price action of each currency in relation to
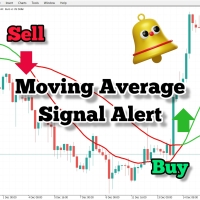
Ultimate Moving Average Crossover Alert Indicator Unlock the power of moving averages with our sophisticated crossover alert indicator, designed to enhance your trading strategy and ensure you never miss a crucial signal. Key Features Our Moving Average Crossover Alert Indicator is essential for traders who rely on moving averages. It not only identifies crossovers but also provides multiple forms of alerts to keep you informed, wherever you are. 1. Real-Time Alerts: Crossover Notifications:
FREE

Description: User_Manual The EZT Trend indicator will show you the trend, the pullback and the entry opportunities. Optional filtering and all type of alerts are available. E-mail and push notification alerts are added. We are also developing an EA based on this indicator, which will be available soon. It is a multi-functional indicator consisting of two color histograms and a line. It is a visual representation of a trend direction and strength, also you will find divergence many times, eithe
Good old UT BOT converted from TradingView script by ' QuantNomad ', initially by ' Yo_adriiiiaan ' and ' HPotter ' - so you can bet this is powerful tool. If you know, you know. This is top of the line, while keeping it really simple.
Main function: trend identification with trend switch points , created by EMA(source) and ATR -source is CLOSE PRICE with option to use HEIKEN ASHI chart instead, for this you need "Heiken Ashi" indicator - its available as free download by MetaQuotes
One of th
FREE

Fair Value Gap Finder detects fair value gaps and generates a signal when price returns to one. Set the minimum and maximum fvg size, customize the colors, style, and length, then let the indicator highlight them for you.
Key Features: Automatic FVG highlights - The indicator detects all fair value gaps that fit your criteria and marks them on the chart.
Entry Signal - A signal is created whenever price retests a fair value gap.
Notification - Alerts notify you when a fair value gap
FREE
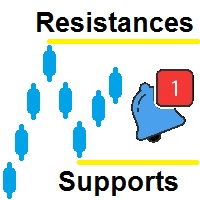
Supports and Resistances, was created to help you identify tops and bottoms automatically on several different timeframes and thus plot these tops and bottoms on the current chart. Let's go to the explanation of the creation of resistances There is a rule field, which you can define what is a top and bottom the top rule is set by default like this: H[ 0 ]<=H[ 1 ] and H[ 1 ]=>H[ 2 ]
Where:
Element Description H means High
[0] means current candle [1] means previous candle <= mean
FREE
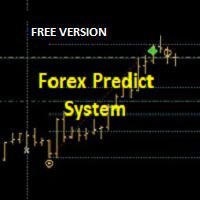
Hi Trader, ================================================================================ If you like my indicator, please do not hesitate to give a review and/or comment. Thank you! ================================================================================
This indicator draws trade entry zone and target levels based on the levels of the previous day.
A blue zone (BUY) or red zone (SELL) is drawn and two targets. The optimal trade entry value is also indicated.
A second gray zone is
FREE

Quants moving average slope is very powerful indicator to give directional indication and momentum. The indicator is not repainting.You can calculate ma angle efficiently and find the trend.
The profit count starts once signal candle is closed. So it is exact results that would be in live.
Suggested TimeFrame is using it on H1. All options of the indicator are editable.
Tips : Trade swing and trend breakout directions. fractals, renko bars and bolinger bands can improve the accuracy and profit
FREE

Ants Lite ATR allows you to enter and manage your trades based on the market volatility, giving you safer entries and better exits. Based on the work by Daryl Guppy.
Features Ability to define the bar the Long and Short calculation starts from. Can be used to generate both entry or exit signals. Customizable ATR period and multiplier. GMMA is a tried and tested indicator with a long pedigree. Volatility based entry and exit signal rather than time based.
How To Use Simply drag the indicator fr

The indicator of the indicators. The Most Powerful Technique to Determine Forex Trend Strength in 2023. We have perfected Supreme Commander that it calculates an average of the selected indicators (up to 16) and the selected timeframe (all) with the result of a single trend that indicates the potential of buying and selling. It includes the following indicators:
Accelerator/Decelerator oscillator Average Directional Movement Index Awesome oscillator; Bulls and Bears Commodity Channel Index; De
The MetaTrader Market is a unique store of trading robots and technical indicators.
Read the MQL5.community User Memo to learn more about the unique services that we offer to traders: copying trading signals, custom applications developed by freelancers, automatic payments via the Payment System and the MQL5 Cloud Network.
You are missing trading opportunities:
- Free trading apps
- Over 8,000 signals for copying
- Economic news for exploring financial markets
Registration
Log in
If you do not have an account, please register
Allow the use of cookies to log in to the MQL5.com website.
Please enable the necessary setting in your browser, otherwise you will not be able to log in.