Regardez les tutoriels vidéo de Market sur YouTube
Comment acheter un robot de trading ou un indicateur
Exécutez votre EA sur
hébergement virtuel
hébergement virtuel
Test un indicateur/robot de trading avant d'acheter
Vous voulez gagner de l'argent sur Market ?
Comment présenter un produit pour qu'il se vende bien
Indicateurs techniques pour MetaTrader 4 - 3

Le Localisateur de Niveaux de Support et de Résistance :
Le Localisateur de Niveaux de Support et de Résistance est un outil avancé conçu pour améliorer l'analyse technique dans le trading. Doté de niveaux dynamiques de support et de résistance, il s'adapte en temps réel à mesure que de nouveaux points clés se dévoilent sur le graphique, offrant ainsi une analyse dynamique et réactive. Sa capacité unique à plusieurs échelles de temps permet aux utilisateurs d'afficher des niveaux de support et
FREE

Gold Venamax - c'est le meilleur indicateur technique boursier. L'algorithme de l'indicateur analyse l'évolution des prix d'un actif et reflète la volatilité et les zones d'entrée potentielles. Caractéristiques de l'indicateur: Il s'agit d'un super indicateur avec Magic et deux blocs de flèches de tendance pour un trading confortable et rentable. Le bouton rouge pour changer de bloc est affiché sur le graphique. La magie est définie dans les paramètres de l'indicateur, afin que vous puissiez

EnergyX Indicator EnergyX is a unique tool that visualizes the "energy" of the market in a separate window. It helps you quickly see when energy is rising or falling, making it easier to spot potential trading opportunities. Yellow bars show when energy is increasing. Red bars show when energy is decreasing. How to Use: When price is approaching a resistance level: If energy is high and increasing (yellow), there is a higher chance the price will break the resistance. You may consider a buy

Si vous aimez ce projet, laissez un examen 5 étoiles. Le prix moyen pondéré en volume est le ratio de la valeur échangée au volume
total
traded over a particular time horizon. C'est une mesure du prix moyen à
qu'un stock est échangé sur l'horizon commercial. VWAP est souvent utilisé comme
un
référence commerciale des investisseurs qui visent à être le plus passif
possible dans leur
exécution. Avec cet indicateur, vous pourrez dessiner le VWAP pour : La journée actuelle. Semaine actuelle. Le m
FREE

Matrix Arrow Indicator MT4 est une tendance unique 10 en 1 suivant un indicateur multi-période 100% non repeint qui peut être utilisé sur tous les symboles/instruments: forex, matières premières, crypto-monnaies, indices, actions. Matrix Arrow Indicator MT4 déterminera la tendance actuelle à ses débuts, en rassemblant des informations et des données à partir d'un maximum de 10 indicateurs standard, qui sont: Indice de mouvement directionnel moyen (ADX) Indice de canal de matières premières (CC

Super Signal – Skyblade Edition
Système de signaux de tendance professionnel sans repaint / sans latence, avec un taux de réussite exceptionnel | Pour MT4 / MT5 Caractéristiques principales : Super Signal – Skyblade Edition est un système de signaux intelligent conçu spécifiquement pour le trading de tendance.
Il utilise une logique de filtrage multicouche pour détecter uniquement les mouvements directionnels forts soutenus par un véritable momentum. Ce système ne cherche pas à prédire les som

Auto Optimized MFI est un indicateur auto-adaptatif qui ajuste automatiquement les niveaux d’achat et de vente du MFI en fonction de votre marché et de votre unité de temps. Contrairement aux seuils fixes classiques (comme 80/20), il utilise des simulations de trades réels sur données historiques pour détecter les zones les plus efficaces, en se basant sur le comportement réel des prix et des volumes. Fonctionnement L’indicateur analyse les chandeliers historiques sur une plage personnalisable e

Currency Strength Meter is the easiest way to identify strong and weak currencies. This indicator shows the relative strength of 8 major currencies + Gold: AUD, CAD, CHF, EUR, GBP, JPY, NZD, USD, XAU. Gold symbol can be changed to other symbols like XAG, XAU etc.
By default the strength value is normalised to the range from 0 to 100 for RSI algorithm: The value above 60 means strong currency; The value below 40 means weak currency;
This indicator needs the data of all 28 major currency pairs a

Was: $299 Now: $99 Supply Demand uses previous price action to identify potential imbalances between buyers and sellers. The key is to identify the better odds zones, not just the untouched ones. Blahtech Supply Demand indicator delivers functionality previously unavailable on any trading platform. This 4-in-1 indicator not only highlights the higher probability zones using a multi-criteria strength engine, but also combines it with multi-timeframe trend analysis, previously confirmed swings
The price is indicated only for the first 30 copies ( only 2 copies left ). The next price will be increased to $150 . The final price will be $250. Sniper Delta Imbalance is a professional tool for deep delta analysis — the difference between buyer and seller volumes. It takes volume analysis to the next level, allowing traders to see in real time who controls the price — buyers or sellers

volatility level indicator is a volatility oscillator to see trend reversal points. price trends has reverese when volatility inreased . this indicator show trend reversal points volatility. mostly same level up and down volatility is reversal points. red colour shows up points of volatilty.and probably trend will down. blue colour oscillator shows deep point of price when increased volatiliyty. on pictures horizontal lines on oscillator has drawed by hand.to see the before level and compare now

Calcul avancé effectué par l'action pure des prix pour trouver les cassures LH et HL.
Cela vous donnera d'excellents points d'inversion sur le marché.Les signaux LH et HL peuvent également être utilisés pour les évasions de traingle.
Une fois que la cassure se produit, cela indique un fort renversement.Beau filtre pour les moyennes mobiles.Je suggère fortement de l'utiliser avec des indicateurs de tendance.
Peut être utilisé comme une confirmation supplémentaire pour le support et la résistanc

Currently switched to the 4 hour chart - but use other time frames for confirmation. :-) I change my main time frame based on the market movement at the time. The Hurricane Forex Indicator is a multi time frame indicator that includes such things as Trade Notifications, Trade Calculator, Momentum Indicator, risk reward and much more. We have a free Trade room for our users as well. Please check out the video for full details of how this indicator works as it has over 15 years worth of developme

This indicator is another variant of the famous powerful indicator Fibonacci-SS https://www.mql5.com/en/market/product/10136 but has different behaviour in placing Pending Order and TP Line. Automatically places Fibonacci retracement lines from the last highest and lowest visible bars on the chart with: An auto Pending Order (Buy/Sell). Taking Profit 1, Taking Profit 2 is pivot point and Taking Profit 3 for extended reward opportunity. The best risk and reward ratio.
Simple and powerful indicat

Contact me after payment to send you the user manual PDF file. Introduction The moving average indicator is the most well-known and one of the most popular indicators among traders. It is very simple to work with, but a basic question has always become a big challenge among traders: What is the most optimal setting of the moving average for each chart-time frame? The answer to this question is very difficult, you have to try different settings of the moving average indicator for different chart
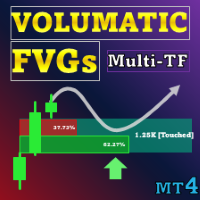
Offre spéciale : ALL TOOLS , seulement $35 chacun ! Les nouveaux outils seront à $30 pendant la première semaine ou pour les 3 premiers achats ! Trading Tools Channel on MQL5 : Rejoignez ma chaîne MQL5 pour recevoir mes dernières actualités Volumatic Fair Value Gaps (FVG) identifie et maintient des zones significatives de déséquilibre de prix et décompose le volume directionnel au sein de chaque gap. Le volume est échantillonné depuis une unité de temps inférieure (M1 par défaut, s
L'indicateur Trend Line PRO est une stratégie de trading indépendante. Il montre le changement de tendance, le point d'entrée de la transaction, ainsi que le calcul automatique de trois niveaux de protection Take Profit et Stop Loss. Trend Line PRO est parfait pour tous les symboles Meta Trader : devises, métaux, crypto-monnaies, actions et indices.
L'indicateur est utilisé dans le trading sur des comptes réels, ce qui confirme la fiabilité de la stratégie.
Pour le moment, l'indicateur

Objectif principal: "Pin Bars" est conçu pour détecter automatiquement les barres pin sur les graphiques des marchés financiers. Une barre d'épingle est une bougie avec un corps caractéristique et une longue queue, qui peut signaler un renversement ou une correction de tendance.
Comment ça marche: L'indicateur analyse chaque bougie sur le graphique, déterminant la taille du corps, de la queue et du nez de la bougie. Lorsqu'une barre d'épingle correspondant à des paramètres prédéfinis est détec
FREE

Gartley Hunter Multi - An indicator for searching for harmonic patterns simultaneously on dozens of trading instruments and on all classic timeframes: (m1, m5, m15, m30, H1, H4, D1, Wk, Mn). Manual (Be sure to read before purchasing) | Version for MT5 Advantages 1. Patterns: Gartley, Butterfly, Shark, Crab. Bat, Alternate Bat, Deep Crab, Cypher
2. Simultaneous search for patterns on dozens of trading instruments and on all classic timeframes
3. Search for patterns of all possible sizes. From t
Delta Fusion Pro – Analyse Avancée du Flux d’Ordres pour le Trading Intraday
Delta Fusion Pro est un indicateur professionnel pour MetaTrader 4 qui révèle le flux des ordres agressifs, en affichant l’intensité et la direction de la pression institutionnelle en temps réel. Contrairement aux indicateurs volumétriques traditionnels, il analyse la delta entre les volumes Ask et Bid afin d’anticiper les retournements, confirmer les tendances et identifier les zones d’intérêt professionnel. Caractér

Bandes de Bollinger Auto-Optimisées – Outil de volatilité adaptatif basé sur le comportement réel du marché Cet indicateur avancé pour MT4 trouve automatiquement les meilleures périodes et écarts-types en simulant les trades sur les données historiques. Au lieu de paramètres fixes, il s’adapte dynamiquement aux changements du marché et à la structure des prix pour créer des bandes qui reflètent plus précisément la volatilité en temps réel. Pas besoin d’ajustements manuels. Fonctionnalités princi

Version MT4 : https://www.mql5.com/en/market/product/125434
Version MT5 : https://www.mql5.com/en/market/product/157662
Assistant MT4 : https://www.mql5.com/en/market/product/107986
Rally Base Rally (RBR), Drop Base Rally (DBR), Drop Base Drop (DBD), Rally Base Drop (RBD), Fair Value GAP (FVG) / Déséquilibre, Base cachée
Découvrez l'indicateur « Supply Demand MT4 » : l'outil idéal pour naviguer avec précision et confiance dans l'univers dynamique des marchés financiers. Cet indicateur de po
FREE

Special offer : ALL TOOLS , just $35 each! New tools will be $30 for the first week or the first 3 purchases ! Trading Tools Channel on MQL5 : Join my MQL5 channel to update the latest news from me Découvrez la puissance du concept Inversion Fair Value Gap (IFVG) de l’ICT avec l’ Indicateur Inversion Fair Value Gaps ! Cet outil de pointe pousse les Fair Value Gaps (FVG) à un niveau supérieur en identifiant et affichant les zones de FVG inversées — des zones clés de support et de ré

The "Gold Trader Pro Indicator" is an advanced technical analysis tool for the MetaTrader 4 platform, designed to help you make informed trading decisions about gold. Using a combination of moving averages, RSI, ADX, MACD, and volume analysis, this indicator provides clear trading signals across multiple timeframes, including M5, M15, M30, H1, H4, and D1. My indicators for free. I only ask that leave your feedback to help me improve them or as a thank you. Have a good trade! Main Features Multi
FREE
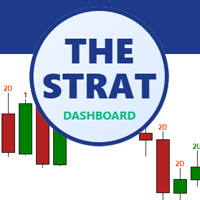
The Strat Dashboard – Scanner de Patrons Multi-Symboles pour la stratégie Strat de Rob Smith
Transformez votre trading avec une Analyse Strat en temps réel sur plusieurs symboles
Le The Strat Dashboard est un indicateur puissant et professionnel conçu spécifiquement pour les traders utilisant la méthodologie « Strat » de Rob Smith. Surveillez un nombre illimité de symboles sur plusieurs intervalles de temps simultanément, identifiez instantanément des setups à forte probabilité et ne manquez j

Royal Scalping Indicator is an advanced price adaptive indicator designed to generate high-quality trading signals. Built-in multi-timeframe and multi-currency capabilities make it even more powerful to have configurations based on different symbols and timeframes. This indicator is perfect for scalp trades as well as swing trades. Royal Scalping is not just an indicator, but a trading strategy itself. Features Price Adaptive Trend Detector Algorithm Multi-Timeframe and Multi-Currency Trend Low

Introducing Volume Orderflow Profile , a versatile tool designed to help traders visualize and understand the dynamics of buying and selling pressure within a specified lookback period. Perfect for those looking to gain deeper insights into volume-based market behavior! MT5 Version - https://www.mql5.com/en/market/product/122657 The indicator gathers data on high and low prices, along with buy and sell volumes, over a user-defined period. It calculates the maximum and minimum prices during this
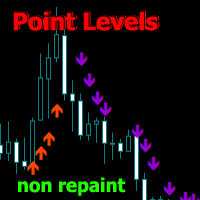
Point Directions - Un indicateur montrant les niveaux ponctuels de support et de résistance lorsque le prix bouge. Les flèches indiquent les rebonds de prix dans les directions indiquées.
Les flèches ne sont pas redessinées, elles se forment sur la bougie courante. Fonctionne sur tous les délais et instruments de trading. Il existe plusieurs types d'alertes.
Possède des paramètres avancés pour personnaliser les signaux de n'importe quel graphique. Peut être configuré pour négocier avec la tenda
SL Curruncy impulse https://www.mql5.com/en/market/product/82593 SL Session Strength 28 Pair flow of this intraday Asian London New York Sessions strength.SL Session Strength 28 indicator best for intraday scalper. market powerful move time you can catch best symbol. because you'll know which currencies are best to trade at that moment. Buy strong currencies and sell weak currencies (Diverging currencies). Suggested timeframes to trading : M5 - M15 - M30 - You can however just change session

Special offer : ALL TOOLS , just $35 each! New tools will be $30 for the first week or the first 3 purchases ! Trading Tools Channel on MQL5 : Join my MQL5 channel to update the latest news from me Nous vous présentons le RSI Kernel Optimized with Scanner, un outil révolutionnaire qui redéfinit l'analyse RSI traditionnelle en intégrant l'algorithme puissant de l'estimation de densité par noyau (KDE). Cet indicateur avancé fournit non seulement des informations en temps réel sur les
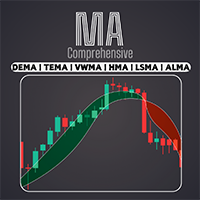
Accédez à une large gamme de moyennes mobiles, y compris EMA, SMA, WMA, et bien d'autres avec notre indicateur professionnel Comprehensive Moving Average . Personnalisez votre analyse technique avec la combinaison parfaite de moyennes mobiles pour répondre à votre style de trading unique / Version MT5
Caractéristiques
Possibilité d'activer deux moyennes mobiles avec des paramètres différents. Possibilité de personnaliser les paramètres du graphique. Possibilité de changer la couleur des chande
FREE

Vivez une expérience de trading comme jamais auparavant avec notre indicateur MT4 Fair Value Gap (FVG) inégalé
Considéré comme le meilleur de sa catégorie, cet indicateur de marché MQL5 sort de l'ordinaire.
offrant aux traders un niveau inégalé de précision et de compréhension de la dynamique du marché. Version EA : WH Fair Value Gap EA MT4
Indicateur basé sur SMC : WH SMC Indicator MT4 Caractéristiques:
Meilleure analyse de l’écart de juste valeur de sa catégorie. Prise en charge de plusi
FREE
Cette VWAP est une VWAP simple, mais nous avons intégré des notifications qui vous informent lorsque le prix atteint ou traverse la ligne de la VWAP. Cet indicateur est un indicateur VWAP traditionnel pour MetaTrader 4 (MT4). Les paramètres par défaut sont ceux de la VWAP normale, mais vous avez la possibilité de modifier le calcul de la VWAP et, mieux encore : Lorsque le prix touche ou traverse la VWAP, vous en serez informé par des alertes, des notifications sur votre téléphone portable, des e
FREE

The Fair Value Gap (FVG) is a price range where one side of the market liquidity is offered, typically confirmed by a liquidity void on the lower time frame charts in the same price range. Price can "gap" to create a literal vacuum in trading, resulting in an actual price gap. Fair Value Gaps are most commonly used by price action traders to identify inefficiencies or imbalances in the market, indicating that buying and selling are not equal. If you're following the ICT Trading Strategy or Smart
FREE
The indicator allows you to instantly determine the current trend by color and FIBO levels. Higher Timeframe the panel shows the current trend of higher periods, helping to determine the strength of the trend Trade according to the trend when changing the color of candles or trade against the trend when the price hit the extreme levels of the FIBO Trend PRO indicator Advantages of the FIBO Trend PRO
Indicator never repaint and does not change their values Very easy to use and intuitive

IX Power : Découvrez des insights de marché pour les indices, matières premières, cryptomonnaies et forex Vue d’ensemble
IX Power est un outil polyvalent conçu pour analyser la force des indices, matières premières, cryptomonnaies et symboles forex. Tandis que FX Power offre une précision maximale pour les paires de devises en utilisant toutes les données disponibles, IX Power se concentre exclusivement sur les données du symbole sous-jacent. Cela fait de IX Power un excellent choix pour les m

The official release price is $65 only for the first 10 copies, ( only 2 copies left ). Next price: $125 Gold Scalper System is a multifunctional trading system that combines a breakout strategy for key liquidity levels with confirmation and a built-in Smart DOM Pro module for market depth analysis. The system identifies zones of limit order accumulat

The indicator is a trading system for short-term trading.
Scalper Assistant helps to determine the direction of the transaction, and also shows the entry and exit points.
The indicator draws two lines (possible points for opening positions).
At the moment of the breakdown of the upper line up (and when all trading conditions are met), an up arrow appears (a buy signal), as well as 2 goals.
At the moment of the breakdown of the lower line down (and when all trading conditions are met), a down ar

ACTUELLEMENT 20% DE RÉDUCTION !
La meilleure solution pour tout débutant ou trader expert !
Cet indicateur est un outil de trading abordable car nous avons incorporé un certain nombre de caractéristiques exclusives ainsi qu'une nouvelle formule.
L'Indicateur Avancé de Volume Accumulé de Devises est spécialisé pour les 28 principales paires Forex et fonctionne sur tous les cadres temporels. Il s'agit d'une nouvelle formule qui, sur un seul graphique, extrait tout le volume des devises (C-Volu

What indicator do you look at most on your MT4 charts? Is it the Moving Average? I d o not believe that the default grid lines on MT4 charts—which you likely see hundreds or thousands of times—are designed with the intent of helping the user win. This is why MT4 users apply various indicators and go through trial and error. Because it is a chart you look at every day, it must present reliable information that we humans can recognize intuitively. This indicator was born from a single core concep

Special offer : ALL TOOLS , just $35 each! New tools will be $30 for the first week or the first 3 purchases ! Trading Tools Channel on MQL5 : Join my MQL5 channel to update the latest news from me L'indicateur Volumetric Order Blocks Multi Timeframe est un outil puissant conçu pour les traders cherchant à obtenir des informations approfondies sur le comportement du marché en identifiant les zones clés de prix où les participants importants accumulent des ordres. Ces zones, connues

Guide d'utilisation du Candle Probability Scalper Ce indicateur rend le scalping facile et 100% intuitif. Candle Probability Scalper vous montrera en un coup d'œil les pourcentages de force des acheteurs et des vendeurs en TEMPS RÉEL sur la bougie actuelle. Les pourcentages sont mis à jour à chaque tick, ce qui signifie que vous saurez, seconde après seconde, ce que fait la majorité des acheteurs et des vendeurs, sans aucun délai. Cela vous aidera énormément à déterminer ou à confirmer la force

BinaryIndicator is a highly accurate indicator for trading binary options. It shows excellent results in scalping. This indicator is based in multifactor analysis of trend indicators, as well as confirmation oscillators, which in the end gives an increased accuracy of signals.
Advantages of the indicator Increased accuracy of signals. Excellent results when trading binary options with a short expiration time from M30 to M1 . It works on any timeframes. Works with any trade symbols.
Parameters
Offre spéciale : TOUS LES OUTILS , seulement 35 $ chacun ! Les nouveaux outils seront à 30 $ pendant la première semaine ou pour les 3 premiers achats ! Chaîne Trading Tools sur MQL5 : rejoignez ma chaîne MQL5 pour recevoir mes dernières actualités Stochastic Z-Score est un oscillateur de momentum qui normalise le prix avec un Z-Score, le borne via une logique stochastique et le lisse avec HMA, tandis que ALMA apporte un contexte long terme. Éléments optionnels : histogramme, band
SEE THE TREND ON EVERY TIME FRAME. INTELLIGENT INDICATOR READS PRICE ACTION TO SPOT TRUE MARKET CYCLES AND TREND. This advanced multi-currency and multi-time frame indicator, reads trend in real-time so you always know the trends of the markets you want to trade.
Trend-Viewer Pro has been specifically designed to read the trend of every time frame and every market , simultaneously, making it much easier for you to find markets with time frame correlation , so you can focus on the best markets

Hydra Trend Rider is a non-repainting, multi-timeframe trend indicator that delivers precise buy/sell signals and real-time alerts for high-probability trade setups. With its color-coded trend line, customizable dashboard, and mobile notifications, it's perfect for traders seeking clarity, confidence, and consistency in trend trading. Setup & Guide: Download MT5 Version here. To learn how to use the Indicator: Indicator Manual & Guide - Read Here
Exclusively for you: It's your chance to st
Speed Trend Matrix Ultimate (Version 5.10) Le Speed Trend Matrix (STM) est un système de trading complet encapsulé dans un seul indicateur. Contrairement aux oscillateurs standard qui montrent simplement les conditions de surachat ou de survente, le STM analyse la « vitesse » du mouvement des prix par rapport à la volatilité du marché (ATR). Il identifie non seulement la direction de la tendance, mais aussi la force derrière le mouvement, filtrant les périodes « plates » de faible élan où les tr
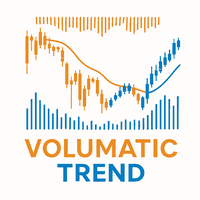
Volumatic Trend is a powerful, trend-following indicator that merges directional analysis with real-time volume behavior. By combining adaptive trend logic and volume overlays, it gives traders a detailed snapshot of market conviction and potential turning points. From instant trend shift detection to volume-weighted candle visuals, this tool brings deeper context to price movement. MT5 Version - https://www.mql5.com/en/market/product/136211/ Join To Learn Market Depth - https://www.mql5.com/
FREE

Support And Resistance Screener est dans un indicateur de niveau pour MetaTrader qui fournit plusieurs outils à l'intérieur d'un indicateur. Les outils disponibles sont : 1. Filtre de structure de marché. 2. Zone de repli haussier. 3. Zone de recul baissier. 4. Points pivots quotidiens 5. points pivots hebdomadaires 6. Points pivots mensuels 7. Support et résistance forts basés sur le modèle harmonique et le volume. 8. Zones au niveau de la banque. OFFRE D'UNE DURÉE LIMITÉE : L'indicateur de sup
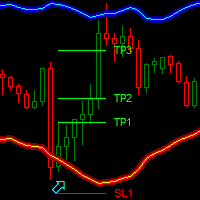
Dark Bands is an Indicator for intraday trading. This Indicator is based on Counter Trend strategy but use also Volatility. We can enter in good price with this Indicator, in order to follow the inversions on the current instrument.
Key benefits
Easily visible take profit/stop loss lines Reliable bands lines with futuristic colors, and Intuitive directional arrows Useful statistics , which indicate the win rate of the signals Plus Package available, leave a feedback to receive
FREE

The Area of Interest (AOI) Indicator is a powerful tool designed to help traders identify key market zones where price reactions are highly probable. This indicator specifically highlights two critical zones: Seller AOI (Area of Interest) : This zone represents areas where sellers are likely to enter the market, often acting as resistance. When the price approaches or touches this zone, it signals that a potential sell-off could occur. Buyer A OI (Area of Interest) : The BOI zone identifies re
FREE

ICT, SMC, SMART MONEY CONCEPTS, SMART MONEY, Smart Money Concept, Support and Resistance, Trend Analysis, Price Action, Market Structure, Order Blocks, BOS/CHoCH, Breaker Blocks , Momentum Shift, Supply&Demand Zone/Order Blocks , Strong Imbalance, HH/LL/HL/LH, Fair Value Gap, FVG, Premium & Discount Zones, Fibonacci Retracement, OTE, Buy Side Liquidity, Sell Side Liquidity, BSL/SSL Taken, Equal Highs & Lows, MTF Dashboard, Multiple Time Frame, BigBar, HTF OB, HTF Market Structure,
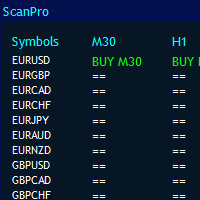
MT4 Universal Panel pro est conçu pour tous les indicateurs et délais, y compris les fichiers ex4.
Il peut analyser des paires illimitées en fonction de la puissance de votre ordinateur et jusqu'à 10 périodes. La taille du panneau sera arrangée automatiquement.
vous pouvez appeler n'importe quel indicateur par buffers.
Cela fonctionne pour tous les indicateurs par défaut et personnalisés. Vous pouvez simplement l'utiliser pour heikan ashi, rsi, parabolique, renko, fractales, résistance de s

My Intraday trading session indicator. SL Session Strength 28 Pair https://www.mql5.com/en/market/product/57585 This strategy is even used by the Banks to make profits. They take a strong currency and pitch against a weak currency This indicator allows you to analyze the hidden trends and correlations between the 8 most traded currencies via unique strength meter which creates multiple charts in a single window based on the price action of each currency in relation to all other currenci

Découvrez le secret pour réussir le trading Forex avec notre indicateur MT4 personnalisé!
Strategy with RangeBars https://youtu.be/jBaDCAPTtHc
Vous êtes-vous déjà demandé comment réussir sur le marché du Forex, gagnant régulièrement des bénéfices tout en minimisant les risques? Voici la réponse que vous avez recherchée! Permettez-nous d'introduire notre indicateur MT4 propriétaire qui révolutionnera votre approche du trading.
Polyvalence unique
Notre indicateur est spécialement conçu pour les

The Currency Index indicator enables traders to display any index of eight major currencies. It uses a special calculation that considers specific currency pairs and their weights.
The default weights are based on the BIS Triennial Central Bank Survey results. Because of this advantage, the trader can see each currency's true strength and weakness.
Note: If the indicator is used in Strategy Tester (demo version), please keep in mind that all currency pairs' data must be downloaded in History

Supply Demand Analyzer is an advanced trading indicator meticulously designed for the precise identification, analysis, and management of supply and demand zones. By integrating real-time data and advanced algorithms, this tool enables traders to recognize market phases, price movements, and structural patterns with unparalleled accuracy. It simplifies complex market dynamics into actionable insights, empowering traders to anticipate market behavior, identify trading opportunities, and make info

Special offer : ALL TOOLS , just $35 each! New tools will be $30 for the first week or the first 3 purchases ! Trading Tools Channel on MQL5 : Join my MQL5 channel to update the latest news from me Volumatic VIDYA (Variable Index Dynamic Average) est un indicateur avancé conçu pour suivre les tendances et analyser la pression d'achat et de vente à chaque phase d'une tendance. En utilisant la Moyenne Dynamique à Indice Variable (Variable Index Dynamic Average) comme technique centra

Auto Optimized RSI : Adaptation Professionnelle au Marché La plupart des traders échouent parce qu'ils utilisent des outils statiques dans un marché dynamique. Utiliser des niveaux RSI fixes comme 70/30 sur chaque graphique est une erreur mathématique. Si vous recherchez une « flèche magique » sans logique, cet indicateur n'est pas pour vous. Cet outil est conçu pour ceux qui comprennent que l'Optimisation est la seule clé pour survivre dans le trading. Les indicateurs classiques ne tiennent pas
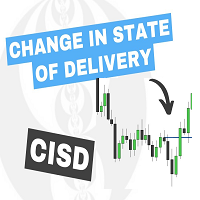
The Change In State Of Delivery (CISD) indicator detects and displays Change in State Of Delivery, a concept related to market structures.
Users can choose between two different CISD detection methods. Various filtering options are also included to filter out less significant CISDs.
USAGE Figure 2 A Change in State of Delivery (CISD) is a concept closely related to market structures, where price breaks a level of interest, confirming trends and their continuations from the resulting

MT5 version | Indicateur Owl Smart Levels | Stratégie Owl Smart Levels | FAQ L'indicateur Fractals est l'un des éléments de la stratégie commerciale de l'auteur de Bill Williams . Il est utilisé pour rechercher des points d'inversion des prix sur le graphique des prix et, par conséquent, des niveaux de support et de résistance. L'indicateur Full Fractals est un Fractals amélioré qui est disponible dans la boîte à outils de presque tous les terminaux de trading. Sa seule différence est qu
FREE

MT4 Multi-timeframe Order Blocks detection indicator. Features - Fully customizable on chart control panel, provides complete interaction. - Hide and show control panel wherever you want. - Detect OBs on multiple timeframes. - Select OBs quantity to display. - Different OBs user interface. - Different filters on OBs. - OB proximity alert. - ADR High and Low lines. - Notification service (Screen alerts | Push notifications). Summary Order block is a market behavior that indicates order collection
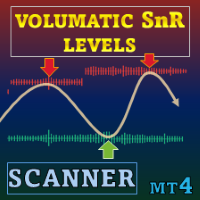
Offre spéciale : ALL TOOLS , seulement $35 chacun ! Nouveaux outils à $30 pendant la première semaine ou les 3 premiers achats ! Trading Tools Channel on MQL5 : Rejoignez mon canal MQL5 pour recevoir les dernières nouvelles Volumatic Support/Resistance Levels Scanner est un indicateur de support/résistance qui ajoute un contexte de volume à la structure des prix. En montrant comment l’activité de trading se concentre autour des pivots récents, il aide les utilisateurs à voir où

L'indicateur affiche le profil de volume horizontal dans la zone spécifiée (BOX) et le volume maximum (POC).
Caractéristiques du produit. 1. Vous pouvez utiliser des ticks ou simplement le prix. 2. Espacement de grille adaptatif (M1-MN). 3. Étape de recherche adaptative à volume élevé (médian) en fonction de la taille de la boîte. 4. Couleur caméléon automatique pour les lignes de boîte et les boutons. 5. Plusieurs boîtes, faciles à créer et à supprimer. 6. Zone de volume de 70 % (activer dans

Aperçu du produit gratuit mais avancé Turbo Trend est un indicateur puissant conçu pour aider les traders à identifier et à agir sur les tendances du marché. Il utilise une combinaison de moyennes mobiles avancées et d'analyse de volume pour fournir des signaux clairs sur la direction des tendances. Turbo Trend simplifie la prise de décision en catégorisant les conditions du marché en trois états distincts : Tendance haussière , Tendance baissière et Tendance neutre, en utilisant des lignes et
FREE

La plage quotidienne moyenne montre la plage de pip moyenne d'une paire Forex mesurée sur un certain nombre de périodes. Les traders peuvent utiliser l'ADR pour visualiser l'action potentielle des prix en dehors du mouvement quotidien moyen. Lorsque l'ADR est supérieur à la moyenne, cela signifie que la volatilité quotidienne est plus élevée que d'habitude, ce qui implique que la paire de devises peut s'étendre au-delà de sa norme.
Notre ADR Analyzer est composé de 5 fonctionnalités principale

Chaque acheteur de l’indicateur Scalping signals M1 reçoit GRATUITEMENT un robot de trading automatique qui exécute les signaux de l’indicateur de manière totalement autonome. Scalping signals M1 — système complet d’entrées en tendance pour le M1 Scalping signals M1 transforme le graphique en une carte d’action claire :
le canal de tendance coloré indique la direction du marché, et les flèches marquent les points d’entrée potentiels.
Il suffit de suivre la direction du canal et les flèches — mêm
Binary Trader Master est un indicateur basé sur une flèche qui prédit la clôture de la bougie. Il fait son analyse dans une seule bougie. Lorsque la bougie s'ouvre, il faut quelques instants pour faire l'analyse et prédire la fermeture de la bougie. Ensuite, il génère un signal. L'indicateur vous permet également d'appliquer des limites de temps qu'il peut utiliser pour l'analyse, ce qui signifie que vous pouvez réellement dire à l'indicateur combien de temps il est autorisé à avoir pour l'analy

Cet indicateur est un outil simple mais extrêmement fiable pour prédire la direction de la tendance, conçu pour les traders qui préfèrent des signaux propres et précis plutôt que des graphiques bruyants. Caractéristiques principales Flèches de prédiction de tendance – signaux d’Achat/Vente clairs basés sur l’action du prix et le flux de tendance. Signaux peu fréquents mais très précis – en moyenne un signal par jour, avec une excellente fiabilité. Signaux de sortie intégrés – les flèches Exit in

Offre spéciale : ALL TOOLS , seulement $35 chacun ! Nouveaux outils seront à $30 pendant la première semaine ou pour les 3 premiers achats ! Trading Tools Channel on MQL5 : Rejoignez mon canal MQL5 pour suivre mes dernières actualités Liquidation Reversal Signals est un indicateur conçu pour marquer des phases de liquidation directionnelles et confirmer des points de retournement en combinant des extrêmes de volume en Z-score avec des changements d’état de Supert
MetaTrader Market - les robots de trading et les indicateurs techniques pour les traders sont disponibles directement dans votre terminal de trading.
Le système de paiement MQL5.community est disponible pour tous les utilisateurs enregistrés du site MQL5.com pour les transactions sur les Services MetaTrader. Vous pouvez déposer et retirer de l'argent en utilisant WebMoney, PayPal ou une carte bancaire.
Vous manquez des opportunités de trading :
- Applications de trading gratuites
- Plus de 8 000 signaux à copier
- Actualités économiques pour explorer les marchés financiers
Inscription
Se connecter
Si vous n'avez pas de compte, veuillez vous inscrire
Autorisez l'utilisation de cookies pour vous connecter au site Web MQL5.com.
Veuillez activer les paramètres nécessaires dans votre navigateur, sinon vous ne pourrez pas vous connecter.