Guarda i video tutorial del Market su YouTube
Come acquistare un Robot di Trading o un indicatore
Esegui il tuo EA
hosting virtuale
hosting virtuale
Prova un indicatore/robot di trading prima di acquistarlo
Vuoi guadagnare nel Market?
Come presentare un prodotto per venderlo con successo
Indicatori tecnici per MetaTrader 4 - 3

Il rilevatore di terremoti del mercato del sismografo. Description in English :
https://www.mql5.com/en/market/product/113869?source=Site+Market+Product+Page#description How to use the Seismograph :
https://www.mql5.com/en/market/product/113869#!tab=comments&page=2&comment=52806941
Create an EA :
https://www.mql5.com/en/market/product/113869#!tab=comments&page=3&comment=52816509
Qualunque sia il modo in cui fai trading, vuoi assolutamente evitare di entrare nel mercato a bassa liquidità.

Sistema di trading intelligente. Tutti i tempi, le valute, le criptovalute, i metalli... Tutto l'MT4 e qualsiasi schermata e modello vengono configurati automaticamente. Un principiante effettuerà semplicemente scambi in base a un segnale. I parametri di un algoritmo flessibile unico sono aperti nelle impostazioni .
Idea 1: Oltre a "ACQUISTA/VENDI", nei punti estremi viene fornito il segnale "OTTIENI PROFITTO". Questa tattica aumenta il risultato: hai profitti quando sono massimi e hai più tra

Introduction to Fractal Pattern Scanner Fractal Indicator refers to the technical indicator that makes use of the fractal geometry found in the financial market. Fractal Pattern Scanner is the advanced Fractal Indicator that brings the latest trading technology after the extensive research and development work in the fractal geometry in the financial market. The most important feature in Fractal Pattern Scanner is the ability to measure the turning point probability as well as the trend probabi

Over 100,000 users on MT4 and MT5 Blahtech Candle Timer displays the remaining time before the current bar closes and a new bar forms. It can be used for time management Links [ Install | Update | Training ] Feature Highlights
The only candle timer on MT4 with no stutter and no lag S electable Location Tracks server time not local time Multiple colour Schemes Configurable Text Customisable alerts and messages Optimised to reduce CPU usage Input Parameters Text Location - Beside / Upper
FREE

The indicator of the indicators. The Most Powerful Technique to Determine Forex Trend Strength in 2023. We have perfected Supreme Commander that it calculates an average of the selected indicators (up to 16) and the selected timeframe (all) with the result of a single trend that indicates the potential of buying and selling. It includes the following indicators:
Accelerator/Decelerator oscillator Average Directional Movement Index Awesome oscillator; Bulls and Bears Commodity Channel Index; De

TPSproTrend PRO - si tratta di un indicatore di tendenza che analizza automaticamente il mercato e fornisce informazioni sulla tendenza e sui suoi cambiamenti, oltre a visualizzare i punti di ingresso per le negoziazioni senza ridisegnare!
ИНСТРУКЦИЯ RUS - ISTRUZIONI ITA - VERSIONE MT5 Funzioni principali: Segnali di ingresso precisi SENZA RIVERNICIARE! Una volta che un segnale appare, rimane valido! Questa è una differenza significativa rispetto alla rielaborazione
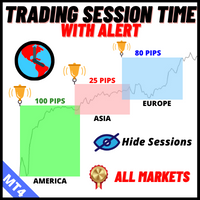
L'Indicatore del Tempo delle Sessioni di Trading:
L'Indicatore del Tempo delle Sessioni di Trading è uno strumento potente di analisi tecnica progettato per migliorare la comprensione delle diverse sessioni di trading nel mercato forex. Questo indicatore integrato in modo trasparente fornisce informazioni cruciali sugli orari di apertura e chiusura delle principali sessioni, tra cui Tokyo, Londra e New York. Con l'aggiustamento automatico del fuso orario, si rivolge ai trader di tutto il mondo
FREE

After your purchase, feel free to contact me for more details on how to receive a bonus indicator called VFI, which pairs perfectly with Easy Breakout for enhanced confluence!
Easy Breakout is a powerful price action trading system built on one of the most popular and widely trusted strategies among traders: the Breakout strategy ! This indicator delivers crystal-clear Buy and Sell signals based on breakouts from key support and resistance zones. Unlike typical breakout indicators, it levera
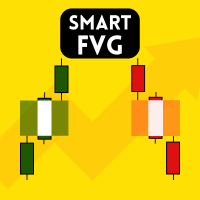
Indicatore Smart FVG MT4 – Rilevamento Avanzato del Fair Value Gap per MetaTrader 4 L'indicatore Smart FVG per MetaTrader 4 offre rilevamento, monitoraggio e avvisi professionali dei Fair Value Gap (FVG) direttamente sui tuoi grafici. Combina un filtro basato sull'ATR con una logica sensibile alla struttura per eliminare il rumore, adattarsi alla liquidità e mantenere solo gli squilibri più rilevanti per decisioni operative precise.
Vantaggi principali Rilevamento accurato degli FVG: individua
FREE
Summer Sale: 50% OFF!!! Promotion is valid until 08 August 2025! This indicator is unstoppable when combined with our other indicator called Katana. After purchase, send us a message and you could get Katana for FREE as a BONUS After purchase, send us a private message for your instructions. The Trend Forecasting indicator is a very unique & easy tool that is able to make prediction about future price movement based on the signals generated by MACD . It helps you have an estimation on the are
It is a tool for technical analysis. It allows you to make measurements: Fibo, including the search for clusters Fibo levels (by the DiNapoli method) Overbalance Trend line Selecting S/D levels
Input parameters Trend_Color - color of the trend line Trend_Width - width of the trend line Trend_info - if true, along with the trend line additional information is displayed (low, high, medium of the trend line) Trend_info_color_up_dn - color of the text describing the trend line Trend_info_font_up_dn

The Supply and Demand Zones indicator is one of the best tools we have ever made. This great tool automatically draws supply and demand zones, the best places for opening and closing positions. It has many advanced features such as multi timeframe zones support, displaying the width of zones, alert notifications for retouched zones, and much more. Because of market fractality, this indicator can be used for any kind of trading. Whether you are a positional, swing, or intraday trader does not ma

Un pattern grafico a triangolo simmetrico rappresenta un periodo di contrazione e consolidamento prima che il prezzo sia costretto a superare il rialzo o il crollo. Una rottura dalla linea di tendenza inferiore segna l'inizio di una nuova tendenza ribassista, mentre una rottura dalla linea di tendenza superiore indica l'inizio di una nuova tendenza rialzista. Ottieni la dashboard per monitorare contemporaneamente tutti gli strumenti e i periodi di tempo che scambi con schemi triangolari simmetr

Apollo BuySell Predictor è un sistema di trading professionale che include diversi moduli di trading. Fornisce a un trader zone di breakout uniche, livelli di supporto e resistenza basati su Fibonacci, linea di tendenza pivot, segnali di volume di pullback e altre funzioni utili di cui ogni trader ha bisogno su base giornaliera. Il sistema funzionerà con qualsiasi coppia. I tempi consigliati sono M30, H1, H4. Sebbene l'indicatore possa funzionare anche con altri intervalli di tempo, ad eccezione

Se ti piace questo progetto, lascia una recensione a 5 stelle. Il prezzo medio ponderato del volume è il rapporto tra il valore scambiato e il
volume totale
scambiato su un particolare orizzonte temporale. Si tratta di una misura del
prezzo medio al
che uno stock è scambiato sull'orizzonte di trading. VWAP è spesso usato come
trading benchmark da parte di investitori che mirano ad essere il più passivo
possibile nel loro
esecuzione. Con questo indicatore sarete in grado di disegnare il VWAP p
FREE

Gold Trader Pro Indicator is an advanced multi-timeframe indicator specifically designed for XAUUSD and compatible with all major forex pairs: EURUSD, USDJPY, GBPUSD, USDCHF, AUDUSD, NZDUSD, and USDCAD. This tool provides reliable trading signals by combining multiple technical indicators, including EMA, RSI, ADX, MACD, Bollinger Bands, and Volume SMA. It is ideal for traders looking to analyze multiple timeframes (M5, M15, M30, H1, H4, and D1) and confirm signals using various conditions.
Key
FREE

无重绘、无滞后。 修正趋势步长 (CTS) 是由 A. Uhl 设计的一种快速自适应移动平均线,旨在作为交易中的响应指标,通常与速度较慢的修正移动平均线 (CMA) 结合使用,构建交叉系统。它能够适应市场波动,从而减少横盘整理或区间震荡行情中的虚假信号。
修正趋势步长的关键特性包括:
目的:旨在通过调整以适应当前价格走势,从而改进传统的移动平均线。
方法:基于指数平均,它最大限度地减少了传统平均线在非趋势市场中产生虚假交叉的问题。
功能:它被设计为完整交叉系统中的“快速”自适应组件。 • 更贴近价格 • 更适合作为 快线 • 在趋势中反应迅速 • 在震荡中自动“钝化” InpLength (14) : 计算方差的周期,默认100。与 CMA 配合使用时常用相同周期或更短周期 InpMult (1.0) : 乘数,通常保持1.0 InpPrice (PRICE_CLOSE) : 应用价格类型,可选择收盘价、开盘价、高低点等

What is a Point of Interest? Traders who follow Smart Money Concepts may call this a Liquidity Point, or where areas of liquidity have been built up by retail traders for for Big Banks to target to create large price movements in the market. As we all know, retail traders that use outdated and unreliable methods of trading like using trendlines, support and resistance, RSI, MACD, and many others to place trades and put their stop losses at keys points in the market. The "Big Banks" know these me

ATTUALMENTE SCONTATO DEL 26%!!
Questo indicatore è una super combinazione di entrambi i nostri indicatori principali ( Advanced Currency Strength 28 & Advanced Currency IMPULSE with ALERT ). Mostra i valori di forza della valuta per unità di TICK e segnali di allerta per 28 coppie Forex. È possibile utilizzare 11 diverse unità di Tick. Si tratta di 1, 2, 3, 4, 5, 6, 10, 12, 15, 20 e 30 secondi. La barra dell'unità di tick nella finestra secondaria verrà mostrata e spostata a sinistra quand

The official release price is $65 only for the first 10 copies, ( only 2 copies left ). Next price: $125 Gold Scalper System is a multifunctional trading system that combines a breakout strategy for key liquidity levels with confirmation and a built-in Smart DOM Pro module for market depth analysis. The system identifies zones of limit order accumulat

ICT, SMC, SMART MONEY CONCEPTS, SMART MONEY, Smart Money Concept, Support and Resistance, Trend Analysis, Price Action, Market Structure, Order Blocks, BOS/CHoCH, Breaker Blocks , Momentum Shift, Supply&Demand Zone/Order Blocks , Strong Imbalance, HH/LL/HL/LH, Fair Value Gap, FVG, Premium & Discount Zones, Fibonacci Retracement, OTE, Buy Side Liquidity, Sell Side Liquidity, BSL/SSL Taken, Equal Highs & Lows, MTF Dashboard, Multiple Time Frame, BigBar, HTF OB, HTF Market Structure,

Versione MT5 Golden Hunter è stato sviluppato per i trader che operano manualmente sui mercati. Si tratta di uno strumento molto potente composto da 3 diversi indicatori: Potente strategia di ingresso: formata da un indicatore che misura la volatilità della coppia di valute e identifica la tendenza del mercato. LSMA: attenua i dati di prezzo ed è utile per individuare la tendenza a breve termine. Heikin Ashi: una volta collegato l'indicatore al grafico, le candele giapponesi cambieranno in cand
FREE

Vivi un'esperienza di trading senza precedenti con il nostro ineguagliabile indicatore Fair Value Gap MT4 (FVG)
acclamato come il migliore della sua categoria. Questo indicatore di mercato MQL5 va oltre l'ordinario,
offrendo ai trader un livello di accuratezza e di comprensione delle dinamiche di mercato senza pari. Versione EA: WH Fair Value Gap EA MT4
Indicatore basato su SMC: WH SMC Indicator MT4 Caratteristiche:
Analisi del divario di fair value migliore della categoria. Supporto mul
FREE
Versione MT5 disponibile qui:
https://www.mql5.com/en/market/product/50538 Canale e gruppo Telegram:
https://t.me/bluedigitsfx Accesso al gruppo VIP:
Invia la prova di pagamento nella nostra casella messaggi Broker consigliato:
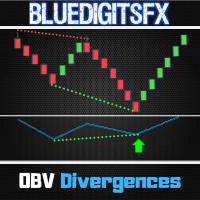
https://bit.ly/BlueDigitsFxStarTrader BlueDigitsFx OBV Divergence — Potente indicatore MT4 per rilevare divergenze OBV e prevedere inversioni di mercato L’indicatore BlueDigitsFx OBV Divergence analizza prezzo e volume On-Balance (OBV) per identificare automaticament

Renko Charts with Heiken Ashi Filter now have the alerts and the Win-rate . Now you can know which signal will give you that edge your trading needs. Risk to Reward Settings Wins versus Losses Count There are four alert types to choose from for notification on screen, email or phone notification. The alert types also have buffers for use with automation. This indicator can be incorporated with any system that requires renko charts. The four (4) alert types are: Three-bar Formation ; Pinbar

Horizont è un sistema di trading che fornisce una configurazione completa di operazione: punto di ingresso, target 1, target 2 e stop loss, tutti calcolati automaticamente. Il sistema identifica automaticamente i massimi e i minimi del mercato e li collega per definire il trend attuale. Lei seleziona quale trend tradare e Horizont genera i relativi livelli di ingresso, target e stop. Il sistema include una gestione automatica del rischio. Controlla il saldo del conto, calcola il rischio e sugge
Reversal Zones Pro is an indicator specifically designed to accurately identify key trend reversal zones. It calculates the average true range of price movement from the lower to upper boundaries and visually displays potential zones directly on the chart, helping traders effectively identify important trend reversal points. Key Features: Reversal Zone Identification: The indicator visually displays potential reversal zones directly on the chart. This helps traders effectively identify importan

Il Trova Livelli di Supporto e Resistenza:
Il Trova Livelli di Supporto e Resistenza è uno strumento avanzato progettato per migliorare l'analisi tecnica nel trading. Dotato di livelli dinamici di supporto e resistenza, si adatta in tempo reale man mano che nuovi punti chiave si sviluppano nel grafico, fornendo così un'analisi dinamica e reattiva. La sua capacità unica di multi-timeframe consente agli utenti di visualizzare i livelli di supporto e resistenza da diversi timeframes su qualsiasi
FREE
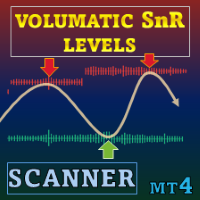
Offerta speciale : ALL TOOLS , solo $35 ciascuno! Nuovi strumenti saranno $30 per la prima settimana o per i primi 3 acquisti ! Trading Tools Channel on MQL5 : Unisciti al mio canale MQL5 per ricevere le ultime novità Volumatic Support/Resistance Levels Scanner è un indicatore di supporto e resistenza che aggiunge il contesto del volume alla struttura dei prezzi. Mostrando come l’attività di trading si raggruppa attorno ai pivot recenti, aiuta gli utenti a vedere dove l’interesse d
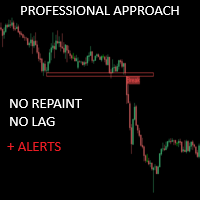
Critical Zones è stato creato appositamente per i trader manuali alla ricerca di entrate nel mercato più accurate. Questo indicatore utilizza algoritmi avanzati per individuare le aree di interesse, calcolando i supporti e le resistenze più rilevanti sul grafico, nonché i loro breakout e retest. Questo indicatore può essere configurato per inviare avvisi e notifiche quando vengono rilevate opportunità di acquisto/vendita potenzialmente redditizie, consentendo ai trader di rimanere in cima alle
FREE

"Wouldn't we all love to reliably know when a stock is starting to trend, and when it is in flat territory? An indicator that would somehow tell you to ignore the head fakes and shakeouts, and focus only on the move that counts?" The Choppiness Index is a non-directional indicator designed to determine if the market is choppy (trading sideways) or not choppy (trading within a trend in either direction). It is an oscillating indicator between -50 (very trendy) and +50 (very choppy). There are man

The market price usually falls between the borders of the channel.
If the price is out of range, it is a trading signal or trading opportunity.
Basically, Fit Channel can be used to help determine overbought and oversold conditions in the market. When the market price is close to the upper limit, the market is considered overbought (sell zone). Conversely, when the market price is close to the bottom range, the market is considered oversold (buy zone).
However, the research can be used to he
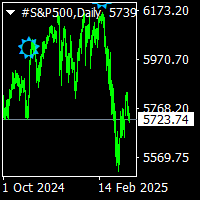
Star arrows indicator is no repaint arrow sindicator. it is sutable for experienced trader and beginners. it work all timeframe and all pairs. easy to to use.gives star arrows top and bottoms. if arrow up the price that is sell signals. if arrows below prices it is buy signal. cnt is bars back number and settled default 1000. it can be raised acording to charts bar numbers.

COMMERCIAL SESSIONS This indicator shows in the selected graph divided by tables each of the sessions ASIA, JAPAN, LONDON, NEW YORK: Allows you to configure: Session Color ASIA, JAPON, LONDRES, NEW YORK Hide and show each session It works in the lowest timeframes on the market, among which H4, H1, M15, M5 and M1 are recommended. (Don't forget to check out our other indicators)
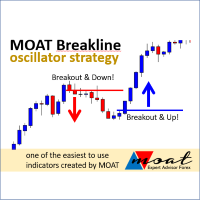
The indicator will provide a breakout line or price stop guide, we recommend M5 or H1 timeframes. Trade signal: Buy Signal: if the closed price (according to the timeframe) breaks the blue line and is already above it or if the lowest price stops above the red line. Sell Signal : if the closing price (according to the timeframe) breaks the red line and is already below it or if the highest price stops below the blue line. Feature: You will get time (hours) and price values for the lines

*This is tradingview indicator converted to mql4*
The Chandelier Exit Indicator is a popular technical analysis tool developed by Chuck LeBeau. It is designed to help traders identify potential exit points for their trades based on market volatility and the concept of trailing stops. The Chandelier Exit Indicator consists of three main components: Average True Range (ATR): The indicator utilizes the Average True Range, which measures market volatility. The ATR calculates the average range betwe
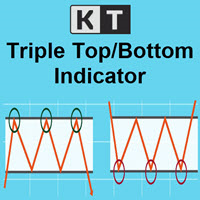
KT Triple Top-Bottom identifies the triple top/bottom pattern with a breakout signal in the opposite direction. It is used to identify potential trend reversals.
A Triple Top pattern is formed when the price reaches a high point three times, while a Triple Bottom pattern occurs when the price comes to a low point three times.
Features The indicator detects the triple top/bottom pattern with high precision and accuracy. The indicator suggests a shift in momentum, with sellers or buyers taking
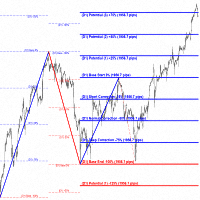
"Impulses and Corrections 4" is created to help traders navigate the market situation. The indicator shows multi-time frame upward and downward "Impulses" of price movements. These impulses are the basis for determining the "Base" , which is composed of zones of "Corrections" of price movements, as well as "Potential" zones for possible scenarios of price movement.
Up and down impulses are determined based on a modified formula of Bill Williams' "Fractals" indicator. The last impulse is always

Super Trend Button Super Trend is a trading strategy according to which one should trade Forex or Stocks when its price trend goes up, and trend goes down, expecting price movements to continue. “The trend is your friend” agree? Features - Special Button : Quick hide/show Super Trend chart. ( Make your Chart more clean and clear easily) - Color : You have the option of customising your favourite colour of Up Trend or Down Trend . - Super Trend Periods : You have the option to c

Questa dashboard è uno strumento di avviso da utilizzare con l'indicatore di inversione della struttura del mercato. Il suo scopo principale è avvisarti di opportunità di inversione su intervalli di tempo specifici e anche di ripetere i test degli avvisi (conferma) come fa l'indicatore. Il dashboard è progettato per essere posizionato su un grafico da solo e funzionare in background per inviarti avvisi sulle coppie e sui tempi scelti. È stato sviluppato dopo che molte persone hanno richiesto un
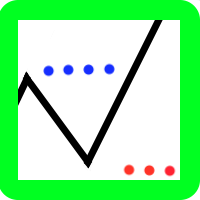
The indicator is a polyline (ZigZag segment) that tracks and connects the extreme points of the chart price that are at least a specified size apart from each other in points on the price scale.
The one and only setting is the minimum size (in points) of a ZigZag segment. The indicator displays levels to determine a possible trend reversal:
level "LevelForUp" - the breaking of this level determines the possible reversal of the trend up (to buy);
level " LevelForDown " - the breaking o

Currency Strength Meter is the easiest way to identify strong and weak currencies. This indicator shows the relative strength of 8 major currencies + Gold: AUD, CAD, CHF, EUR, GBP, JPY, NZD, USD, XAU. Gold symbol can be changed to other symbols like XAG, XAU etc.
By default the strength value is normalised to the range from 0 to 100 for RSI algorithm: The value above 60 means strong currency; The value below 40 means weak currency;
This indicator needs the data of all 28 major currency pairs a

Scopo principale: "Pin Bars" è progettato per rilevare automaticamente le barre dei pin sui grafici dei mercati finanziari. Una barra pin è una candela con un corpo caratteristico e una lunga coda, che può segnalare un'inversione di tendenza o una correzione.
Come funziona: L'indicatore analizza ogni candela sul grafico, determinando la dimensione del corpo, della coda e del naso della candela. Quando viene rilevata una barra pin corrispondente a parametri predefiniti, l'indicatore la segna su
FREE

L'indicatore di inversione ADR ti mostra a colpo d'occhio dove il prezzo è attualmente scambiato in relazione al suo normale intervallo medio giornaliero. Riceverai avvisi istantanei tramite pop-up, e-mail o push quando il prezzo supera la sua gamma media e livelli superiori a tua scelta in modo da poter saltare rapidamente a pullback e inversioni. L'indicatore disegna linee orizzontali sul grafico agli estremi dell'intervallo medio giornaliero e anche estensioni al di sopra di quei livelli a c

100 Indicators Magic Signal-V4
This system is built for traders who want to eliminate second-guessing. It processes data from 100 distinct handles—including Trend, Momentum, Volatility, Volume, and Price Action clusters—to provide a unified "Market Consensus." Exclusive Bonus When you purchase this indicator, you receive 2 professional Gold EAs: MT4 Gold EA
XAU Trend Matrix EA – Worth $300 : See the EA https://www.mql5.com/en/market/product/162870 MT5 Gold EA
XAU Steady Gain Pro – Worth $

The price is indicated only for the first 30 copies ( only 2 copies left ). The next price will be increased to $150 . The final price will be $250. Sniper Delta Imbalance is a professional tool for deep delta analysis — the difference between buyer and seller volumes. It takes volume analysis to the next level, allowing traders to see in real time who controls the price — buyers or sellers

Gold Venamax : questo è il miglior indicatore tecnico azionario. L'algoritmo dell'indicatore analizza il movimento dei prezzi di un asset e riflette la volatilità e le potenziali zone di ingresso. Caratteristiche dell'indicatore: Questo è un super indicatore con Magic e due blocchi di frecce di tendenza per un trading comodo e redditizio. Sul grafico viene visualizzato il pulsante rosso per cambiare blocco. Magic è impostato nelle impostazioni dell'indicatore, in modo da poter installare l'indi

Adaptive Volatility Range [AVR] is a powerful tool for identifying key trend reversal points. AVR accurately reflects the Average True Range (ATR) of volatility, taking into account the Volume-Weighted Average Price (VWAP). The indicator adapts to any market volatility by calculating the average volatility over a specific period, ensuring a stable rate of profitable trades. You receive not just an indicator but a professional automated trading system , AVR-EA . Advantages: Automated Trading Sys

L'indicatore " Dynamic Scalper System " è progettato per il metodo di scalping, ovvero per il trading all'interno di onde di trend.
Testato sulle principali coppie di valute e sull'oro, è compatibile con altri strumenti di trading.
Fornisce segnali per l'apertura di posizioni a breve termine lungo il trend, con ulteriore supporto al movimento dei prezzi.
Il principio dell'indicatore.
Le frecce grandi determinano la direzione del trend.
Un algoritmo per generare segnali per lo scalping sotto fo

A top and bottom indicator that can intuitively identify the trend of the band. It is the best choice for manual trading, without redrawing or drifting. How to get this indicator for free: Learn more Price increase of $20 every 3 days, price increase process: 79--> 99 --> 119...... Up to a target price of $1000. For any novice and programming trading friend, you can write the signal into the EA to play freely. Array 3 and array 4, for example, 3>4 turns green, 3<4 turns red. If you don't underst

The Fair Value Gap (FVG) is a price range where one side of the market liquidity is offered, typically confirmed by a liquidity void on the lower time frame charts in the same price range. Price can "gap" to create a literal vacuum in trading, resulting in an actual price gap. Fair Value Gaps are most commonly used by price action traders to identify inefficiencies or imbalances in the market, indicating that buying and selling are not equal. If you're following the ICT Trading Strategy or Smart
FREE

Smetti di indovinare. Inizia a fare trading con un vantaggio statistico. Gli indici azionari non si negoziano come il forex. Hanno sessioni definite, gap notturni e seguono pattern statistici prevedibili. Questo indicatore ti fornisce i dati di probabilità di cui hai bisogno per fare trading su indici come DAX, S&P 500 e Dow Jones con fiducia. Cosa lo rende diverso La maggior parte degli indicatori ti mostra cosa è successo. Questo ti mostra cosa probabilmente succederà dopo. Ogni giorno di trad
Mars 14 is a Break indicator is a powerful indicator of Pattern trade for any par and any timeframe. It doesn't requires any additional indicators for the trading setup.The indicator gives clear signals about opening and closing trades.This Indicator is a unique, high quality and affordable trading tool. Can be used in combination with other indicators Perfect For New Traders And Expert Traders Low risk entries. Never repaints signal. Never backpaints signal. Never recalculates signal. For M
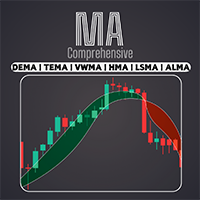
Accedete a un'ampia gamma di medie mobili, tra cui EMA, SMA, WMA e molte altre con il nostro indicatore professionale Comprehensive Moving Average . Personalizzate la vostra analisi tecnica con la combinazione perfetta di medie mobili per soddisfare il vostro stile di trading unico / Versione MT5
Caratteristiche Possibilità di attivare due MA con impostazioni diverse. Possibilità di personalizzare le impostazioni del grafico. Possibilità di cambiare il colore delle candele in base alle MA incr
FREE
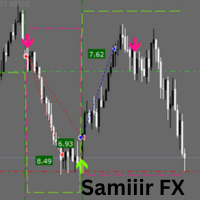
Samiiir FX: Your Ultimate MT4 Trading Companion for Precision and Profit Elevate your trading game with Samiiir FX , a premium MT4 indicator designed to deliver clear, actionable buy and sell signals across forex, commodities, and indices. Built for traders who demand precision and reliability, Samiiir FX combines advanced market analysis with intuitive visuals and robust risk management tools. Whether you're a scalper hunting quick profits, a day trader seeking consistency, or a swing trader a

Multi Anchor VWAP Pro MT4 – Pure Anchored VWAP | Adaptive σ-Bands | Smart Alerts Precision VWAP anchoring, purpose-built for MetaTrader 4. One-click anchors, dynamic σ-bands or %-bands and instant multi-channel alerts—ideal for scalpers, intraday and swing traders who need institutional-grade fair-value mapping. Public channel: CLICK HERE
Full User Guide – Need MT5? Click here WHY PROFESSIONAL TRADERS CHOOSE MULTI ANCHOR VWAP PRO VWAP is the institutional benchmark for fair value. This MT4

Smart Fibo Zones are powerful, auto-generated Fibonacci Retracements that are anchored to key market structure shifts . These zones serve as critical Supply and Demand levels, guiding you to identify potential price reactions and confirm market direction. Fibonacci calculations, widely used by professional traders, can be complex when it comes to identifying highs and lows. However, Smart Fibo Zones simplify this process by automatically highlighting order blocks and key zones, complete with St
Market Profile with Dashboard Indicator - Complete User Guide
indicator Overview The Market Profile with Dashboard is a comprehensive trading analysis tool for MetaTrader 4 that displays market profile data, volume analysis, and key market structure information directly on your chart. This indicator helps traders identify significant price levels, market balance areas, and potential trading opportunities based on market profile theory.
Core Components and Features
Market Profile Display - Sh

ConfluencePro v2.0 – Ultimate Confluence Indicator for Binary Options & Forex Professional Multi-Filter Signal System with Dashboard, News Filter & Real-Time Statistics ConfluencePro v2.0 is the most advanced confluence-based indicator ever released on the MQL5 Market. It combines 17+ professional filters (Trend, Smart Money Concepts, Market Structure, Divergence, MTF Confirmation, News Events, Volume, Regime Detection and more) into a single, easy-to-read confluence score (0–100%). Only the hi

FX Levels: Supporti e Resistenze di Precisione Eccezionale per Tutti i Mercati Panoramica Rapida
Cercate un modo affidabile per individuare livelli di supporto e resistenza in ogni mercato—coppie di valute, indici, azioni o materie prime? FX Levels fonde il metodo tradizionale “Lighthouse” con un approccio dinamico all’avanguardia, offrendo una precisione quasi universale. Basato sulla nostra esperienza reale con i broker e su aggiornamenti automatici giornalieri più quelli in tempo reale, FX

I Gold Target sono il miglior indicatore di tendenza. L'algoritmo unico dell'indicatore analizza il movimento del prezzo dell'asset, tenendo conto di fattori di analisi tecnica e matematica, determina i punti di ingresso più redditizi, emette un segnale sotto forma di freccia e il livello di prezzo (ACQUISTA Entrata / VENDI Entrata) per aprire un ordine. L'indicatore mostra inoltre immediatamente il livello di prezzo per lo Stop Loss e cinque livelli di prezzo per il Take Profit.
ATTENZIONE: L

Questo indicatore è un indicatore per l'analisi automatica delle onde perfetto per il trading pratico! Caso...
Nota: non sono abituato a usare nomi occidentali per la classificazione delle onde a causa dell'influenza della convenzione di denominazione di Tang Lun (Tang Zhong Shuo Zen), ho chiamato l'onda base come penna e la banda dell'onda secondaria come segmento At allo stesso tempo, il segmento ha la direzione del trend. La denominazione è principalmente segmento di trend (que
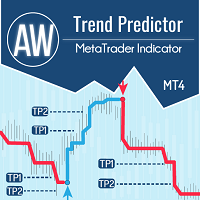
La combinazione di trend e livelli di rottura in un unico sistema. Un algoritmo di indicatore avanzato filtra il rumore del mercato, determina la tendenza, i punti di ingresso e i possibili livelli di uscita. I segnali indicatori sono registrati in un modulo statistico, che permette di selezionare gli strumenti più adatti, mostrando l'efficacia dello storico dei segnali. L'indicatore calcola i segni Take Profit e Stop Loss. Manuale e istruzioni -> Qui / Versione MT5 -> Qui Come fare tradi

Gold Buster M1 System è un sistema di trading professionale per i grafici M1 sulla coppia XAUUSD. Ma, nonostante il fatto che il sistema sia stato originariamente sviluppato esclusivamente per il trading di oro, il sistema può essere utilizzato anche con alcune altre coppie di valute. Dopo l'acquisto, ti fornirò un elenco di coppie di trading che possono essere utilizzate con il sistema oltre a XAUUSD, che amplierà le tue possibilità di utilizzare questo sistema. TUTTI GLI INDICATORI DEL SISTEMA

Hydra Trend Rider is a non-repainting, multi-timeframe trend indicator that delivers precise buy/sell signals and real-time alerts for high-probability trade setups. With its color-coded trend line, customizable dashboard, and mobile notifications, it's perfect for traders seeking clarity, confidence, and consistency in trend trading. Setup & Guide: Download MT5 Version here. To learn how to use the Indicator: Indicator Manual & Guide - Read Here
Exclusively for you: It's your chance to st

"The trend is your friend" is one of the best known sayings in investing, because capturing large trendy price movements can be extremely profitable. However, trading with the trend is often easier said than done, because many indicators are based on price reversals not trends. These aren't very effective at identifying trendy periods, or predicting whether trends will continue. We developed the Trendiness Index to help address this problem by indicating the strength and direction of price trend

The Area of Interest (AOI) Indicator is a powerful tool designed to help traders identify key market zones where price reactions are highly probable. This indicator specifically highlights two critical zones: Seller AOI (Area of Interest) : This zone represents areas where sellers are likely to enter the market, often acting as resistance. When the price approaches or touches this zone, it signals that a potential sell-off could occur. Buyer A OI (Area of Interest) : The BOI zone identifies re
FREE
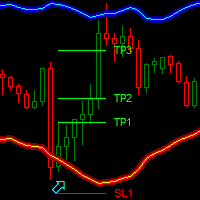
Dark Bands is an Indicator for intraday trading. This Indicator is based on Counter Trend strategy but use also Volatility. We can enter in good price with this Indicator, in order to follow the inversions on the current instrument.
Key benefits
Easily visible take profit/stop loss lines Reliable bands lines with futuristic colors, and Intuitive directional arrows Useful statistics , which indicate the win rate of the signals Plus Package available, leave a feedback to receive
FREE

Apollo Secret Trend è un indicatore di tendenza professionale che può essere utilizzato per trovare le tendenze su qualsiasi coppia e intervallo di tempo. L'indicatore può facilmente diventare il tuo indicatore di trading principale che puoi utilizzare per rilevare le tendenze del mercato, indipendentemente dalla coppia o dal periodo di tempo che preferisci negoziare. Utilizzando un parametro speciale nell'indicatore puoi adattare i segnali al tuo stile di trading personale. L'indicatore fornisc

Keltner Channel Indicator Keltner Channel is an oscillator like Bollinger Bands.
Keltner Channel is a very good tool to time entries for your strategy.
Keltner Channel displays a channel where price is supposed to stay unless we are in overbought or oversold situations.
Various strategies use Keltner Channel indicator successfully to spot overbought / oversold situations and look for reversals.
Keltner Channel indicator uses ATR to determine overbought and oversold situations. Inputs of the indi
Il MetaTrader Market è un sito semplice e pratico dove gli sviluppatori possono vendere le loro applicazioni di trading.
Ti aiuteremo a pubblicare il tuo prodotto e ti spiegheremo come prepararne la descrizione per il Market. Tutte le applicazioni sul Market sono protette da crittografia e possono essere eseguite solo sul computer dell'acquirente. La copia illegale è impossibile.
Ti stai perdendo delle opportunità di trading:
- App di trading gratuite
- Oltre 8.000 segnali per il copy trading
- Notizie economiche per esplorare i mercati finanziari
Registrazione
Accedi
Se non hai un account, registrati
Consenti l'uso dei cookie per accedere al sito MQL5.com.
Abilita le impostazioni necessarie nel browser, altrimenti non sarà possibile accedere.