Watch the Market tutorial videos on YouTube
How to buy а trading robot or an indicator
Run your EA on
virtual hosting
virtual hosting
Test аn indicator/trading robot before buying
Want to earn in the Market?
How to present a product for a sell-through
Technical Indicators for MetaTrader 4 - 4

Have you ever asked yourself why your supply and demand zones fail , even when everything looks “perfect”? The truth is, you're not wrong — you're just watching the reaction, not the reason. It's not like those random currency strength meters that rely on lagging indicators like RSI, CCI, or similar tools mashed together to guess strength or weakness. That approach reacts to the past — not the cause. Pairs like EURUSD or USDJPY are just the outcomes . The real drivers? Currency indices and inst

Our Basic Candlestick Patterns indicator makes identifying major candlestick patterns easier than ever. Discover patterns such as the Hammer, the Evening Star, the Three White Soldiers and many more with just a glance at your chart. With an intuitive interface and clear visual cues, our indicator helps you identify trading opportunities quickly and accurately / MT5 version Dashboard Scanner for this indicator: ( Basic Candlestick Patterns Dashboard )
Features
Accuracy : Automatically identifie
FREE

Impulse Zone Hunter – Precision Chart Tool Impulse Zone Hunter is a high-performance MT4 indicator designed to provide traders with a visual edge in detecting high-probability market movements. It focuses on Supply & Demand zones , Order Blocks , and ChoCH (Change of Character) , delivering clear and actionable signals directly on your price chart . Key Features: Dual Mode Trading Toggle between Supply & Demand zones or Order Blocks with ChoCH lines . Easily switch modes without affecting other

The Only 100% Universal Tool! Stop trading against nature! This is your chance to secure the only indicator rooted in the absolute laws that govern the entire universe. Most tools guess—this one reveals the truth. Buy another toy or buy the truth. Your choice...
Based on Universal Laws — NOT Some Guy’s Algorithm: Let the market adjust to the Hidden Cycles Geometry — not the other way around.
Most indicators are based on a man-made formula. They often lag, fail over time, or need constant re-o
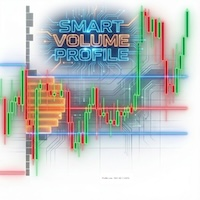
English Scan for "Smart Money" (Volume Markers): Arrows indicate abnormal volume (higher than average) with clear green/red color coding. This helps identify "Smart Money" entries and filter out fake signals. Critical Alerts: No need to stare at the screen. The system notifies you immediately when the price crosses the POC (Point of Control), which is often a decisive point for trend continuation or reversal. Instant Market Structure (Developing Profile): Displays the profile of the current form

The Basic Renko indicator is a powerful tool for traders looking for a clear and concise market perspective. Our indicator not only simplifies trend visualization, but also offers accurate alerts for reversals, providing a strategic edge in your trading / Free MT5 Version
Features Fully Customizable: Tailor the indicator to your business preferences with advanced customization options. From colors to box size settings, you have full control over how information is displayed on your char
FREE

TW Trend Sniper: Unlock Profitable Trades with Advanced Trend Detection The TW Trend Sniper indicator, utilizing an intelligent combination of advanced technical analysis techniques, helps you accurately identify market trends and receive timely signals for profitable trades. The proprietary formula of Trade Wizards, along with Price Action analysis, Fibonacci levels, and other technical analysis tools, provides you with precise and reliable trading signals. This indicator is the result of coll
This indicator analyzes in parallel price charts for multiple currency pairs on all timeframes and notifies you as soon as a double tops or double bottoms pattern has been identified.
Definition Double Top / Double Bottom pattern Double Top is a trend reversal pattern which are made up of two consecutive peaks that are more and less equal with a trough in-between. This pattern is a clear illustration of a battle between buyers and sellers. The buyers are attempting to push the security but are

Protect against whipsaws: revolutionize your swing trading approach Swing Trading is the first indicator designed to detect swings in the direction of the trend and possible reversal swings. It uses the baseline swing trading approach, widely described in trading literature. The indicator studies several price and time vectors to track the aggregate trend direction and detects situations in which the market is oversold or overbought and ready to correct. [ Installation Guide | Update Guide | Tro

[The Ultimate Evolution] ONI STRENGTH v20.01: Abandon Analysis, Focus on Execution ONI STRENGTH has evolved even further. The transformation from the initial version to the current v15.00 is dramatic. It has evolved from a mere "information display tool" into a "signal-driven weapon" that tells you exactly when to win. Before diving into the features, here is how we perfected this tool: Logic Evolution: From contradictory signals to "Sync Logic." No more entering when strength and price disagre

Maximize Your Trend-Aligned Trading with H4 & M30 Turning Point PRO! Say goodbye to guesswork and chart clutter. This premium indicator combines higher timeframe trend detection with precise short-term turning point signals, giving you crystal-clear buy and sell opportunities . Why Traders Love It: - H4 EMA200 Trend Bias: Know the dominant trend at a glance. Only trade in the trend direction.
- M30 Execution Arrows: Wait for high-probability turning points confirmed by trend, structure, and vol

Apollo Pips is an arrow indicator based on a reversal strategy which can be used with various forex pairs. The indicator can work with currencies, metals, indices and crypto. The indicator can be used as a standalone system or as a part of a trading system. Recommended time frames are H1 and H4. The indicator sends out an alert only when the signal is confirmed. It means when you see the alert message, you can consider the signal as valid. The indicator provides you with all types of alerts incl
Pivot SR Indicator - Powerful Technical Analysis Tool
Pivot SR is a professional indicator designed to identify key support and resistance levels in the market with high precision. This indicator offers:
Key Features : - 5 Pivot Point Calculation Methods (Classic, Camarilla, Demark, Fibonacci, Woodie) - Automatic calculation of support and resistance levels - Clean and easy-to-read visuals - Full customization of colors, styles, and appearance
️ Flexible Settings : - Choi

GoldRush Trend Arrow Signal V1.6 The GoldRush Trend Arrow Signal indicator V1.6 continues to provide precise, real-time trend analysis tailored for high-speed, short-term scalpers in XAU/USD , but it now has additional features and improved efficiency and reliability. Built specifically for the 1-minute time frame, this tool displays directional arrows for clear entry points, allowing scalpers to navigate volatile market conditions with confidence. The indicator consists of PRIMARY and SECONDARY
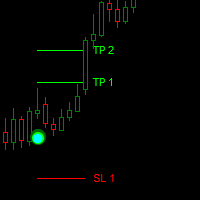
Dark Point is an Indicator for intraday trading. This Indicator is based on Trend Following strategy, also adopting the use of the atr to determine the right volatility. We can enter in good price with this Indicator, in order to follow the strong trend on the current instrument. If you love Dark Point, consider adding some power: Dark Power
Key benefits
Easily visible take profit/stop loss lines Intuitive directional points/arrows by colors Useful statistics , which indicate the win ra
FREE
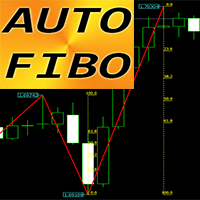
"Auto FIBO" Crypto_Forex indicator - is great auxiliary tool in trading!
- Indicator automatically calculate and place on chart Fibo levels and local trend lines (red color). - Fibonacci levels indicate key areas where price can reverse. - Most important levels are 23.6%, 38.2%, 50% and 61.8%. - You can use it for reversal scalping or for zone grid trading. - There are plenty of opportunities to improve your current system using Auto FIBO indicator as well.
Click here to see high quality Trad

Simple QM Pattern is a powerful and intuitive trading indicator designed to simplify the identification of the Quasimodo (QM) trading pattern. The QM pattern is widely recognized among traders for effectively signaling potential reversals by highlighting key market structures and price action formations. This indicator helps traders easily visualize the QM pattern directly on their charts, making it straightforward even for those who are new to pattern trading. Simple QM Pattern includes dynamic
FREE

Looking for a powerful yet lightweight swing detector that accurately identifies market structure turning points?
Want clear, reliable buy and sell signals that work across any timeframe and any instrument?
Buy Sell Arrow MT Swing is built exactly for that — precision swing detection made simple and effective. This indicator identifies Higher Highs (HH) , Higher Lows (HL) , Lower Highs (LH) , and Lower Lows (LL) with remarkable clarity. It is designed to help traders easily visualize market str
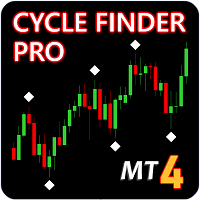
Update - Version 4.0 now includes trend change signal. Indicator will tell you the current trend on all charts. Update - Version 5.0 now includes alerts for mt4, push and email notifications.
Cycle Finder Pro is a chart reading indicator and is designed for trend and pattern traders . Chart reading is time consuming and complex and requires knowledge of price action , cyclicity, and time frame correlation . Cycle Finder Pro reads all this in one simple indicator so you can spot trend and char

Special offer : ALL TOOLS , just $35 each! New tools will be $30 for the first week or the first 3 purchases ! Trading Tools Channel on MQL5 : Join my MQL5 channel to update the latest news from me Unlock the power of ICT’s Inversion Fair Value Gap (IFVG) concept with the Inversion Fair Value Gaps Indicator ! This cutting-edge tool takes Fair Value Gaps (FVGs) to the next level by identifying and displaying Inverted FVG zones—key areas of support and resistance formed after price m

The indicator builds a three-period semaphore and reversal pattern 123 from the extremum. The signal comes at the opening of the second candle. This pattern can be traded in different ways (test point 3, breakout and others). Exit from the channel or breakout of the trendline is the main trigger for finding an entry point. Icons are colored according to Fibonacci levels. Yellow icons indicate a test of a level at which the signal is amplified. Using the multi-currency dashboard, you can track w
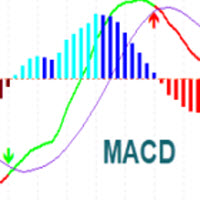
MACD Indicator It has MACD line, Signal line, and Histogram. The Histogram has 4 colors based on Direction Above and Below the Zero Line, showing its movement direction as simple as possible. Allows Show MACD & Signal Line, Show Change In color of MACD Line based on cross of Signal Line. Show Dots at Cross of MacD and Signal Line, Turn on and off Histogram. Enjoy your trading experience, and feel free to share your comments and reviews.
If you are interested in this indicator, you might
FREE
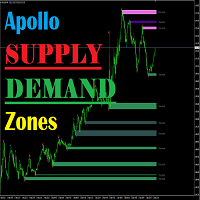
Apollo Supply Demand Zones with ALERTS is an indicator that calculates support and resistance levels. The indicator will be helpful to absolutely all traders, regardless of what strategy they use. This indicator can become one of the main elements of your trading system. The indicator calculates levels both on the current time frame and can work in MTF mode, displaying levels from a higher time frame. This indicator can be used absolutely on any time frame and with any trading instrument. The
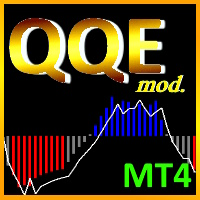
The Quantitative Qualitative Estimation (QQE) indicator is derived from Wilder’s famous Relative Strength Index (RSI). In essence, the QQE is a heavily smoothed RSI.
Modification of this version: ( converted from tradingview script by Mihkell00, original from Glaz, 100% identical output)
So there are Two QQEs. One that is shown on the chart as columns, and the other "hidden" in the background which also has a 50 MA bollinger band acting as a zero line.
When both of them agree - y

Volume Profile Indicator / Market Profile Indicator What this is not : FMP is not the classic letter-coded TPO display , does not display the overall chart data profile calculation , and , it does not segment the chart into periods and calculate them. What it does : Most importantly ,the FMP indicator will process data that resides between the left edge of the user defined spectrum and the right edge of the user defined spectrum. User can define the spectrum by just pulling each end of the indi
FREE

ADX indicator is used to determine the trend and its strength. The direction of the price is shown by the +DI and -DI values, and the ADX value shows the strength of the trend. If +DI is above -DI, then the market is in an uptrend, if on the contrary, it is a downtrend. If ADX is below 20, then there is no definite direction. As soon as the indicator breaks this level, a medium-strength trend begins. Values above 40 indicate a strong trend (a downtrend or an uptrend).
Multicurrency and multiti
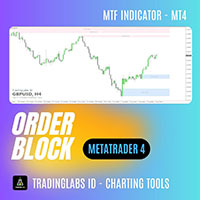
Order Block + Fair Value Gap (FVG) Indicator Multi-Timeframe Order Block + FVG Tool In the ICT (Inner Circle Trader) concept, Order Blocks (OB) + Fair Value Gaps (FVG) are among the most critical areas used by professional traders to read market structure, identify supply & demand zones, and spot high-probability entry points. The Order Block + FVG Indicator automatically detects and displays both Order Block zones and Fair Value Gaps directly on your MT4 charts. With multi-timeframe support, yo
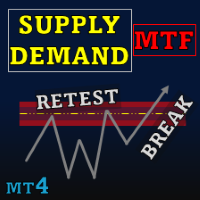
Special offer : ALL TOOLS , just $35 each! New tools will be $30 for the first week or the first 3 purchases ! Trading Tools Channel on MQL5 : Join my MQL5 channel to update the latest news from me Supply Demand Retest and Break Multi Timeframe , this tool plots supply and demand zones based on strong momentum candles, allowing you to identify these zones across multiple timeframes using the timeframe selector feature. With retest and break labels, along with customizable valid

Title: SMC Structure for EURUSD Description: This indicator is designed to map market structures based on Smart Money Concepts (SMC). It identifies Swing Structure, Internal Structure, Order Blocks, and Fair Value Gaps (FVG). The tool is optimized for performance to manage resources efficiently on the MetaTrader platform. Key Features: 1. Market Structure Mapping Identifies Major Swing Structure with BOS (Break of Structure) and CHoCH (Change of Character). Displays Internal Structure to visual
FREE
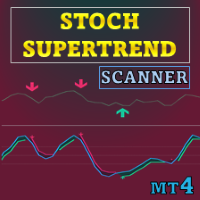
Special offer : ALL TOOLS , just $35 each! New tools will be $30 for the first week or the first 3 purchases ! Trading Tools Channel on MQL5 : Join my MQL5 channel to update the latest news from me This tool combines Stochastic RSI with SuperTrend logic to generate directional signals based on momentum shifts. It overlays a SuperTrend-style envelope on the Stochastic RSI and highlights turning points as momentum passes the overbought/oversold thresholds. See more MT5 version at: S

Introducing Order Blocks Breaker , a brand-new way to identify and leverage order blocks in your trading strategy. After developing multiple order block tools with unique concepts, I’m proud to present this tool that takes things to the next level. Unlike previous tools, Order Blocks Breaker not only identifies order blocks but also highlights Breaker Order Blocks —key areas where the price is likely to retest after a breakout. MT5 - https://www.mql5.com/en/market/product/124102/ This tool inco

PROFESSIONAL FOOTPRINT CHART INDICATOR
A Footprint Chart is an advanced order flow visualization tool that displays the volume traded at each price level within a candlestick. Unlike traditional candlestick charts that only show open, high, low, and close prices, footprint charts reveal the battle between buyers and sellers at every price level. KEY CONCEPT: Footprint charts show WHERE volume occurred, not just HOW MUCH volume occurred. This is critical for understanding institutional activ

OrderFlow Absorption – Professional Delta & Absorption Signal Indicator for MT4 Unlock the power of true order flow analysis with OrderFlow Absorption – the ultimate delta histogram and absorption signal indicator for MetaTrader 4. Designed for traders who want to see what’s really happening behind every price move, this tool reveals hidden buy/sell pressure and absorption events that drive the market. Features Delta Histogram Visualization: Instantly see buy and sell pressure with clear,

Symbols: USDCHF, USDJPY , XAUUSD, GBPUSD, EURUSD, AUDUSD, GBPJPY ( I Love USDCHF_H1 ) Timeframes: H1, H4, D1
Important features : No repaint, no lag, indirection signal, multi confirmation
Safety : signals contain stop loss , take profit and respect risk to reward rule
Includes: Free Multi-Time-Frame Scanner (After purchasing this product, simply send me a screenshot via private message and I will personally send you the Screener file.)
Full trading system concept : Read Article (full co

The Key level wedge indicator automatically draws rising wedge pattern and falling wedge pattern for you on the chart. This pattern is really good when used as a confirmation entry at key support & resistance, supply & demand and reversal zones.
Advantages
The Key level wedge block DOES NOT RE-PAINT, giving you confidence when a signal appears and also helps when looking back. The Key level wedge includes an on/off button on the chart to easily keep the charts clean after analysis by just o

Scalpers Zone – Ultimate Supply/Demand + Stochastic Rejection & Triple Touch Indicator Scalpers Zone is designed for traders seeking high-probability scalp entries . It detects daily and 7-day supply/demand zones and highlights areas where these zones align perfectly , marking the strongest potential reversal points . For volatile assets like crypto and gold , the zone thickness can be increased for better visibility and precision . Key Features: Aligned Zone Detection: Daily and 7-day supply or

Professional Histogram ( PH ) is a highly efficient and reliable tool for trading Forex, CFDs and binary options. PH is easy to use and configure both for beginners and experienced traders. Unlike most indicators, Professional Histogram finds longer trends and gives fewer false signals. When a buy or a sell signal appears, an alert is triggered allowing you to open a position in a timely manner and avoid sitting at your PC all the time. Professional Histogram for the MetaTrader 5 terminal :

Volumatic Fair Value Gaps is a precision-engineered indicator for identifying, analyzing, and visualizing Fair Value Gaps (FVGs) backed by volume intelligence. This tool goes beyond standard FVG plotting by dissecting volume dynamics inside each gap using lower-timeframe sampling , offering clear insight into whether bulls or bears dominate the imbalance. Designed for technical traders, this indicator overlays high-probability gaps only, visualizes bullish vs. bearish volume compositio
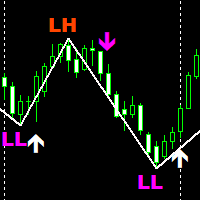
SMC Traders is a non-repaint indicator that is based on Price Action The indicator uses current market structure to predict future reversals. The indicator can be used with our free Market structure zig zag which can be found here: https://www.mql5.com/en/market/product/91579 Please note to find the HH AND HL CLINK ON LINK ABOVE Timeframes: 15 minutes for scalping 1 Hour for swing trading Purple Arrow look for sells in conjunction with LL White Arrow look for buys in conjunction with HL
FREE

volatility level indicator is a volatility oscillator to see trend reversal points. price trends has reverese when volatility inreased . this indicator show trend reversal points volatility. mostly same level up and down volatility is reversal points. red colour shows up points of volatilty.and probably trend will down. blue colour oscillator shows deep point of price when increased volatiliyty. on pictures horizontal lines on oscillator has drawed by hand.to see the before level and compare now

Trend Guardian Pro - Advanced Trend Prediction Indicator Trend Guardian Pro is the result of collaborative work by a team of professional mathematicians, analysts, and traders. The indicator is based on years of market data analysis and employs cutting-edge mathematical modeling techniques for early detection of potential trend changes. Key Features: Early prediction - the indicator analyzes multiple market factors to identify signs of trend changes before they become apparent Comprehensive an

Special offer : ALL TOOLS , just $35 each! New tools will be $30 for the first week or the first 3 purchases ! Trading Tools Channel on MQL5 : Join my MQL5 channel to update the latest news from me Liquidation Reversal Signals is an indicator designed to mark directional liquidation phases and confirm reversal points by combining Z-score volume extremes with Supertrend state changes. Instead of printing an arrow whenever a trend simply “changes color,” this tool s

Please contact us after your purchase and we will send you the complimentary indicators to complete the system Cycle Sniper is not a holy grail but when you use it in a system which is explained in the videos, you will feel the difference. If you are not willing to focus on the charts designed with Cycle Sniper and other free tools we provide, we recommend not buying this indicator. We recommend watching the videos about the indiactor and system before purchasing.
Videos, settings and descri

Visit our all-new Stein Investments Welcome Page to get the latest information, updates and trading strategies. Do you want to become a constantly profitable 5-star forex trader? Then get our Stein Investments trading tools and send us a screenshot to get your personal invitation to our exclusive trading chat with 500+ members.
FX Trend displays the trend direction, duration, intensity and the resulting trend rating for all time frames in real time.
You'll see at a glance at which dire

"Ppr PA" is a unique technical indicator created to identify "PPR" patterns on the currency charts of the MT4 trading platform. These patterns can indicate possible reversals or continuation of the trend, providing traders with valuable signals to enter the market.
Features: Automatic PPR Detection: The indicator automatically identifies and marks PPR patterns with arrows on the chart. Visual Signals: Green and red arrows indicate the optimal points for buying and selling, respectively. Arrow
FREE

Developer’s Note I have been an MQL4/5 developer for over 11 years. I was never focused on selling indicators, but the consistent positive win/loss ratio of this system genuinely surprised me (including my Rare Spear indicator).
That is why I decided to release it. All logic, structure, and authorship belong entirely to me.
I make no promises — please test it yourself and make your own judgment. Why This Indicator Is Different Attention — this is not just a visual illusion!
This is an indicator
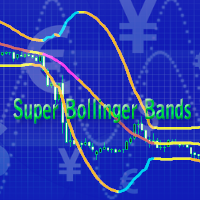
This is a forward-looking indicator for trading on all instruments. An advanced version of Bollinger Bands indicator created by outstanding analyst John Bollinger. One of the main differences of Super Bollinger Bands indicator from its predecessor consists in displaying upper and lower bands behavior on the middle line with some specific colors. Thus, the indicator gives a trader some visual information about trend development at the moment, and not in the past, as majority of other indicators d
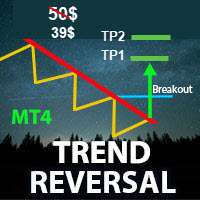
** All Symbols x All Timeframes scan just by pressing scanner button ** Discount: The price is $50$, But now it is just $39, Limited time offer is active.
*** Contact me to send you instruction and add you in "Trend Reversal group" for sharing or seeing experiences with other users. Introduction: Trendlines are the most famous technical analysis in trading . Trend lines continually form on the charts of markets across all the different timeframes providing huge opportunities for trader
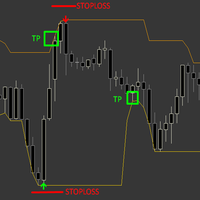
The Sure Reverse Channel is a dynamic non repaint trend indicator with entry arrows, the indicator focuses on catching a reverse swing in the market by using channel and price action formula, the indicator comes with built-in money management . HOW TO TRADE : Open buy trade when buy arrow pops up and set your SL below arrow, for TP you have TP which is opposite band. Open sell trade when sell arrow pops up and set your SL above arrow, for TP you have TP which is opposite band. band.
Why is
FREE
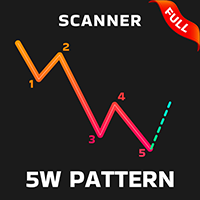
Contact me after payment to send you the User-Manual PDF File. 5W Pattern introduction The 5W pattern occurs when the price forms an alternating 5-wave cycle with its volatility. In fact, the 5W pattern is a price series of alternating HH or LL (higher high or lower low), which is the main characteristic of a trend. The pattern of 5W should have the characteristic of non-overlapping waves, also the points of the pattern are usually formed in Fibonacci levels. The completed pattern of 5W actua
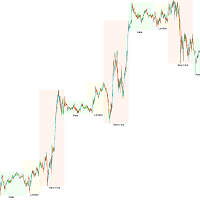
Trading Session ICT KillZone — Unlock the Power of Market Timing Successful traders know one truth: timing is everything. Different trading sessions bring different levels of activity, volatility, and opportunities. To help you clearly see and take advantage of these shifts, we created the Trading Session KillZone Indicator. This indicator highlights the active times of the Asian, London, and New York sessions, giving you a complete picture of when the market is most alive. You can customize th
FREE

It is FREE on EURUSD chart. All Symbols version! Contact me for any questions Introduction The breakout and retest strategy is traded support and resistance levels. it involves price breaking through a previous level. The break and retest strategy is designed to help traders do two main things, the first is to avoid false breakouts. Many false breakouts start with a candlestick that breaks out of a level but ends with an immediate candlestick that brings the price back into the level. The
FREE

Currency RSI Scalper - is a professional indicator based on the popular Relative Strength Index (RSI) indicator. Although the RSI indicator works fine for an interval of the market, it fails to generate profitable signals when the market conditions change, and hence it produces wrong signals resulting in big losses. Have you ever thought about an adaptive RSI indicator that adapts its based on the market conditions? The presented indicator implements an optimization algorithm that finds the

The Market Sessions indicator is a popular tool among forex and stock traders for visually representing global trading sessions on a price chart. It highlights the time periods for major trading sessions — such as the Asian (Tokyo) , European (London) , and American (New York) sessions — directly on the chart. This helps traders identify when markets open and close, allowing for better decision-making based on session-specific trading behavior. - Asian Session (Default: 00:00-09:00) - Lo
FREE

Introducing our exciting new Price Retest indicator! Get instant alerts when the price retests, giving you a powerful edge in your trading strategy. Remember to do your own analysis before making any moves in the market. MT5 Version - https://www.mql5.com/en/market/product/118159/ Join To Learn Market Depth - https://www.mql5.com/en/channels/suvashishfx
Here’s a detailed explanation of how the Price Retest indicator works, its components, and how you can incorporate it into your trading str
FREE

This index is based on the secondary development of supertrend, adding the combination index of Ma mean line user-defined algorithm, NRP, MTF three index weighted realization function.
There are two colors in the batch marking, orange for short and green for long.
Supertrend index is the first artificial intelligence indicator in the whole network --- signal light trading strategy.
It imitates the uncertain concept judgment and reasoning thinking mode of human brain. For the description
FREE
About Range Explosion Range Explosion is a powerful and free trading tool designed to detect market ranges, draw precise support and resistance zones, and identify breakout opportunities with accuracy and style.
It is a part of the Break Out Explosion Project, offering traders a reliable and visually advanced solution for both beginners and professionals. MT5 Version of this product is available here : https://www.mql5.com/en/market/product/153004 If you are interested in breakout trading concep
FREE

The indicator allows you to determine the current price direction and market volatility. This version of the Traders Dynamic Index (TDI) has the redrawing of the historical data eliminated, the algorithm calculation speed optimized, more external parameters for a more precise adjustments, and its functionalities extended: added the selection of the initial oscillator and the smoothing methods of the averages. Parameters: Mode Osc - estimation oscillator selection; Period Osc - the calculation p

A trend indicator based on the Hull Moving Average (HMA) with two periods. The Hull Moving Average is an improved variant of the moving average, which shows the moment of trend reversal quite accurately. It is often used as a signal filter. Combination of two types of Hull Moving Averages makes a better use of these advantages: HMA with a slow period identifies the trend, while HMA with a fast period determines the short-term movements and signals in the trend direction.
Features The movement d
FREE

KT MACD Alerts is a personal implementation of the standard MACD indicator available in Metatrader. It provides alerts and also draws vertical lines for the below two events: When MACD crosses above the zero line. When MACD crosses below the zero line.
Features It comes with an inbuilt MTF scanner, which shows the MACD direction on every time frame. A perfect choice for traders who speculate the MACD crossovers above/below the zero line. Along with the alerts, it also draws the vertical lines
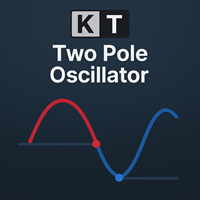
The KT Two Pole Oscillator is designed to help traders spot precise market signals using an advanced smoothing method. It combines deviation-based calculations with a unique two-pole filtering approach, resulting in clear visual signals that traders can easily interpret and act upon. Thanks to its adaptive nature, the two pole filter remains consistent across different market conditions, making it a versatile tool whether the market is trending or ranging.
Features
Two-Pole Filtering: Smooths t
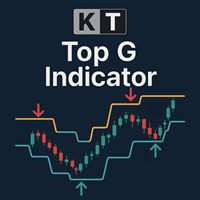
KT Top G is a price action-based indicator that combines smart channel analysis to identify potential market tops and bottoms. When a possible reversal is detected, it plots bold, clear arrows on the chart, giving you a heads-up before the market turns. Big Arrows: Highlight high-probability market tops and bottoms by detecting price exhaustion and momentum shifts. Small Arrows: Indicate lower-probability turning points, which often get broken before the market actually reverses.
Features Broad
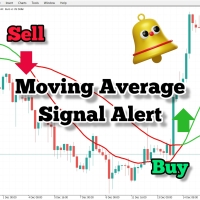
Ultimate Moving Average Crossover Alert Indicator Unlock the power of moving averages with our sophisticated crossover alert indicator, designed to enhance your trading strategy and ensure you never miss a crucial signal. Key Features Our Moving Average Crossover Alert Indicator is essential for traders who rely on moving averages. It not only identifies crossovers but also provides multiple forms of alerts to keep you informed, wherever you are. 1. Real-Time Alerts: Crossover Notifications:
FREE
Trend trading is a strategy where traders aim to enter positions in the direction of the primary price movement and hold them until the trend reverses. Anti EMA MT4 is a professional indicator for the MetaTrader 4 terminal that can be a useful tool in such trading because it focuses on long-term price data, helping to identify sustained moves and avoid false signals caused by short-term fluctuations. MetaTrader 5 version of Anti EMA: https://www.mql5.com/en/market/product/152766 One of the key
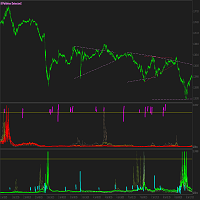
Hello Guys, WinningSpell Indicator (No Repaint) shows Buyers and Sellers activity on any given chart and timeframe of any quote that is available in MT4 platform. It calculates those values by a sophisticated formulae that I have discovered a long time ago and improved over the years. It uses OHLCV values of every M1 bar to make the calculation for any timeframe by a formulae and represents those values via oscillator creating waves of spikes. It can be easily used as a system by its own, or be
SL Curruncy impulse https://www.mql5.com/en/market/product/82593 SL Session Strength 28 Pair flow of this intraday Asian London New York Sessions strength.SL Session Strength 28 indicator best for intraday scalper. market powerful move time you can catch best symbol. because you'll know which currencies are best to trade at that moment. Buy strong currencies and sell weak currencies (Diverging currencies). Suggested timeframes to trading : M5 - M15 - M30 - You can however just change session

Chart Patterns Detect 15 patterns (Ascending Triangle, Descending Triangle, Rising Wedge, Falling Wedge, Bullish Flag, Bearish Flag, Bullish Rectangle, Bearish Rectangle Symmetrical triangle, Head and Shoulders, Inverted Head and Shoulders, Triple top, Triple Bottom, Double Top, Double Bottom) Use historical data to calculate the probability of each pattern to succeed (possibility to filter notification according to the chance of success) gives graphic indication about the invalidation level and

Are you tired of manually drawing Fibonacci levels on your charts? Are you looking for a convenient and efficient way to identify key support and resistance levels in your trading? Look no further! Introducing DrawFib Pro, the ultimate MetaTrader 4 indicator that does auto f ibonacci levels drawing on your charts and provides timely alerts when these levels are breached. With Draw Fib Pro, you can enhance your trading strategies, save time, and make more informed decisions. My fibonacci bas
FREE

MT5 version | Trend Monitor VZ Indicator | Owl Smart Levels Indicator | Owl Smart Levels Strategy | FAQ The Elliott wave theory is an interpretation of processes in financial markets that relies on a visual model of waves on price charts. The Valable ZigZag indicator displays the wave structure of the market, which can be used to make trading decisions. The Valable ZigZag indicator is more stable and does not often change its direction like the classic ZigZag indicator, misleadin
FREE

Was: $299 Now: $99 Supply Demand uses previous price action to identify potential imbalances between buyers and sellers. The key is to identify the better odds zones, not just the untouched ones. Blahtech Supply Demand indicator delivers functionality previously unavailable on any trading platform. This 4-in-1 indicator not only highlights the higher probability zones using a multi-criteria strength engine, but also combines it with multi-timeframe trend analysis, previously confirmed swings
The MetaTrader Market is the best place to sell trading robots and technical indicators.
You only need to develop an application for the MetaTrader platform with an attractive design and a good description. We will explain you how to publish your product on the Market to offer it to millions of MetaTrader users.
You are missing trading opportunities:
- Free trading apps
- Over 8,000 signals for copying
- Economic news for exploring financial markets
Registration
Log in
If you do not have an account, please register
Allow the use of cookies to log in to the MQL5.com website.
Please enable the necessary setting in your browser, otherwise you will not be able to log in.