MetaTrader 4용 기술 지표 - 3
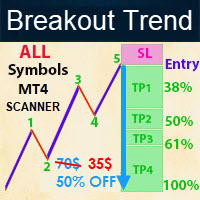
- Real price is 70$ - 50% Discount (It is 35$ now) Contact me for instruction, any questions! - Lifetime update free - Non-repaint - I just sell my products in Elif Kaya Profile, any other websites are stolen old versions, So no any new updates or support. Introduction Breakout Trend Scanner indicator works based on the Elliott Wave in technical analysis describes price movements in the financial market that are related to changes in trader sentiment and psychology and finds end of movement and

Currency Strength Meter is the easiest way to identify strong and weak currencies. This indicator shows the relative strength of 8 major currencies + Gold: AUD, CAD, CHF, EUR, GBP, JPY, NZD, USD, XAU. Gold symbol can be changed to other symbols like XAG, XAU etc.
By default the strength value is normalised to the range from 0 to 100 for RSI algorithm: The value above 60 means strong currency; The value below 40 means weak currency;
This indicator needs the data of all 28 major currency pairs a

대칭 삼각형 차트 패턴은 가격이 강제로 상승 또는 붕괴되기 전에 수축 및 통합 기간을 나타냅니다. 하단 추세선에서의 분석은 새로운 약세 추세의 시작을 나타내고 상단 추세선의 이탈은 새로운 강세 추세의 시작을 나타냅니다. 대시보드를 사용하여 대칭 삼각형 패턴으로 거래하는 모든 상품과 시간 프레임을 한 번에 모니터링하십시오! https://www.mql5.com/en/market/product/69169/
MT5 버전 사용 가능: https://www.mql5.com/en/market/product/70006/
이 표시기는 이러한 패턴을 식별하고 4가지 핵심 포인트가 형성되고 가격이 다시 삼각형으로 되돌아갔을 때 경고하므로 잠재적인 돌파에 대비할 수 있습니다. 대칭 삼각형이 항상 완벽하게 대칭인 것은 아니며 가격이 오르거나 내릴 수 있지만 일반적으로 가장 성공적인 돌파는 삼각형의 첫 번째 점을 형성한 높거나 낮은 방향입니다. 따라서 지표는 돌파에 대한 강세 또는 약세 편향을 제공하

우리의 지지 또는 저항 수준은 시장의 가격 움직임이 반전되고 방향이 바뀌면서 시장에 고점 또는 저점(스윙 포인트)을 남길 때 형성됩니다. 지원 및 저항 수준은 거래 범위를 개척할 수 있습니다. 지표는 지표 세트에 정의된 X개의 막대( 기간 )를 기반으로 스윙 하이 및 스윙 로우를 식별합니다.
참고: 가격 조치 표시기가 마음에 들면 하나의 추세 표시기(추세 스크리너, 추세선, 강한 추세 및 추세 반전 신호 등)를 모두 사용해 보십시오. 그것을 얻으려면 , 여기를 클릭하십시오
주요 특징들 기술적 분석의 핵심 개념은 저항이나 지지 수준이 무너지면 그 역할이 역전된다는 것입니다. 가격이 지원 수준 아래로 떨어지면 그 수준은 저항이 될 것입니다. 가격이 저항선 위로 올라가면 종종 지지선이 됩니다. 수평 지원 및 저항 수준은 이러한 수준의 가장 기본적인 유형입니다. 그들은 단순히 수평선으로 식별됩니다.
차트의 녹색 레벨은 저항 레벨입니다. 차트의 빨간색 레벨은 지원 레벨입니다.
우리의
FREE

이 프로젝트를 좋아한다면 5 스타 리뷰를 남겨주세요. Volume-weighted average price는 총 거래량에 거래된 값의 비율입니다.
특정 시간대에 거래. 평균 가격의 측정입니다.
주식은 거래 수평선에 거래됩니다. VWAP는 종종 사용됩니다.
투자자의 거래 벤치 마크는 가능한 한 수동으로
실행. 이 지시자로 당신은 VWAP를 당길 수 있을 것입니다: 현재 날. 현재 주. 현재 달. 현재 분기. 현재 년. 또는: 이전 날. 이전 주. 지난 달. 이전 분기. 이전 연도.
FREE

다시 색을 칠하지 않고 거래에 진입할 수 있는 정확한 신호를 제공하는 MT4용 지표입니다. 외환, 암호화폐, 금속, 주식, 지수 등 모든 금융 자산에 적용할 수 있습니다. 매우 정확한 추정값을 제공하고 매수와 매도의 가장 좋은 시점을 알려줍니다. 하나의 시그널로 수익을 내는 지표의 예와 함께 비디오 (6:22)시청하십시오! 대부분의 거래자는 Entry Points Pro 지표의 도움으로 첫 거래 주 동안 트레이딩 결과를 개선합니다. 저희의 Telegram Group 을 구독하세요! Entry Points Pro 지표의 좋은점. 재도색이 없는 진입 신호
신호가 나타나고 확인되면(시그널 캔들이 완성된 경우) 신호는 더 이상 사라지지 않습니다. 여타 보조지표의 경우 신호를 표시한 다음 제거되기 때문에 큰 재정적 손실로 이어집니다.
오류 없는 거래 게시
알고리즘을 통해 트레이드(진입 또는 청산)를 할 이상적인 순간을 찾을 수 있으며, 이를 통해 이를 사용하는 모든 거래자의 성공률이

Volume Footprint Analysis is a precision-engineered, volume-based indicator that transforms raw market volume into an intuitive, color-coded signal system. Built on concepts from Volume Spread Analysis (VSA) and Smart Money principles, this tool removes the guesswork from volume interpretation and gives traders clear, actionable insights on when to buy or sell — on any timeframe and across any trading instrument. MT5 Version - https://www.mql5.com/en/market/product/138565/ Join To Learn Mark

This Supply & Demand indicator uses a unique price action detection to calculate and measures the supply & demand area. The indicator will ensure the area are fresh and have a significant low risk zone. Our Supply Demand indicator delivers functionality previously unavailable on any trading platform.
Trading idea You may set pending orders along the supply & demand area. You may enter a trade directly upon price hit the specific area (after a rejection confirmed).
Input parameters Signal - Set

无重绘、无滞后。 修正趋势步长 (CTS) 是由 A. Uhl 设计的一种快速自适应移动平均线,旨在作为交易中的响应指标,通常与速度较慢的修正移动平均线 (CMA) 结合使用,构建交叉系统。它能够适应市场波动,从而减少横盘整理或区间震荡行情中的虚假信号。
修正趋势步长的关键特性包括:
目的:旨在通过调整以适应当前价格走势,从而改进传统的移动平均线。
方法:基于指数平均,它最大限度地减少了传统平均线在非趋势市场中产生虚假交叉的问题。
功能:它被设计为完整交叉系统中的“快速”自适应组件。 • 更贴近价格 • 更适合作为 快线 • 在趋势中反应迅速 • 在震荡中自动“钝化” InpLength (14) : 计算方差的周期,默认100。与 CMA 配合使用时常用相同周期或更短周期 InpMult (1.0) : 乘数,通常保持1.0 InpPrice (PRICE_CLOSE) : 应用价格类型,可选择收盘价、开盘价、高低点等

MT5 버전은 여기에서 이용 가능합니다:
https://www.mql5.com/en/market/product/50048 텔레그램 채널 & 그룹:
https://t.me/bluedigitsfx V.I.P 그룹 접속:
유료 제품 구매 증빙을 메시지로 보내주세요 추천 브로커:
https://bit.ly/BlueDigitsFxStarTrader BlueDigitsFx Easy 123 System — MT4용 강력한 반전 및 돌파 감지 시스템 초보자와 전문가 모두를 위한, 시장 구조 변화, 돌파 및 추세 반전을 쉽고 명확하게 감지할 수 있는 올인원 논리 재도색 방지(Non-Repaint) 인디케이터입니다. 이 인디케이터는 "123" 패턴을 따릅니다: 1단계: 잠재적 과매수/과매도 지점에서 큰 화살표로 새로운 고점 또는 저점을 식별 2단계: 구조가 깨졌음을 신호로 보내 추세 반전 가능성을 확인 3단계: 작은 화살표와 지지/저항 점으로 진입 신호를 확정 참고: 큰 화살표는 봉이 종료될

현재 26% 할인!!
이 지표는 두 주요 지표( Advanced Currency Strength 28 & Advanced Currency IMPULSE with ALERT )의 슈퍼 조합입니다. TICK-UNITS에 대한 통화 강도 값과 28개 Forex 쌍에 대한 경고 신호를 보여줍니다. 11개의 다른 틱 단위를 사용할 수 있습니다. 1, 2, 3, 4, 5, 6, 10, 12, 15, 20, 30초입니다. 두 번째 타이머 내에 최소 1틱이 있으면 하위 창의 Tick-Unit 막대가 표시되고 왼쪽으로 이동합니다.
단 하나의 차트로 28 Forex 페어를 스캘핑할 수 있습니다! 스캘핑 기회의 정확한 트리거 포인트를 정확히 찾아낼 수 있기 때문에 스캘핑이 어떻게 개선될지 상상해 보십시오.
그것은 1분보다 낮은 기간에 작동하는 시장의 첫 번째 통화 강도 지표입니다! 그것은 시장에 빠르게 들어오고 나가고 시장에서 작은 핍을 잘라내기를 원하는 빠른 스캘퍼를 위한 것입니다.
사

The official release price is $65 only for the first 10 copies, ( only 2 copies left ). Next price: $125 Gold Scalper System is a multifunctional trading system that combines a breakout strategy for key liquidity levels with confirmation and a built-in Smart DOM Pro module for market depth analysis. The system identifies zones of limit order accumulat

The "Gold Trader Pro Indicator" is an advanced technical analysis tool for the MetaTrader 4 platform, designed to help you make informed trading decisions about gold. Using a combination of moving averages, RSI, ADX, MACD, and volume analysis, this indicator provides clear trading signals across multiple timeframes, including M5, M15, M30, H1, H4, and D1. My indicators for free. I only ask that leave your feedback to help me improve them or as a thank you. Have a good trade! Main Features Multi
FREE

Apollo BuySell Predictor 는 여러 거래 모듈을 포함하는 전문 거래 시스템입니다. 트레이더에게 고유한 브레이크아웃 영역, 피보나치 기반 지원 및 저항 수준, 피벗 추세선, 풀백 볼륨 신호 및 모든 트레이더가 매일 필요로 하는 기타 유용한 기능을 제공합니다. 시스템은 모든 쌍과 함께 작동합니다. 권장 시간 프레임은 M30, H1, H4입니다. 지표는 H4보다 높은 시간 프레임을 제외하고 다른 시간 프레임에서도 작동할 수 있습니다. 이 시스템은 모든 트레이더가 성공적인 거래에 필요한 모든 것을 제공하므로 보편적입니다. 이 시스템은 여러 가지 방법으로 사용할 수 있습니다. 데이 트레이딩, 스윙 트레이딩, 심지어 스캘핑까지 사용할 수 있습니다. 귀하가 선호하는 거래 스타일에 관계없이 시스템은 귀하가 시장을 실제 모습으로 볼 수 있도록 도와줄 것입니다. 모든 신호는 다시 칠하지 않고 지체하지 마십시오! 거래 기본 설정 및 작업에 따라 시스템의 다른 모듈을 켜거나 끌 수 있습

비교할 수 없는 공정가치 갭 MT4 지표(FVG)로 전에 없던 거래를 경험해보세요.
동급 최고로 평가받고 있습니다. 이 MQL5 시장 지표는 평범함을 넘어
트레이더들에게 시장 동향에 대한 탁월한 수준의 정확성과 통찰력을 제공합니다. EA 버전: WH Fair Value Gap EA MT4
SMC 기반 지표: WH SMC Indicator MT4 특징:
동급 최고 공정가치 갭 분석. 다중 시간대 지원. 맞춤형. 실시간 알림. 사용자 친화적 완벽함 원활한 호환성 이익:
비교할 수 없는 정밀성: 가장 뛰어난 공정가치 갭 지표를 손쉽게 파악할 수 있다는 사실을 알고 자신감을 가지고 결정을 내리세요. 최적화된 위험 관리: 자산의 실제 공정가치를 활용해 시장 조정을 파악하고 탁월한 정확성으로 위험을 관리합니다. 최고의 다재다능함: 데이 트레이딩, 스윙 트레이딩, 장기 투자 등 원하는 거래 스타일에 맞춰 지표를 맞춤 설정하세요. 다양한 시간대와 상
FREE
MT5 버전은 여기에서 확인하세요:
https://www.mql5.com/en/market/product/50538 텔레그램 채널 및 그룹:
https://t.me/bluedigitsfx VIP 그룹 접근:
유료 제품 결제 영수증을 쪽지로 보내주세요 추천 브로커:
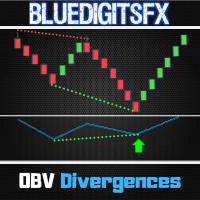
https://bit.ly/BlueDigitsFxStarTrader BlueDigitsFx OBV Divergence — OBV 다이버전스를 감지하여 시장 반전을 예측하는 강력한 MT4 지표 BlueDigitsFx OBV Divergence 지표는 가격과 온밸런스 볼륨(OBV)을 분석하여 강세 및 약세 다이버전스를 자동으로 감지하고, 잠재적인 추세 반전 또는 지속 신호를 제공합니다. 가격 움직임과 거래량 간의 다이버전스 패턴을 강조하여, 높은 확률의 진입 및 청산 시점을 찾아줍니다. 주요 기능 강세 및 약세 OBV 다이버전스 자동 감지 모든 타임프레임과 통화쌍 지원 팝업, 이메일, 푸시 알림 등 맞춤형 다이버전스
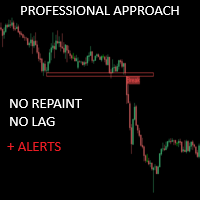
크리티컬 존은 보다 정확한 시장 진입을 원하는 수동 트레이더를 위해 특별히 개발되었습니다. 이 인디케이터는 고급 알고리즘을 사용해 차트에서 가장 관련성이 높은 지지선과 저항선, 돌파 및 재테스트를 계산하여 관심 영역을 감지합니다. 이 지표는 잠재적으로 수익성 있는 매수/매도 기회가 감지되면 경고 및 알림을 보내도록 구성할 수 있어 트레이더가 화면/ MT5 버전 앞에 있지 않아도 거래 기회를 놓치지 않고 파악할 수 있습니다.
특징 다시 칠하지 않음 이 표시기는 새 데이터가 도착해도 값이 변경되지 않습니다 거래 쌍 모든 외환 쌍 계절성 모든 계절성
매개변수 ===== 지지 및 저항 구성 =====
계산을 위해 볼 막대 // 지지 및 저항 수준을 계산하기 위해 현재 막대에서 거꾸로 된 막대 범위
===== 조건 =====
브레이크아웃 // 브레이크아웃 감지를 켜거나 끕니다.
재테스트 // 재테스트 감지를 활성화 또는 비활성화합니다.
===== 지지 및 저항 스타일
FREE

Available for MT4 and MT5 . Join the Market Structure Patterns channel to download materials available for study and/or additional informations.
Related posts: Market Structure Patterns - Introduction Beyond Fancy Order Blocks: Using True Volumetric Analysis with Market Structure Patterns & Timeless Charts Market Structure Patterns is an indicator based on smart money concepts that displays SMC/ICT elements that can take your trading decisions to the next level. Take advantage

The indicator very accurately determines the levels of the possible end of the trend and profit fixing. The method of determining levels is based on the ideas of W.D.Gann, using an algorithm developed by his follower Kirill Borovsky. Extremely high reliability of reaching levels (according to K. Borovsky - 80-90%) Indispensable for any trading strategy – every trader needs to determine the exit point from the market! Precisely determines targets on any timeframes and any instruments (forex, met

THE ONLY CURRENCY STRENGTH INDICATOR THAT IS BASED ON PRICE ACTION. DESIGNED FOR TREND, MOMENTUM & REVERSAL TRADERS
This indicator reads price action to confirm trend and strength . Advanced multi-currency and multi-time frame indicator that shows you simply by looking at one chart, every currency pair that is trending and the strongest and weakest currencies driving those trends.
For full details on how to use this indicator, and also how to get a FREE chart tool, please see user manual HERE

Reversal Zones Pro is an indicator specifically designed to accurately identify key trend reversal zones. It calculates the average true range of price movement from the lower to upper boundaries and visually displays potential zones directly on the chart, helping traders effectively identify important trend reversal points. Key Features: Reversal Zone Identification: The indicator visually displays potential reversal zones directly on the chart. This helps traders effectively identify importan

MT5 버전 Golden Hunter 는 수동으로 시장을 거래하는 트레이더를 위해 개발되었습니다. 3가지 지표로 구성된 매우 강력한 도구입니다. 강력한 진입 전략: 통화 쌍의 변동성을 측정하고 시장 추세를 식별하는 지표로 구성됩니다. LSMA: 가격 데이터를 평활화하고 단기 추세 파악에 유용합니다. Heikin Ashi: 지표가 차트에 연결되면 일본 캔들은 Heikin Ashi 캔들로 변경됩니다. 이러한 유형의 양초는 가격 정보를 부드럽게 하여 강력한 추세를 파악할 수 있도록 합니다.
형질 다시 칠하지 마십시오
이 표시기는 새 데이터가 도착해도 값을 변경하지 않습니다
스프레드가
매우 낮고 변동성이 큰 거래 쌍(EURUSD, GBPUSD, BTCUSD…). 범위(범위) 쌍을 사용하는 것은 권장되지 않습니다
기간
M5
거래
시간 시장에서 더 많은 움직임이 있고 스프레드가 낮은 시간대에 거래하는 것이 좋습니다
Buffers Buy Buffer: 9 / Sell Buff
FREE
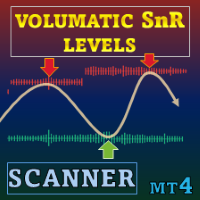
특별 할인 : ALL TOOLS , 개당 $35 ! 신규 도구 는 $30 로 첫 주 또는 첫 3회 구매 에 제공됩니다! Trading Tools Channel on MQL5 : 최신 소식을 받으려면 제 MQL5 채널에 참여하세요 Volumatic Support/Resistance Levels Scanner는 가격 구조에 거래량 맥락을 추가하는 지지/저항 지표입니다. 최근 피벗 주위에 거래 활동이 어떻게 모이는지를 보여 주어 매수 또는 매도 관심이 가장 활발한 지점을 파악할 수 있습니다. MT5 버전 보기: Volumatic Support Resistance Levels MT5 Scanner 더 많은 제품 보기: All P roducts 1 · 개요 이 지표는 최근 고점과 저점에서 가격 영역을 그린 뒤 각 영역에 거래량 히스토그램을 오버레이합니다. 히스토그램 두께는 현재 활동에 따라 늘어나거나 줄어들어 시장이 특정 레벨에 얼마나 주목하는지 판단할 수 있습

Was: $49 Now: $33 Blahtech Better Volume provides an enhanced version of the vertical volume bars. Each bar is compared to the previous 20 bars. Depending on its volume, range and volume density it will be assigned a state and colour. Low Volume – Minimum volume High Churn – Significant volume with limited movement Climax Neutral – High volume with unclear direction
Climax Up – High volume with bullish direction Climax Dn – High volume with bearish direction Climax Churn – High vol

"Wouldn't we all love to reliably know when a stock is starting to trend, and when it is in flat territory? An indicator that would somehow tell you to ignore the head fakes and shakeouts, and focus only on the move that counts?" The Choppiness Index is a non-directional indicator designed to determine if the market is choppy (trading sideways) or not choppy (trading within a trend in either direction). It is an oscillating indicator between -50 (very trendy) and +50 (very choppy). There are man
This indicator provides a true volume surrogate based on tick volumes. It uses a specific formula for calculation of a near to real estimation of trade volumes distribution , which may be very handy for instruments where only tick volumes are available. Please note that absolute values of the indicator do not correspond to any real volumes data, but the distribution itself, including overall shape and behavior, is similar to real volumes' shape and behavior of related instruments (for example, c
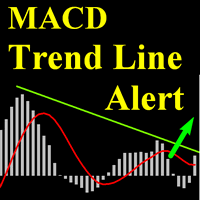
This indicator is an upgrade of traditional MACD on MT4. It can alert and push notificaton (if configured) when : - MACD line cross Signal Line -MACD line cross Zero -MACD cross Trend Line -MACD cross Horizontal Line It has two working mode: on ClosedCandle and on RunningCandle. With ClosedCandle mode, it only alert when a candle is closed. Trader only draw a line (trend line or horizontal line) on MACD indicator window and the indicator will automatically find that line and check if it is cros

The SuperTrend indicator is a popular technical analysis tool used by traders and investors to identify trends in the price of a financial instrument, such as a stock, currency pair, or commodity. It is primarily used in chart analysis to help traders make decisions about entering or exiting positions in the market. this version of super trend indicator is exactly converted from trading view to be used in MT4
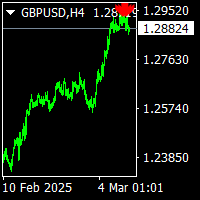
sinus arrows indicator is norepaint arrows indicator. it works all timeframes and all pairs. suitable for experienced traders and beginners. gives red arrows for sell.and gives blue arrows for buy. traders must check the all timeframes.i mean when trading 5m charts also need the check 15m charts and 1m charts. there is cnt number to see the how much bars back bars.
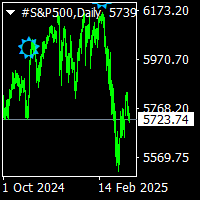
Star arrows indicator is no repaint arrow sindicator. it is sutable for experienced trader and beginners. it work all timeframe and all pairs. easy to to use.gives star arrows top and bottoms. if arrow up the price that is sell signals. if arrows below prices it is buy signal. cnt is bars back number and settled default 1000. it can be raised acording to charts bar numbers.

COMMERCIAL SESSIONS This indicator shows in the selected graph divided by tables each of the sessions ASIA, JAPAN, LONDON, NEW YORK: Allows you to configure: Session Color ASIA, JAPON, LONDRES, NEW YORK Hide and show each session It works in the lowest timeframes on the market, among which H4, H1, M15, M5 and M1 are recommended. (Don't forget to check out our other indicators)
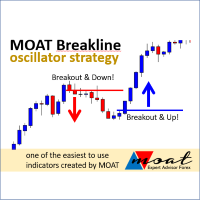
The indicator will provide a breakout line or price stop guide, we recommend M5 or H1 timeframes. Trade signal: Buy Signal: if the closed price (according to the timeframe) breaks the blue line and is already above it or if the lowest price stops above the red line. Sell Signal : if the closing price (according to the timeframe) breaks the red line and is already below it or if the highest price stops below the blue line. Feature: You will get time (hours) and price values for the lines

*This is tradingview indicator converted to mql4*
The Chandelier Exit Indicator is a popular technical analysis tool developed by Chuck LeBeau. It is designed to help traders identify potential exit points for their trades based on market volatility and the concept of trailing stops. The Chandelier Exit Indicator consists of three main components: Average True Range (ATR): The indicator utilizes the Average True Range, which measures market volatility. The ATR calculates the average range betwe
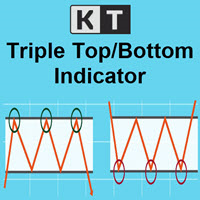
KT Triple Top-Bottom identifies the triple top/bottom pattern with a breakout signal in the opposite direction. It is used to identify potential trend reversals.
A Triple Top pattern is formed when the price reaches a high point three times, while a Triple Bottom pattern occurs when the price comes to a low point three times.
Features The indicator detects the triple top/bottom pattern with high precision and accuracy. The indicator suggests a shift in momentum, with sellers or buyers taking

Auto Channel Trend The Auto Channel Trend Indicator is a technical analysis tool that automatically draws trend channels on any chart. It uses a simple algorithm to identify the trend direction and then draws two parallel lines that represent the support and resistance levels of the channel. Features: Automatic trend channel drawing Support and resistance levels Trend direction identification Customizable parameters How to use: Add the indicator to your chart. Adjust the parameters to your likin

Super Trend Button Super Trend is a trading strategy according to which one should trade Forex or Stocks when its price trend goes up, and trend goes down, expecting price movements to continue. “The trend is your friend” agree? Features - Special Button : Quick hide/show Super Trend chart. ( Make your Chart more clean and clear easily) - Color : You have the option of customising your favourite colour of Up Trend or Down Trend . - Super Trend Periods : You have the option to c

The indicator is a polyline (ZigZag segment) that tracks and connects the extreme points of the chart price that are at least a specified size apart from each other in points on the price scale.
The one and only setting is the minimum size (in points) of a ZigZag segment. The indicator displays levels to determine a possible trend reversal:
level "LevelForUp" - the breaking of this level determines the possible reversal of the trend up (to buy);
level " LevelForDown " - the breaking o

지원 및 저항 수준 찾기 도구:
지원 및 저항 수준 찾기는 거래에서 기술적 분석을 향상시키기 위해 설계된 고급 도구입니다. 동적 지원 및 저항 수준을 갖추고 있어 차트에서 새로운 키포인트가 펼쳐짐에 따라 실시간으로 적응하여 동적이고 반응이 빠른 분석을 제공합니다. 독특한 다중 시간대 기능을 통해 사용자는 원하는 시간대에서 다양한 시간대의 지원 및 저항 수준을 표시할 수 있으며, 5분 차트에 일일 수준을 표시하는 등 세밀한 시각을 제공합니다. 역사적 데이터 세트를 포함한 스마트 알고리즘을 사용하여 다른 S&R 지표와 차별화되는 포괄적인 분석을 보장합니다. 수준을 감지할 때 다중 매개변수 계산을 사용하여 정확성을 높입니다. 사용자는 지원 및 저항 수준의 색상을 개별적으로 사용자 정의하여 개인화된 시각적 경험을 만들 수 있습니다. 도구에는 가격이 중요한 수준에 접근할 때 거래자에게 알림 기능이 포함되어 시기적절한 결정을 돕습니다. 숨기기 및 표시 버튼과 수준의 가시성을 빠르게 전환하기
FREE

Was: $99 Now: $49
Blahtech Daily Range indicator displays the average daily range alongside the individual session ranges. Using the daily open price as a reference the indicator shows fixed range and dynamic range targets as lines on the charts. These lines clearly show when the average range has been exhausted. Daily and session ranges can be useful for confirming entries or setting targets and is an excellent odds enhancer for many trading systems. Links [ Documentation | Install

100 Indicators Magic Signal-V4
This system is built for traders who want to eliminate second-guessing. It processes data from 100 distinct handles—including Trend, Momentum, Volatility, Volume, and Price Action clusters—to provide a unified "Market Consensus." Exclusive Bonus When you purchase this indicator, you receive 2 professional Gold EAs: MT4 Gold EA
XAU Trend Matrix EA – Worth $300 : See the EA https://www.mql5.com/en/market/product/162870 MT5 Gold EA
XAU Steady Gain Pro – Worth $

Gold Venamax - 이것은 최고의 주식 기술 지표입니다. 지표 알고리즘은 자산의 가격 변동을 분석하고 변동성과 잠재적 진입 영역을 반영합니다. 표시기 기능: 이것은 편안하고 수익성 있는 거래를 위한 매직과 두 개의 추세 화살표 블록을 갖춘 슈퍼 지표입니다. 블록 전환을 위한 빨간색 버튼이 차트에 표시됩니다. 매직은 표시기 설정에서 설정되므로 서로 다른 블록을 표시하는 두 개의 차트에 표시기를 설치할 수 있습니다. Gold Venamax는 서로 다른 화살표 버퍼(GV 및 SD)를 사용하여 두 개의 차트에 배치할 수 있습니다. 이렇게 하려면 설정에서 다른 Magic을 선택해야 합니다. 예를 들어 하나는 Magic = 999이고 다른 하나는 Magic = 666입니다. 다음으로 차트의 빨간색 버튼으로 화살표 버퍼를 선택할 수 있습니다. 지표 설정의 각 화살표 버퍼(GV 및 SD)에는 편안하고 수익성 있는 거래를 위한 별도의 화살표 필터가 있습니다(UseFiltrGV = t

A top and bottom indicator that can intuitively identify the trend of the band. It is the best choice for manual trading, without redrawing or drifting. How to get this indicator for free: Learn more Price increase of $20 every 3 days, price increase process: 79--> 99 --> 119...... Up to a target price of $1000. For any novice and programming trading friend, you can write the signal into the EA to play freely. Array 3 and array 4, for example, 3>4 turns green, 3<4 turns red. If you don't underst

주요 목적:"핀 바"는 금융 시장 차트에서 핀 바를 자동으로 감지하도록 설계되었습니다. 핀 바는 특징적인 몸체와 긴 꼬리를 가진 촛불로,추세 반전 또는 교정을 신호 할 수 있습니다.
작동 원리:표시기는 차트의 각 촛불을 분석하여 촛불의 몸,꼬리 및 코의 크기를 결정합니다. 미리 정의 된 매개 변수에 해당하는 핀 막대가 감지되면 표시기는 핀 막대의 방향(강세 또는 약세)에 따라 위 또는 아래 화살표로 차트에 표시합니다.
매개 변수: 꼬리의 길이와 핀 바의 몸체 크기 사이의 최소 비율을 정의합니다. "코"와 핀 바의 꼬리 사이의 최대 허용 비율을 설정합니다. 화살표 크기-표시된 핀 막대와 차트에서 핀 막대를 가리키는 화살표 사이의 거리를 정의합니다. 신청:"핀 바"표시기는 잠재적 인 추세 반전 지점을 식별하고 시장 또는 가까운 위치에 진입하기 위해 신호를 생성하는 데 사용할 수 있습니다. 올바르게 사용하고 다른 기술 지표 및 분석 방법과 결합하면이 지표는 거래 결과를 향상시킬 수
FREE

** All Symbols x All Time frames scan just by pressing scanner button ** *** Contact me to send you instruction and add you in "Divergence group" for sharing or seeing experiences with other users. Introduction MACD divergence is a main technique used to determine trend reversing when it’s time to sell or buy because prices are likely to drop or pick in the charts. The MACD Divergence indicator can help you locate the top and bottom of the market. This indicator finds Regular divergence for pul

The price is indicated only for the first 30 copies ( only 2 copies left ). The next price will be increased to $150 . The final price will be $250. Sniper Delta Imbalance is a professional tool for deep delta analysis — the difference between buyer and seller volumes. It takes volume analysis to the next level, allowing traders to see in real time who controls the price — buyers or sellers
【한정 특가 50% 할인】정가 $79.99, 현재 $39.99 AAA ZigZagFibo PRO EX는 과거 스윙 고점과 저점을 기억하고, 선택한 구간에 피보나치 되돌림/확장선을 그려주는 혁신적인 MT4 지표입니다. 차트상의 컨트롤 패널에서 42개의 피보나치 구간을 실시간으로 제어하세요. 파라미터 창을 열지 않고 원클릭으로 피보나치 모드 전환, 구간 선택, 시간대 변경이 가능합니다. 3가지 지그재그 기간 설정 (파동 크기 제어) 3종류의 지그재그 기간 설정 내장. 1. Short (기간 8) 최근 8개 봉의 고점과 저점으로 작은 파동 감지.
스캘핑과 단기 트레이딩에 적합. 2. Medium (기간 21) 21개 봉으로 중기 파동 감지.
데이 트레이딩과 스윙 트레이딩의 표준 설정. 3. Long (기간 34) 34개 봉으로 큰 파동 감지.
장기 트렌드와 전
Korean "Smart Money" 스캔 (Volume Markers): 평균보다 높은 비정상적인 거래량을 녹색/빨간색 화살표로 명확하게 표시합니다. 이는 **세력(Smart Money)**의 진입을 식별하고 속임수 신호 를 걸러내는 데 도움을 줍니다. 주요 알림 (Alerts): 하루 종일 화면을 지켜볼 필요가 없습니다. 가격이 추세의 지속 또는 반전을 결정하는 중요한 지점인 **POC(매물대 중심)**를 교차할 때 시스템이 즉시 알림을 보냅니다. 실시간 시장 구조 확인 (Developing Profile): 현재 형성되고 있는 가격 주기의 프로필을 보여줍니다. 가격이 매집 구간 을 돌파하고 있는지, 아니면 평균으로 다시 회귀 하고 있는지 파악할 수 있습니다. thank you ..
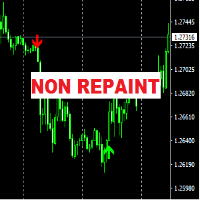
The "FCK Trend Arrow No Repaint" indicator is designed for analyzing market dynamics and determining potential trading signal moments. The main feature of this indicator is the absence of signal repainting, which contributes to more accurate and reliable forecasting of price movements in the market.
Mechanism of Operation: The "FCK Trend Arrow No Repaint" indicator uses several types of graphical elements to indicate trading signals: Up and Down Arrows: The indicator marks possible market entr

추측을 멈추세요. 통계적 우위로 트레이딩을 시작하세요. 주식 지수는 외환과 다르게 거래됩니다. 정해진 세션이 있고, 야간에 갭이 발생하며, 예측 가능한 통계적 패턴을 따릅니다. 이 지표는 DAX, S&P 500, 다우존스와 같은 지수를 자신 있게 거래하는 데 필요한 확률 데이터를 제공합니다. 무엇이 다른가 대부분의 지표는 무엇이 일어났는지 보여줍니다. 이 지표는 다음에 무엇이 일어날 가능성이 있는지 보여줍니다. 매 거래일마다 지표는 100일간의 과거 데이터를 기준으로 현재 설정을 분석합니다. 유사한 갭, 유사한 시가 위치를 가진 날을 찾고, 가격이 주요 레벨에 도달한 빈도를 정확히 계산합니다. 갭이 메워질지, 어제 고점이 테스트될지 더 이상 추측할 필요가 없습니다. 실제 데이터에 기반한 정확한 백분율을 얻게 됩니다. 모든 입력 설명이 포함된 전체 매뉴얼: https://www.mql5.com/en/blogs/post/766370 훌륭한 설정을 찾는 데 도움이 되는 전략 가이드: ht
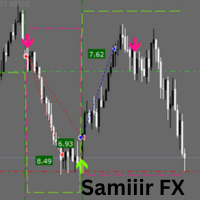
Samiiir FX: Your Ultimate MT4 Trading Companion for Precision and Profit Elevate your trading game with Samiiir FX , a premium MT4 indicator designed to deliver clear, actionable buy and sell signals across forex, commodities, and indices. Built for traders who demand precision and reliability, Samiiir FX combines advanced market analysis with intuitive visuals and robust risk management tools. Whether you're a scalper hunting quick profits, a day trader seeking consistency, or a swing trader a

Smart Fibo Zones are powerful, auto-generated Fibonacci Retracements that are anchored to key market structure shifts . These zones serve as critical Supply and Demand levels, guiding you to identify potential price reactions and confirm market direction. Fibonacci calculations, widely used by professional traders, can be complex when it comes to identifying highs and lows. However, Smart Fibo Zones simplify this process by automatically highlighting order blocks and key zones, complete with St
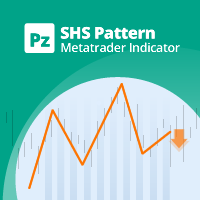
Master head and shoulders patterns for better trading decisions A head and shoulders pattern is a chart formation that resembles a baseline with three peaks, the outside two are close in height and the middle is highest. It predicts a bullish-to-bearish trend reversal and is believed to be one of the most reliable trend reversal patterns. It is one of several top patterns that signal, with varying degrees of accuracy, that a trend is nearing its end. [ Installation Guide | Update Guide | Troubl
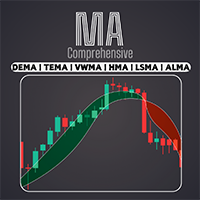
전문 종합 이동평균 지표로 EMA, SMA, WMA 등 다양한 이동평균을 이용할 수 있습니다. 고유한 트레이딩 스타일/ MT5 버전에 맞게 이동평균을 완벽하게 조합하여 기술적 분석을 사용자 지정할 수 있습니다.
특징
서로 다른 설정으로 두 개의 이동평균을 활성화할 수 있습니다. 차트 설정을 사용자 지정할 수 있습니다. 교차 이평선 또는 이평선과 교차한 가격에 따라 캔들 스틱의 색상을 변경할 수 있습니다. 교차 이평선 또는 교차 가격 발생 시 알림 전송.
포함된 이동평균 유형 SMA --------------------> (Simple) EMA --------------------> (Exponential) SMMA [RMA] ----------> (Smoothed) WMA -------------------> (Linear Weighted) DEMA ------------------> (Double EMA) TEMA ------------------>
FREE

" Dynamic Scalper System " 지표는 추세 파동 내에서 스캘핑 방식으로 거래하도록 설계되었습니다.
주요 통화쌍 및 금에서 테스트되었으며, 다른 거래 상품과의 호환성이 가능합니다.
추가적인 가격 변동 지원을 통해 추세에 따라 단기 포지션 진입 신호를 제공합니다.
지표의 원리
큰 화살표는 추세 방향을 결정합니다.
작은 화살표 형태의 스캘핑 신호를 생성하는 알고리즘은 추세 파동 내에서 작동합니다.
빨간색 화살표는 상승 방향을, 파란색 화살표는 하락 방향을 나타냅니다.
민감한 가격 변동선은 추세 방향으로 그려지며, 작은 화살표의 신호와 함께 작용합니다.
신호는 다음과 같이 작동합니다. 적절한 시점에 선이 나타나면 진입 신호가 형성되고, 선이 있는 동안 미결제 포지션을 유지하며, 완료되면 거래를 종료합니다.
권장되는 작업 시간대는 M1~H4입니다.
화살표는 현재 캔들에 형성되며, 다음 캔들이 이미 시작되었더라도 이전 캔들의 화살표는 다시 그려지지 않습니다.
입력 매개

The Fair Value Gap (FVG) is a price range where one side of the market liquidity is offered, typically confirmed by a liquidity void on the lower time frame charts in the same price range. Price can "gap" to create a literal vacuum in trading, resulting in an actual price gap. Fair Value Gaps are most commonly used by price action traders to identify inefficiencies or imbalances in the market, indicating that buying and selling are not equal. If you're following the ICT Trading Strategy or Smart
FREE
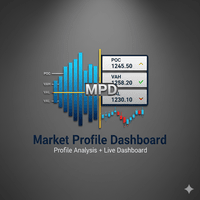
Market Profile with Dashboard Indicator - Complete User Guide
indicator Overview The Market Profile with Dashboard is a comprehensive trading analysis tool for MetaTrader 4 that displays market profile data, volume analysis, and key market structure information directly on your chart. This indicator helps traders identify significant price levels, market balance areas, and potential trading opportunities based on market profile theory.
Core Components and Features
Market Profile Display - Sh

MT5 version | Owl Smart Levels Indicator | Owl Smart Levels 전략 | FAQ
Fractals Indicator 는 Bill Williams 의 저자 거래 전략 요소 중 하나입니다. 가격 차트에서 가격 반전 지점을 검색하고 결과적으로 지원 및 저항 수준을 검색하는 데 사용됩니다. Full Fractals Indicator 는 거의 모든 거래 터미널의 툴킷에서 사용할 수 있는 개선된 Fractals입니다. 유일한 차이점은 프랙탈을 만들기 위해 기본 양초의 왼쪽에 5개의 양초와 오른쪽에 2개의 양초를 사용한다는 것입니다(그림 1 참조). 기본 구성 외에도 Full Fractals는 가격이 한동안 멈춘 수준을 찾습니다. Telegram 채팅: @it_trader_chat 새로운 Expert Advisor Prop Master - 트레이딩 터미널에서 테스트해보세요 https://www.mql5.com/ko/market/pro
FREE

ConfluencePro v2.0 – Ultimate Confluence Indicator for Binary Options & Forex Professional Multi-Filter Signal System with Dashboard, News Filter & Real-Time Statistics ConfluencePro v2.0 is the most advanced confluence-based indicator ever released on the MQL5 Market. It combines 17+ professional filters (Trend, Smart Money Concepts, Market Structure, Divergence, MTF Confirmation, News Events, Volume, Regime Detection and more) into a single, easy-to-read confluence score (0–100%). Only the hi

Adaptive Volatility Range [AVR] is a powerful tool for identifying key trend reversal points. AVR accurately reflects the Average True Range (ATR) of volatility, taking into account the Volume-Weighted Average Price (VWAP). The indicator adapts to any market volatility by calculating the average volatility over a specific period, ensuring a stable rate of profitable trades. You receive not just an indicator but a professional automated trading system , AVR-EA . Advantages: Automated Trading Sys
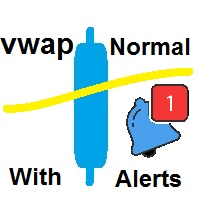
이 VWAP은 간단한 VWAP이지만 가격이 VWAP 라인에 도달하거나 VWAP 라인을 통과 할 때 알리는 알림이 통합되어 있습니다. 이 지표는 MetaTrader 4 (MT4)용 전통적인 VWAP 지표입니다. 기본 매개 변수는 일반적인 VWAP과 동일하지만 VWAP 계산 및 최적화를 수행할 수 있습니다. 가격이 VWAP에 닿거나 VWAP을 통과 할 때 경고, 휴대 전화 알림, 이메일 또는 소리 이벤트로 알림을받을 수 있습니다. MetaTrader 4용 VWAP 고정 지표 . 매개 변수: VWAP 주기 VWAP은 특정 시간 범위 내에서 계산됩니다. 전통적인 VWAP은 매일 새로운 분석을 시작하지만이 지표에서는이 옵션이 기본으로 제공되며 VWAP을 계산하기 위해 원하는 기간을 선택할 수 있습니다. 이는 M1에서 작동하더라도 H1에 대한 VWAP 계산을 시각화할 수 있음을 의미하며 H1에서의 각 새로운 막대에서 갱신됩니다. 이 계산 재시작은 선택한 시간 주기에 따라 발생합니다. 그러나 현
FREE
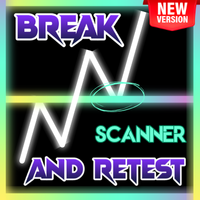
This Indicator only places quality trades when the market is really in your favor with a clear break and retest. Patience is key with this price action strategy!
If you want more alert signals per day, you increase the number next to the parameter called: Support & Resistance Sensitivity. After many months of hard work and dedication, we are extremely proud to present you our Break and Retest price action indicator created from scratch. One of the most complex indicators that we made with over

The Area of Interest (AOI) Indicator is a powerful tool designed to help traders identify key market zones where price reactions are highly probable. This indicator specifically highlights two critical zones: Seller AOI (Area of Interest) : This zone represents areas where sellers are likely to enter the market, often acting as resistance. When the price approaches or touches this zone, it signals that a potential sell-off could occur. Buyer A OI (Area of Interest) : The BOI zone identifies re
FREE

FX Levels: 모든 시장을 위한 뛰어난 정확도의 지지와 저항 간단 요약
통화쌍, 지수, 주식, 원자재 등 어떤 시장이든 믿을 만한 지지·저항 레벨을 찾고 싶나요? FX Levels 는 전통적인 “Lighthouse” 기법과 첨단 동적 접근을 결합해, 거의 보편적인 정확성을 제공합니다. 실제 브로커 경험을 반영하고, 자동화된 일별 업데이트와 실시간 업데이트를 결합함으로써 FX Levels 는 가격 반전 포인트를 파악하고, 수익 목표를 설정하며, 자신 있게 트레이드를 관리할 수 있게 돕습니다. 지금 바로 시도해 보세요—정교한 지지/저항 분석이 어떻게 여러분의 트레이딩을 한 단계 끌어올릴 수 있는지 직접 확인하세요!
1. FX Levels가 트레이더에게 매우 유용한 이유 뛰어난 정확도의 지지·저항 존
• FX Levels 는 다양한 브로커 환경에서도 거의 동일한 존을 생성하도록 설계되어, 데이터 피드나 시간 설정 차이로 인한 불일치를 해소합니다.
• 즉, 어떤 브로커를 사용하

골드 타겟은 최고의 추세 지표입니다. 지표의 고유한 알고리즘은 기술 및 수학적 분석 요소를 고려하여 자산 가격의 움직임을 분석하고 가장 수익성이 높은 진입점을 결정하며 화살표 및 가격 수준(BUY Entry / SELL Entry) 형태로 신호를 발행합니다. 주문을 엽니다. 표시기는 또한 손절매 가격 수준과 이익 실현을 위한 5가지 가격 수준을 즉시 표시합니다.
주의: 표시기는 사용이 매우 쉽습니다. 한 번의 클릭으로 차트에 표시기를 설치하고 신호 및 가격 수준에 따라 거래하세요. 차트에서는 지표가 설치된 시간대에 관계없이 4개의 시간대(M30 H1 H4 D1)에서 추세 상태가 표시됩니다.
지표의 장점:
1. 표시기는 높은 정확도의 신호를 생성합니다. 2. 표시 신호는 다시 그려지지 않습니다. 가격이 각 라인을 넘으면 소리 알림(알림 및 메시지)이 장착됩니다. 3. 모든 브로커의 MetaTrader 4 거래 플랫폼에서 거래할 수 있습니다. 4. 모든 자산(통화, 금속, 암호화
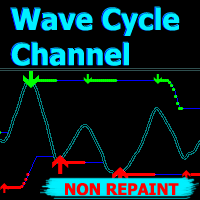
" Wave Cycle Channel " 지표는 순환 오실레이터와 지지 및 저항 채널을 사용하여 가격 방향을 계산합니다.
가격 변동의 전환점을 찾고, 시장의 움직임을 보여주는 반전 지점을 식별합니다.
반전 지점을 파악하고 진입 신호를 찾는 데 사용할 수 있습니다.
지표 작동 방식
오실레이터 파동선은 가격 변동에 따라 조정되며, 시장 변동성과 입력 매개변수에서 지정된 " Oscillator Period "를 기반으로 구성됩니다. 채널은 오실레이터를 중심으로 움직이며 오실레이터 값을 부드럽게 합니다. 오실레이터가 채널의 상한선 또는 하한선에 닿으면 지지/저항력의 작용이 증가하고 가격 반전 가능성도 높아집니다. 큰 화살표가 그려져 있으며, 빨간색 화살표는 상승 반전 신호이고 녹색 화살표는 하락 반전 신호입니다. 반전 중에 오실레이터가 채널에 닿지 않으면 이전에 설정된 신호의 작용이 계속됩니다. 작은 화살표가 그려집니다. 모든 신호 화살표가 그려진 후, 신호 액션 포인트가 그려집니다.

이 지표는 실제 거래에 완벽한 자동 파동 분석 지표입니다! 사례...
참고: 웨이브 그레이딩에 서양식 이름을 사용하는 데 익숙하지 않습니다. Tang Lun(Tang Zhong Shuo Zen)의 명명 규칙의 영향으로 기본 웨이브를 펜 으로 명명하고 2차 웨이브 밴드를 세그먼트 로 명명했습니다. 동시에, 세그먼트에는 추세 방향이 있습니다. 주요 추세 세그먼트에는 이름이 지정되지만(이 이름 지정 방법은 향후 노트에서 사용됩니다. 먼저 말씀드리겠습니다.) 알고리즘은 굴곡 이론과 거의 관련이 없으므로 그렇게 해서는 안 됩니다. 이는 나의 시장 분석을 통해 요약된 끊임없이 변화하고 복잡한 운영 규칙을 반영합니다.
밴드는 더 이상 사람마다 다르지 않도록 표준화되고 정의되었습니다. 인위적인 간섭의 드로잉 방법은 시장 진입을 엄격하게 분석하는 데 핵심적인 역할을 합니다.
이 지표를 사용하는 것은 거래 인터페이스의 미학을 개선하고 원래의 K-line 거래를
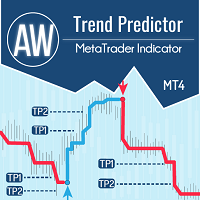
하나의 시스템에서 추세와 고장 수준의 조합입니다. 고급 지표 알고리즘은 시장 노이즈를 필터링하고 추세, 진입점 및 가능한 출구 수준을 결정합니다. 표시기 신호는 통계 모듈에 기록되어 가장 적합한 도구를 선택하여 신호 기록의 효율성을 보여줍니다. 이 표시기는 이익 실현 및 손절매 표시를 계산합니다. 매뉴얼 및 설명 -> 여기 / MT5 버전 -> 여기 지표로 거래하는 방법: Trend Predictor로 거래하는 것은 3단계로 간단합니다. 1단계 - 포지션 열기 70% 이상의 성공률로 매수 신호를 받았습니다. 2단계 - StopLoss 결정 반대 신호로 트렁크 선택 3단계 - 이익 실현 전략 정의 전략 1: TP1 도달 시 전체 포지션 청산 전략 2: TP1 도달 시 포지션의 50% 청산 및 TP2 도달 시 나머지 50% 청산 전략 3: 추세 반전 시 전체 포지션 청산 이익: 결과를 다시 그리지 않음, 신호는 엄격하게 양초가 닫힐 때 어드바이저에서 사용할 수 있습니다. 이

무료이지만 고급 제품 개요 Turbo Trend는 트레이더가 시장 트렌드를 식별하고 이에 따라 행동할 수 있도록 도와주는 강력한 지표입니다. 이 지표는 고급 이동 평균과 거래량 분석을 결합하여 트렌드 방향에 대한 명확한 신호를 제공합니다. Turbo Trend는 시장 상황을 상승 추세 , 하락 추세 및 중립 추세의 세 가지 명확한 상태로 분류하여 쉽게 구별할 수 있는 색상 코딩된 선과 캔들 강조 표시를 사용하여 의사 결정을 단순화합니다. mql5 커뮤니티에서 Koala Trading Solution 채널 에 가입하여 Koala 제품에 대한 최신 뉴스를 확인하세요. 가입 링크는 아래에 있습니다: https://www.mql5.com/en/channels/koalatradingsolution 다른 좋은 무료 도구 방문하기: FVG 인디케이터 : https://www.mql5.com/en/market/product/108907 Turbo Trend 기반 EA가 현재 시장에서 이용
FREE
** All Symbols x All Timeframes scan just by pressing scanner button ** After 18 years of experience in the markets and programming, Winner indicator is ready. I would like to share with you! *** Contact me to send you instruction and add you in "123 scanner group" for sharing or seeing experiences with other users. Introduction The 123 Pattern Scanner indicator with a special enhanced algorithm is a very repetitive common pattern finder with a high success rate . Interestingly, this Winner in

"The trend is your friend" is one of the best known sayings in investing, because capturing large trendy price movements can be extremely profitable. However, trading with the trend is often easier said than done, because many indicators are based on price reversals not trends. These aren't very effective at identifying trendy periods, or predicting whether trends will continue. We developed the Trendiness Index to help address this problem by indicating the strength and direction of price trend
트레이딩 전략과 기술 지표를 판매하기에 가장 좋은 장소가 왜 MetaTrader 마켓인지 알고 계십니까? 광고나 소프트웨어 보호가 필요 없고, 지불 문제도 없습니다. 모든 것이 MetaTrader 마켓에서 제공됩니다.
트레이딩 기회를 놓치고 있어요:
- 무료 트레이딩 앱
- 복사용 8,000 이상의 시그널
- 금융 시장 개척을 위한 경제 뉴스
등록
로그인
계정이 없으시면, 가입하십시오
MQL5.com 웹사이트에 로그인을 하기 위해 쿠키를 허용하십시오.
브라우저에서 필요한 설정을 활성화하시지 않으면, 로그인할 수 없습니다.