适用于MetaTrader 4的技术指标 - 3

Apollo BuySell Predictor 是一个包含多个模块的专业交易系统。该指标为交易者提供价格突破区、基于斐波那契的支撑和阻力位、趋势反转线、交易量信号、回调和任何交易者每天都需要的其他有用功能。该系统将适用于任何一对。推荐的时间框架是 M30、H1、H4。尽管该指标可以与其他时间范围一起使用,但 H4 以上的时间范围除外。 该系统是通用的,因为它提供了任何交易者成功交易所需的一切。该系统可以多种方式使用。该指标可用于日内交易、波段交易甚至剥头皮交易。无论您喜欢哪种交易方式,系统都会帮助您以真实的形式看待市场。所有系统信号都不会被重绘! 您可以根据您的交易偏好和任务启用/禁用各种系统模块。系统提供所有类型的通知,包括PUSH通知。您可以打开/关闭您需要的通知。 购买后请给我发电子邮件。我将与您分享交易说明和重要的红利指标,它们将使您的交易更加有利可图!

MT5版本 黄金猎手是为在市场上手动交易的交易者开发的。它是一个非常强大的工具,由3个不同的指标组成。 强大的进入策略:由一个衡量货币对波动性和识别市场趋势的指标形成。 LSMA:平滑价格数据,对检测短期趋势很有用。 Heikin Ashi:一旦该指标被连接到图表上,日本蜡烛图将变为Heikin Ashi蜡烛图。这种类型的蜡烛图使价格信息更加平滑,从而可以检测到坚实的趋势。
特点 没有重新粉刷
当新数据到来时,该指标不会改变其数值
交易对
具有非常低的点差和波动性的交易对(EURUSD, GBPUSD, BTCUSD...)。不建议使用范围对
时间段
M5
交易时间
最好是在白天进行交易,这时市场上有更多的波动,价差也保持在低水平
Buffers Buy Buffer: 9 / Sell Buffer: 12
要求 对于剥头皮的头寸,必须使用点差小的ECN经纪人。
如何安装 将指标附加到首选的交易对上(时间周期M5)。
配置 默认设置是我发现的对5分钟时间框架最有效的设置。
你可以使用一个最适合你的交易模式的设置。
如何使用它 它的使
FREE

交易会话时间指示器:
“交易会话时间指示器”是一个强大的技术分析工具,旨在增强您对外汇市场中不同交易会话的理解。这个无缝集成的指标提供了关于主要交易会话的开盘和收盘时间的重要信息,包括东京、伦敦和纽约。通过自动时区调整,它为全球交易者提供服务,帮助他们优化交易时间表,以获取高流动性时段,并避开低活跃时段。该指标提供了关于市场情绪、高峰波动期和交叠交易会话的见解,帮助日内交易者做出与其策略一致的精确决策。其可定制的显示允许个性化用户体验,而智能交易计划结合其数据,可能会导致改善的交易结果。通过提高低活跃时段的意识,该指标帮助交易者避免过度交易,并专注于优质机会。与各种交易平台无缝兼容,“交易会话时间指示器”是寻求优化交易路程的交易者的宝贵工具。
特点:
- 优化的时间表:提供主要交易会话时间,并与高流动性相符。 - 电话和电子邮件提醒:在会话开始时提醒您。 - 杀伤区域:使用警报设置ICT风格的杀伤区域。 - 重叠分析:探索会话重叠并针对活动增加。 - 日内精度:帮助日内决策并关注与策略一致的会话。 - 可定制的显示:个性化偏好和颜色设置。 - 智能交易计划:集成以提高生产力并通
FREE

Miraculous 指标 – 100% 不重绘的外汇和二元期权工具,基于江恩九方图 这个视频介绍的 Miraculous 指标 是一款专为外汇和二元期权交易者开发的高精度、强大交易工具。该指标的独特之处在于它建立在传奇的 江恩九方图 和 江恩振动法则 之上,使其成为现代交易中可用的最精确预测工具之一。 Miraculous 指标 完全不重绘 ,这意味着它的信号在 K 线收盘后不会改变或消失——你看到的就是你得到的。这为交易者提供了可靠且一致的基础,让他们能够自信地进出场交易。 主要特点: 基于江恩九方图和江恩理论构建 100% 不重绘的信号系统 适用于所有时间周期(M1、M5、H1、H4、日线、周线) 适用于外汇和二元期权交易 清晰的买卖信号,准确率高 可用于剥头皮、日内交易或波段交易 兼容大多数 MT4 平台 这款工具旨在帮助初学者和专业交易者做出更好、更明智的决策。无论您是交易货币、指数还是二元期权,Miraculous 指标都将为您在市场中提供所需的优势。

The "Gold Trader Pro Indicator" is an advanced technical analysis tool for the MetaTrader 4 platform, designed to help you make informed trading decisions about gold. Using a combination of moving averages, RSI, ADX, MACD, and volume analysis, this indicator provides clear trading signals across multiple timeframes, including M5, M15, M30, H1, H4, and D1. My indicators for free. I only ask that leave your feedback to help me improve them or as a thank you. Have a good trade! Main Features Multi
FREE

本指标是实践实战交易完善的波浪自动分析的指标 ! 案例...
注: 波浪分级用西方叫法不习惯,因受到缠论(缠中说禅)命名方式习惯的影响,我是将基础波浪命名为 笔 ,将二级波段命名为 段 ,同时具有趋势方向的段命名为 主趋段 (以后笔记中都是这种命名方式,先告知大家),但是算法上和缠论关系不大切勿混淆.反映的是本人分析盘面总结的 千变万化纷繁复杂的运行规律 .
对波段进行了标准化定义,不再是不同人不同的浪 , 对人为干扰的画法进行了排除,在严格分析进场起到了关键的作用 .
使用这个指标,等于将交易界面提升美感,抛弃最原始的K线交易带你进入新的交易层次.如果不是为了交易,在宣传上也将使客户观感提升层次. 指标内容: 1. 基础波浪 (笔) : 首先我们找出了价格波动过程中的基础波动拐点,当然他的有序性低,为下一步的计算提供基础. 2. 二级波段( 段 ) :在基础波浪的基础上,通过算法分析得到层级更明显的二级波段,二级波段为波浪提供了分析基础 3. 波浪( 浪 ): 有着更清晰的趋势,更清晰直观的方向.分析一个波浪是否延续,需要看二级波段的形态,分析二级的构成,可以得出波浪后

利用我们无与伦比的公允价值差距 MT4 指标 (FVG),体验前所未有的交易体验
被誉为同类最佳。这款 MQL5 市场指标超越了普通的
为交易者提供无与伦比的精确度和对市场动态的洞察力。 EA版本: WH Fair Value Gap EA MT4
基于SMC的指标: WH SMC Indicator MT4 特征:
一流的公允价值差距分析。 多时间框架支持。 定制。 实时警报。 完美用户友好性 无缝兼容 好处:
无与伦比的精度: 自信地做出决策,因为您知道您拥有绝对最佳的公允价值差距指标。 优化风险管理: 利用资产的真实公允价值,以无与伦比的准确度识别市场调整并管理风险。 最佳的多功能性: 根据您的交易偏好定制指标,无论是日内交易、波段交易还是长线投资。无缝适配不同的时间框架和交易工具。 卓越成就: 经过严格的测试和积极的用户反馈记录,我们的公允价值差距指标在各种市场条件下一直优于竞争对手。
使用终极公允价值缺口指标,将您的交易体验提升至全新高度。立即做出明智的选择,助您成功! **如有任何疑问请联系我**
FREE

Friends, we present to your attention our new Forex Gump Laser indicator. Since there are no designers in our team, but mainly mathematicians, financiers, programmers and traders, we did not make any special changes in the indicator design. In appearance, it resembles the usual Forex Gump. On the other hand, Forex Gump has become not just the name of an indicator, it is a brand. And we try to preserve the corporate identity in all its varieties. The whole essence of the indicator in its operatio

What is a Point of Interest? Traders who follow Smart Money Concepts may call this a Liquidity Point, or where areas of liquidity have been built up by retail traders for for Big Banks to target to create large price movements in the market. As we all know, retail traders that use outdated and unreliable methods of trading like using trendlines, support and resistance, RSI, MACD, and many others to place trades and put their stop losses at keys points in the market. The "Big Banks" know these me

目前有26%的折扣!!
这个指标是我们两个主要指标( Advanced Currency Strength 28 & Advanced Currency IMPULSE with ALERT )的一个超级组合。它显示了28个外汇对的TICK-UNITS货币强度值和警报信号。可以使用11种不同的Tick-Units。它们是1、2、3、4、5、6、10、12、15、20和30秒。子窗口中的Tick-Unit栏将被显示并向左移动,当在一秒钟的定时器中至少有一个Tick。
只用一个图表,你就可以剥28个外汇货币对的头皮!想象一下,你的剥头皮将如何提高。想象一下,你的剥头皮将如何改善,因为你能够准确地确定剥头皮机会的触发点?
这是市场上第一个在比1分钟更短的时间内工作的货币强度指标! 它是为那些希望快速进出并从市场中切出小点数的快速剥头皮者准备的。
用户手册:点击这里 https://www.mql5.com/en/blogs/post/727178
特点。
为28个货币对提供嘀嗒单位的卖出/买入警报,有一个按钮可以快速打开目标图表。 在3种敏感模式中选择一种(慢-中-快

The official release price is $65 only for the first 10 copies, ( only 2 copies left ). Next price: $125 Gold Scalper System is a multifunctional trading system that combines a breakout strategy for key liquidity levels with confirmation and a built-in Smart DOM Pro module for market depth analysis. The system identifies zones of limit order accumulat

The most important price level in any "Volume profile" is the "Point of Control" . This is the price level with the highest trading volume. It is primarily the level where large players initiate their positions, making it the accumulation/distribution level for the "Smart money" .
The idea of the indicator arose after the "MR Volume Profile Rectangles" indicator was made. When creating the "MR Volume Profile Rectangles" indicator, we spent a lot of time comparing the volumes with those from the

ICT, SMC, SMART MONEY CONCEPTS, SMART MONEY, Smart Money Concept, Support and Resistance, Trend Analysis, Price Action, Market Structure, Order Blocks, BOS/CHoCH, Breaker Blocks , Momentum Shift, Supply&Demand Zone/Order Blocks , Strong Imbalance, HH/LL/HL/LH, Fair Value Gap, FVG, Premium & Discount Zones, Fibonacci Retracement, OTE, Buy Side Liquidity, Sell Side Liquidity, BSL/SSL Taken, Equal Highs & Lows, MTF Dashboard, Multiple Time Frame, BigBar, HTF OB, HTF Market Structure,
Smart FVG 指标 MT4 – MetaTrader 4 高级公平价值缺口检测 Smart FVG 指标为 MetaTrader 4 提供专业的公平价值缺口(Fair Value Gap,FVG)检测、监控和告警功能,所有信息都直接显示在图表上。它将基于 ATR 的过滤与结构感知逻辑相结合,帮助你去除噪音、适应流动性,并只保留最关键的不平衡区域,从而做出更加精确的交易决策。
主要优势 精准的 FVG 检测:识别真正的市场低效,而不仅仅是简单的 K 线价格跳空。 基于 ATR 的自适应精度:根据不同市场与周期自动过滤低质量信号。 实时有效性跟踪:当价格填补或突破缺口时,相关区域会被自动延伸、调整或删除。 高度可视化与自定义:可根据任何模板自定义颜色、线型和填充样式。 实用告警功能:对新出现、被填补或被突破的 FVG 提供实时通知。 性能优化:轻量化设计,适合多品种、多周期同时扫描。
工作原理 将指标加载到任意 MT4 品种与时间周期图表上。 算法会扫描历史与实时 K 线,标出当前有效的 FVG 区域。 ATR 逻辑会根据当前波动率和流动性动态调整检测条件。 当价格完全回补缺口
FREE
MT5 版本下载地址:
https://www.mql5.com/en/market/product/50538 Telegram 频道和群组:
https://t.me/bluedigitsfx VIP 群组权限:
请将任何付费产品的付款凭证发送至我们的私信 推荐经纪商:
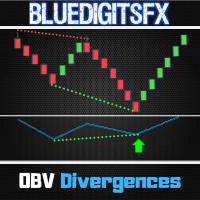
https://bit.ly/BlueDigitsFxStarTrader BlueDigitsFx OBV Divergence — 强大的 MT4 指标,用于识别 OBV 背离并预测市场反转 BlueDigitsFx OBV Divergence 指标通过分析价格和累计能量指标(OBV),自动识别看涨和看跌背离,提前发出潜在趋势反转或延续的信号。通过突出价格行为与成交量之间的背离模式,帮助交易者发现高概率的入场和出场点。 主要功能 自动检测看涨和看跌 OBV 背离 适用于所有时间周期和货币对 可自定义背离信号提醒,包括弹窗、邮件和推送通知 图表上清晰的视觉信号,便于快速识别 轻量且优化设计,确保 MT4 平稳运行 优势 结合成交量和价格分析,提升入场和出场时机 相较于仅基于价格的背离指标,减少错误信号

Renko Charts with Heiken Ashi Filter now have the alerts and the Win-rate . Now you can know which signal will give you that edge your trading needs. Risk to Reward Settings Wins versus Losses Count There are four alert types to choose from for notification on screen, email or phone notification. The alert types also have buffers for use with automation. This indicator can be incorporated with any system that requires renko charts. The four (4) alert types are: Three-bar Formation ; Pinbar

The indicator automatically identifies the 1-2-3 pattern on the chart. The indicator is able to monitor the formation of pattern in real time. It informs the trader when the pattern is completely formed (when the price breaks the line in point 2) and displays the completed patterns in history. The patterns are never redrawn. The indicator can identify patterns on any instruments (currency pairs, stock market, gold, etc.) without the need to adjust to each instrument. Simple and clear visualizati

Horizont 是一个交易系统,提供完整的交易设置:入场点、目标 1、目标 2 和止损——全部自动计算。 系统会自动识别市场的顶部和底部,并将它们连接起来以确定当前趋势。您选择要交易的趋势,Horizont 会生成相应的入场、目标和止损水平。 系统包含自动风险管理功能。它会检查您的账户余额,计算风险,并建议合适的仓位大小。风险回报比(R:R)仅针对第一个目标显示。
所有计算均为即时完成。如果您希望寻找其他机会,可以点击货币面板切换交易品种,以寻找更优的 R:R 比例。 虽然系统主要专注于外汇市场,但也支持金属、指数和加密货币交易(目前处于测试阶段,可能并非所有经纪商都支持)。
系统会为每一个交易设置生成带评级的信号。信号分为一星、二星和三星,其中三星信号代表最高质量。 除了自动化功能外,Horizont 还提供手动模式。双击任意趋势线并将其锚点调整到关键位置,系统将立即根据您修改后的趋势重新计算新的交易信号。 货币面板通过颜色来区分各个交易品种的趋势强度:
绿色表示上涨趋势,红色表示下跌趋势。
颜色深浅反映强度:浅绿色强于深绿色,浅红色弱于深红色。
这种可视化方式可以帮助您快速识别最

Reversal Zones Pro is an indicator specifically designed to accurately identify key trend reversal zones. It calculates the average true range of price movement from the lower to upper boundaries and visually displays potential zones directly on the chart, helping traders effectively identify important trend reversal points. Key Features: Reversal Zone Identification: The indicator visually displays potential reversal zones directly on the chart. This helps traders effectively identify importan

如果你象这个项目一样,就有5个饥饿审查。 平均价格与总额相比
一段时间内贸易。 这是按平均价格计算的。
a 股票是贸易点。 西非经货联经常被用作一个企业。
旨在尽可能被动的投资者的贸易基准
执行。 有了这一指标,你将能够利用万国宫: 目前日。 目前周。 目前 Month。 目前配额。 目前年。 或: 前一日。 前一星期。 曾任Month。 曾任。 曾任一年。
FREE

Dark Absolute Trend is an Indicator for intraday trading. This Indicator is based on Trend Following strategy but use also candlestick patterns and Volatility. We can enter in good price with this Indicator, in order to follow the main trend on the current instrument. It is advised to use low spread ECN brokers. This Indicator does Not repaint and N ot lag . Recommended timeframes are M5, M15 and H1. Recommended working pairs: All. I nstallation and Update Guide - Troubleshooting guide
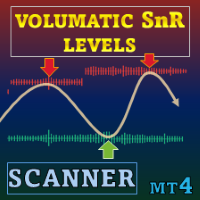
特别优惠 : ALL TOOLS ,仅 $35 一个! 新工具 将以 $30 在 第一周 或 前 3 笔购买 销售! Trading Tools Channel on MQL5 : 加入我的 MQL5 频道获取最新动态 Volumatic Support/Resistance Levels Scanner 是一款支撑/阻力指标,为价格结构加入成交量背景。通过显示交易活动在近期转折点附近的聚集情况,它帮助用户了解买入或卖出兴趣最活跃的位置。 查看 MT5 版本: Volumatic Support Resistance Levels MT5 Scanner 查看更多产品: All P roducts 1 · 概览 该指标从最近的高点和低点绘制价格区间,并为每个区间叠加成交量直方图。直方图厚度会随当前市场活动而扩展或收缩,使用户能够衡量市场对特定价格水平的关注度。 2 · 关键概念 价格区间 — 在最近价格转折点绘制的水平带。 成交量直方图 — 根据区间附近成交量百分位变化宽度的填充带。 高成交量标记 — 当区间成交量超过用户设定阈值时出现的圆圈。 Bars

"Wouldn't we all love to reliably know when a stock is starting to trend, and when it is in flat territory? An indicator that would somehow tell you to ignore the head fakes and shakeouts, and focus only on the move that counts?" The Choppiness Index is a non-directional indicator designed to determine if the market is choppy (trading sideways) or not choppy (trading within a trend in either direction). It is an oscillating indicator between -50 (very trendy) and +50 (very choppy). There are man

*This is tradingview indicator converted to mql4*
The Chandelier Exit Indicator is a popular technical analysis tool developed by Chuck LeBeau. It is designed to help traders identify potential exit points for their trades based on market volatility and the concept of trailing stops. The Chandelier Exit Indicator consists of three main components: Average True Range (ATR): The indicator utilizes the Average True Range, which measures market volatility. The ATR calculates the average range betwe
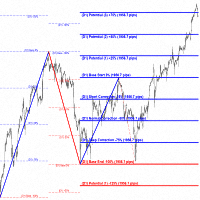
"Impulses and Corrections 4" is created to help traders navigate the market situation. The indicator shows multi-time frame upward and downward "Impulses" of price movements. These impulses are the basis for determining the "Base" , which is composed of zones of "Corrections" of price movements, as well as "Potential" zones for possible scenarios of price movement.
Up and down impulses are determined based on a modified formula of Bill Williams' "Fractals" indicator. The last impulse is always
The Ichimoku indicator is an entire system by itself with an amazing win rate many traders feel that the chart looks like a mess when we add the indicator to the chart this is because there are too many elements present in the indicator we have a solution for that now "TT Ichimoku on off button indicator" ABOUT THIS INDICATOR This is an Ichimoku indicator that has the toggle feature separately for every element ie. Kumo cloud button, kijun button, etc... you can also hide/show the indicator

ADR 反轉指標一目了然地顯示當前價格相對於其正常平均每日範圍的交易位置。當價格超過您選擇的平均範圍和高於它的水平時,您將通過彈出窗口、電子郵件或推送獲得即時警報,以便您可以快速跳入回調和反轉。該指標在圖表上在平均每日範圍極值處繪製水平線,並在這些水平之上延伸,這些水平附加了價格超過它們的數學概率。下面的更多細節...... ADR 警報儀表板補充指標並監控所有配對也可在此處獲得: https://www.mql5.com/en/market/product/62756
MT5 版本也可在此處獲得: https://www.mql5.com/en/market/product/64477/
大約 60% 的時間價格在其正常的平均每日範圍 (ADR) 內交易並推高這些水平通常是價格急劇波動的指標,通常會出現回調(獲利了結)走勢。您可以通過交易從每日範圍的頂部或底部回落到最近的支撐位或阻力位來利用這些急劇波動。
收集了超過 20 年的歷史數據,以找出主要外匯對和一系列交叉盤的價格超出特定 ADR 水平的平均百分比。該數據表明價格僅在 3% 的時間內超過其 ADR 的 200%,這
Top Bottom Tracker 是一款基于复杂算法的指标,可分析市场趋势并检测趋势的高点和低点 / MT5 版本。
价格将逐步上升,直至达到 500 美元。下一个价格 --> $99
功能特点 无重绘 新数据到来时
该指标不会改变其数值
交易货币对
所有外汇货币对
时间框架
所有时间框架
参数 ==== 指标配置 ====
配置参数 // 40(值越高,发出的信号越少但越准确)
上水平值 // 80(上水平线的值)
下水平线值 // 20(下水平线值)
指标计算条数 // 3000(您希望指标计算多少条。数值 0 将计算所有条形图的指标)
==== 警报配置 ====
弹出警报 // true (在终端上发出警报)
电子邮件报警 // true (通过电子邮件报警)
警报时间间隔 // 10 (警报时间间隔,以分钟为单位)
警告 我只在 MQL5.com 上销售我的产品。如果有人联系您向您推销我的产品,那么他们就是骗子,只想要您的钱。
此外,如果您从外部网站购买我的产品,我向您保证,这些产品都是假冒版本,与正版产品效果不同。
临界区( Critical Zones )是专为寻找更准确市场入口的手动交易者而设计的。该指标采用先进的算法,通过计算图表上最相关的支撑位和阻力位以及它们的突破和回测来检测感兴趣的区域。该指标可配置为在检测到潜在有利可图的买入/卖出机会时发送警报和通知,让交易者即使不在屏幕/ MT5 版本前 ,也能随时掌握交易机会。
功能特点
无重绘
当新数据到来时,该指标不会改变其数值。
交易货币对 所有外汇货币对 季节性 所有季节性
参数 ===== 支撑位和阻力位 配置 =====
用于计算的查看条形图 // 从当前条形图向后查看的条形图范围,用于计算支撑位和阻力位
===== 条件 =====
突破 // 打开或关闭突破检测
回测 // 启用或禁用回测检测
===== 支撑位和阻力位样式 =====
绘制类型 // 设置支撑线和阻力线的线型
支撑线颜色 // 设置支撑位的颜色
阻力位颜色 // 为阻力位定义颜色
===== 警报 =====
弹出式警报 // MT4 终端警报
推送通知警报 // 警报发送到手机
电子邮件警报 // 向电子邮件发
FREE

支撑和阻力水平查找器:
支撑和阻力水平查找器是一种先进的工具,旨在增强交易中的技术分析。具有动态支撑和阻力水平,它随着图表上新的关键点的出现实时调整,提供动态和响应式分析。其独特的多时间框架功能允许用户在任何所选时间框架上显示来自不同时间框架的支撑和阻力水平,提供细致的透视,例如在五分钟图上显示每日水平。它采用智能算法,其中包含历史数据集,使其与其他S&R指标区分开来,确保综合分析。在检测水平时,该工具采用多参数计算,有助于提高准确性。用户可以单独自定义支撑和阻力水平的颜色,创建个性化的视觉体验。该工具还包括警报功能,可在价格接近关键水平时通知交易者,增强及时决策。具有方便的功能,如隐藏和显示按钮,以及用于快速切换水平可见性的热键,支撑和阻力水平查找器为寻求在其技术分析中精确性和灵活性的交易者提供了多功能且用户友好的解决方案。
特点:
- 动态支撑和阻力水平:随着图表上新的重要关键点的出现进行调整。 - 多时间框架支撑和阻力水平:能够在任何其他时间框架上显示任何时间框架的水平。例如,在M5上显示每日水平。 - 使用智能算法,其中包括历史数据,与其他S&R指标不同。 - 在检测水
FREE

Currency Strength Meter is the easiest way to identify strong and weak currencies. This indicator shows the relative strength of 8 major currencies + Gold: AUD, CAD, CHF, EUR, GBP, JPY, NZD, USD, XAU. Gold symbol can be changed to other symbols like XAG, XAU etc.
By default the strength value is normalised to the range from 0 to 100 for RSI algorithm: The value above 60 means strong currency; The value below 40 means weak currency;
This indicator needs the data of all 28 major currency pairs a

The price is indicated only for the first 30 copies ( only 2 copies left ). The next price will be increased to $150 . The final price will be $250. Sniper Delta Imbalance is a professional tool for deep delta analysis — the difference between buyer and seller volumes. It takes volume analysis to the next level, allowing traders to see in real time who controls the price — buyers or sellers

Gold Venamax - 這是最好的股票技術指標。 此指標演算法分析資產的價格變動並反映波動性和潛在的進入區域。
指標特點:
這是一個帶有 Magic 和兩個趨勢箭頭塊的超級指標,可實現舒適且有利可圖的交易。 圖表上顯示用於切換方塊的紅色按鈕。 Magic 在指標設定中進行設置,以便您可以將指標安裝在顯示不同區塊的兩個圖表上。 Gold Venamax 可以放置在具有不同箭頭緩衝區(GV 和 SD)的兩個圖表上。 為此,您需要在設定中選擇不同的 Magic,例如,一個具有 Magic = 999,另一個具有 Magic = 666。接下來,您可以使用圖表上的紅色按鈕選擇箭頭緩衝區。 指標設定中的每個箭頭緩衝區(GV и SD)都有一個單獨的箭頭過濾器,以實現舒適且有利可圖的交易(UseFiltrGV = true; 和 UseFiltrSD = true;)。 進入的最佳訊號 = 遵循兩個緩衝區的訊號箭頭(GV 和 SD)+ 所有三個 MA 線(紅色或藍色)的方向 + TMA 通道邊界(下或上) 。 TMA 通道邊界(下限或上限)也可用於鎖定利潤和/或以較短的停損位進行逆

Adaptive Volatility Range [AVR] is a powerful tool for identifying key trend reversal points. AVR accurately reflects the Average True Range (ATR) of volatility, taking into account the Volume-Weighted Average Price (VWAP). The indicator adapts to any market volatility by calculating the average volatility over a specific period, ensuring a stable rate of profitable trades. You receive not just an indicator but a professional automated trading system , AVR-EA . Advantages: Automated Trading Sys

“ Dynamic Scalper System ”指标专为在趋势波内进行剥头皮交易而设计。
已在主要货币对和黄金上进行测试,并可与其他交易工具兼容。
提供顺势短线建仓信号,并提供额外的价格变动支持。
指标原理:
大箭头决定趋势方向。
在趋势波内,我们采用一种生成小箭头形式的剥头皮交易信号的算法。
红色箭头代表看涨方向,蓝色箭头代表看跌方向。
敏感的价格变动线会沿着趋势方向绘制,并与小箭头信号协同作用。
信号运作方式如下:当线在适当时刻出现时,将形成入场信号;在出现线时,持仓;线完成后,平仓。
建议的操作时间范围为M1 - H4。
箭头在当前K线上方形成,如果下一根K线已开仓,则不会重新绘制上一根K线上方的箭头。
输入参数
Trend Wave Period - 趋势方向(大箭头)的周期,改变趋势波的时间间隔。值 1 表示趋势方向的最长持续时间,参数值越大,持续时间越短。
Scalper Arrows Period - 信号箭头(小箭头)的计算周期,改变入场信号的生成频率。值 3 表示最频繁的生成频率,参数值越大,箭头频率越低,准确度越高。
这些参数可以根据不同的时间范

主要用途:"Pin Bars"旨在自动检测金融市场图表上的pin bars。 针杆是具有特征主体和长尾的蜡烛,可以发出趋势反转或修正的信号。
它是如何工作的:指标分析图表上的每个蜡烛,确定蜡烛的身体,尾巴和鼻子的大小。 当检测到与预定义参数相对应的引脚柱时,指示器会根据引脚柱的方向(看涨或看跌)在图表上用向上或向下箭头标记它。
参数: TailToBodyRatio-定义尾部长度和针杆主体尺寸之间的最小比率。 NoseToTailRatio-设置"鼻子"和销杆尾部之间的最大允许比率。 ArrowSize-定义标记的pin条与图表上指向它的箭头之间的距离。 应用:"Pin Bars"指标可用于识别潜在的趋势反转点,并产生进入市场或平仓的信号。 当正确使用并与其他技术指标和分析方法相结合时,该指标能够改善交易结果。 其他产品 : https://www.mql5.com/ru/users/yura1994ru/seller#products 重要事项: 该指标不是一个现成的交易系统,应该与其他分析工具结合使用。 建议在真实账户上使用指标之前,先在历史数据上测试和优化指标的参数。
FREE

一款可以直观识别波段趋势的顶底指标,手工交易最佳选择,不重绘不漂移。 如何免费获得此指标: 了解更多信息 每间隔三天涨价$20元,涨价过程: 79--> 99 --> 119...... 涨到目标价 $ 1000为止。 适应任何新手和量化交易的朋友,可以把信号写入到EA中自由发挥,数组3和数组4,例:3>4为变绿,3<4为变红,如有不懂的请联系我。 参数简介: KQuantity
显示历史K线的数量
InpPeriod_3
指标获取范围参数
Popupalarm
弹窗报警开关
Mailalarm
邮件报警开关
AlarmTimeinterval
每报警一次的间隔时间
Upperhorizontalline
上方水平线参数
Lowerhorizontalline
下方水平线参数
===================分析方法:===================== buy: 指标绿柱在下方水平线下,由红柱变成绿柱确定做buy。 sell:指标红柱在上方水平线上,由绿柱变成红柱确定做sell。

停止猜测,开始用统计优势交易 股票指数的交易方式与外汇不同。它们有固定的交易时段,隔夜会出现跳空,并遵循可预测的统计模式。这个指标为您提供所需的概率数据,让您能够自信地交易DAX、标普500和道琼斯等指数。 与众不同之处 大多数指标向您展示已经发生的事情。而这个指标向您展示接下来可能发生什么。每个交易日,指标都会根据100天的历史数据分析您当前的设置。它会找到具有相似跳空、相似开盘位置的日子,并准确计算价格到达关键水平的频率。不再猜测跳空是否会回补,或者昨天的高点是否会被测试。您将获得基于真实数据的精确百分比。 完整手册及所有参数说明请访问: https://www.mql5.com/en/blogs/post/766370 帮助您找到优质设置的策略指南: https://www.mql5.com/en/blogs/post/766371 搭配风险回报计算 + 快速交易管理按钮EA,轻松进行股指日内交易 - https://www.mql5.com/en/market/product/78020 MT5 Version: https://www.mql5.com/en/market/
Mars 14 is a Break indicator is a powerful indicator of Pattern trade for any par and any timeframe. It doesn't requires any additional indicators for the trading setup.The indicator gives clear signals about opening and closing trades.This Indicator is a unique, high quality and affordable trading tool. Can be used in combination with other indicators Perfect For New Traders And Expert Traders Low risk entries. Never repaints signal. Never backpaints signal. Never recalculates signal. For M
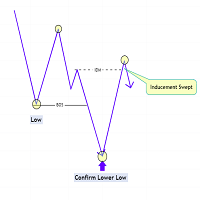
The Market Structure with Inducements & Sweeps indicator is a unique take on Smart Money Concepts related market structure labels that aims to give traders a more precise interpretation considering various factors.
Compared to traditional market structure scripts that include Change of Character (CHoCH) & Break of Structures (BOS) -- this script also includes the detection of Inducements (IDM) & Sweeps which are major components of determining other structures labeled on the chart.
SMC & pri
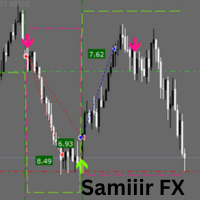
Samiiir FX:您的终极 MT4 精准盈利交易伴侣 使用 Samiiir FX 这款高级 MT4 指标提升您的交易水平。该指标旨在为外汇、商品和指数提供清晰、可操作的买入和卖出信号。Samiiir FX 专为追求精准和可靠性的交易者而打造,结合了先进的市场分析、直观的可视化效果和强大的风险管理工具。无论您是寻求快速盈利的剥头皮交易者、追求稳定性的日内交易者,还是着眼于更大波动的波段交易者,Samiiir FX 都是您交易工具箱的完美补充。 Samiiir FX 不仅仅是一个指标,它是一个完整的交易解决方案,让您能够自信且有条不紊地进行交易。其独特之处在于: 清晰且可操作的信号: 通过直接在图表上绘制的绿色向上箭头(买入信号)和粉色向下箭头(卖出信号),立即发现高概率的交易设置。 内置风险管理: 自动显示止盈 (TP) 和止损 (SL) 水平作为虚线,帮助您轻松管理风险并最大化回报。 高度可定制: 通过可调节的信号灵敏度、风险回报率和止损水平设置,根据您独特的交易风格定制指标。 适用于多种市场: 专为在多种工具上运行而设计,包括 XAU/USD、EUR/USD 和

Multi Anchor VWAP Pro MT4 – Pure Anchored VWAP | Adaptive σ-Bands | Smart Alerts Precision VWAP anchoring, purpose-built for MetaTrader 4. One-click anchors, dynamic σ-bands or %-bands and instant multi-channel alerts—ideal for scalpers, intraday and swing traders who need institutional-grade fair-value mapping. Public channel: CLICK HERE
Full User Guide – Need MT5? Click here WHY PROFESSIONAL TRADERS CHOOSE MULTI ANCHOR VWAP PRO VWAP is the institutional benchmark for fair value. This MT4

The Fair Value Gap (FVG) is a price range where one side of the market liquidity is offered, typically confirmed by a liquidity void on the lower time frame charts in the same price range. Price can "gap" to create a literal vacuum in trading, resulting in an actual price gap. Fair Value Gaps are most commonly used by price action traders to identify inefficiencies or imbalances in the market, indicating that buying and selling are not equal. If you're following the ICT Trading Strategy or Smart
FREE
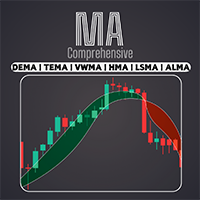
使用我们的专业综合移动平均线指标,获取各种移动平均线,包括 EMA、SMA、WMA 等。使用移动平均线的完美组合定制您的技术分析,以适应您独特的交易风格 / MT5 版本
功能特点 可激活两个具有不同设置的 MA。 可自定义图表设置。 可根据移动平均线交叉或价格与移动平均线交叉的情况改变蜡烛图的颜色。 在 MAs 交叉或价格与 MAs 交叉时发送警报。
移动平均线的类型 SMA --------------------> (Simple) EMA --------------------> (Exponential) SMMA [RMA] ----------> (Smoothed) WMA -------------------> (Linear Weighted) DEMA ------------------> (Double EMA) TEMA ------------------> (Triple EMA) VWMA -----------------> (Volume Weighted) HMA --------------
FREE

Apollo Secret Trend 是一个专业的趋势指标,可用于查找任何货币对和时间范围内的趋势。该指标可以轻松成为您的主要交易指标,无论您喜欢交易什么货币对或时间框架,您都可以使用它来检测市场趋势。通过在指标中使用特殊参数,您可以使信号适应您的个人交易风格。 该指标提供所有类型的警报,包括推送通知。指示器的信号不要重绘!在提供的屏幕截图中,您可以看到 Apollo Secret Trend 指标与超买/超卖振荡器指标相结合,我将完全免费为您提供。该交易系统可用于日间交易、剥头皮和长期交易。 购买后请联系我免费获得第二个超买超卖震荡指标!我还将为您提供有关如何使用该系统的说明。我还将与您分享丰厚的奖金! 祝您交易愉快,盈利!感谢您的关注!

黃金目標是最好的趨勢指標。 此指標獨特的演算法分析資產價格的變動,同時考慮技術和數學分析因素,確定最有利可圖的入場點,以箭頭和價格水平(買入入場/賣出入場)的形式發出信號打開訂單。 該指標也立即顯示止損價格水準和獲利的五個價格水準。
注意: 此指示器非常易於使用。 一鍵將指標安裝在圖表上,並根據其訊號和價格水平進行交易。在圖表上,無論指標安裝在哪個時間範圍內,趨勢狀態都會從四個時間框架(M30 H1 H4 D1)顯示。
此指標的優點:
1. 指示器產生的訊號精度高。 2. 指示燈訊號不重繪。 當價格穿過每條線時,它會發出聲音通知(警報和訊息)。 3.您可以在任何經紀商的MetaTrader 4交易平台上進行交易。 4. 您可以交易任何資產(貨幣、金屬、加密貨幣、股票、指數等)。 5.您可以在任何時間範圍進行交易(M15-M30剝頭皮和日內交易/H1中期交易/H4-D1長期交易)。 6. 可以在指標設定中變更各個參數(顏色、大小等),以便每個交易者可以輕鬆自訂指標。 7. 此指標可作為獨立的交易系統。 8. 圖表也顯示計時器,直到目前時間範圍的蠟燭/柱關閉。
注意:入場的準確
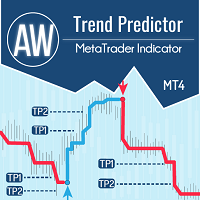
一个系统中趋势和故障水平的组合。先进的指标算法过滤市场噪音,确定趋势、进入点以及可能的退出水平。指标信号记录在统计模块中,您可以选择最合适的工具,显示信号历史的有效性。该指标计算获利和止损标记。 手册和说明 -> 这里 / MT5 版本 -> 这里 如何使用指标进行交易: 使用趋势预测器进行交易只需三个简单的步骤: 第 1 步 - 开仓 收到买入信号,成功率超过 70% 第 2 步 - 确定止损 通过相反的信号选择中继线 第 3 步 - 定义止盈策略 策略一:达到 TP1 时平仓 策略 2:达到 TP1 时平仓 50%,达到 TP2 时平仓剩余 50% 策略三:在趋势反转时平仓 好处: 从不重绘结果,信号严格位于蜡烛收盘时 它可以在顾问中使用 获利和止损标记 对交易策略或独立策略的重要补充 市场噪音过滤算法 适用于任何工具 统计模块: 为了更好地选择配对,请使用内置的统计计算。 计算交易 - 给出统计数据的信号总数 成功评级 - 达到 TP1 的信号百分比,或反转那些正获利的信号时的百分比 TakeProfit1 Hit - 达到 TP1 的信号百分比 TakeProfit2

Gold Buster M1 System - 是 XAUUSD 货币对 M1 图表的专业交易系统。但是,尽管该系统最初是专门为交易黄金而开发的,但该系统也可以与其他一些货币对一起使用。购买后,我会给你一个除了XAUUSD之外,可以和系统一起使用的交易对列表,这将扩大你使用这个系统的可能性 系统中的所有指标都不会重复! 该系统是一组三个指标。它是一个趋势指标、箭头指标和成交量指标,直观地显示了市场的强弱。 购买后,您可以立即下载趋势指标。我将免费为您提供剩余的两个指标,因为它们是整个系统的一部分。我还将为您提供一个模板,您可以使用该模板在图表上加载指标。此外,我将教你如何使用我的系统进行交易并分享我的建议。还有丰厚的红利等着你! 购买后请务必立即写信给我!

"The trend is your friend" is one of the best known sayings in investing, because capturing large trendy price movements can be extremely profitable. However, trading with the trend is often easier said than done, because many indicators are based on price reversals not trends. These aren't very effective at identifying trendy periods, or predicting whether trends will continue. We developed the Trendiness Index to help address this problem by indicating the strength and direction of price trend
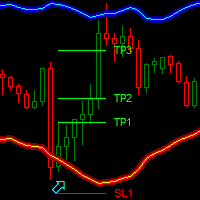
Dark Bands is an Indicator for intraday trading. This Indicator is based on Counter Trend strategy but use also Volatility. We can enter in good price with this Indicator, in order to follow the inversions on the current instrument.
Key benefits
Easily visible take profit/stop loss lines Reliable bands lines with futuristic colors, and Intuitive directional arrows Useful statistics , which indicate the win rate of the signals Plus Package available, leave a feedback to receive
FREE

The Area of Interest (AOI) Indicator is a powerful tool designed to help traders identify key market zones where price reactions are highly probable. This indicator specifically highlights two critical zones: Seller AOI (Area of Interest) : This zone represents areas where sellers are likely to enter the market, often acting as resistance. When the price approaches or touches this zone, it signals that a potential sell-off could occur. Buyer A OI (Area of Interest) : The BOI zone identifies re
FREE

Keltner Channel Indicator Keltner Channel is an oscillator like Bollinger Bands.
Keltner Channel is a very good tool to time entries for your strategy.
Keltner Channel displays a channel where price is supposed to stay unless we are in overbought or oversold situations.
Various strategies use Keltner Channel indicator successfully to spot overbought / oversold situations and look for reversals.
Keltner Channel indicator uses ATR to determine overbought and oversold situations. Inputs of the indi
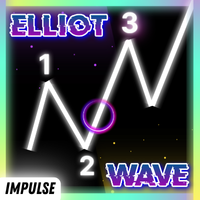
Huge 70% Halloween Sale for 24 hours only!
Manual guide: Click here This indicator is unstoppable when combined with our other indicator called Katana . After purchase, send us a message and you could get it for FREE as a BONUS! The Elliot Wave Impulse is a pattern identified in the Elliott Wave Theory, a form of technical analysis used to analyze financial market cycles. The Impulse Wave is considered the strongest and most powerful part of the Elliott Wave cycle, as it represents t

黃金、石油、貨幣、加密貨幣的進入和退出交易訊號 - 全部在 MT4 中,無需重新繪製並帶有趨勢預測。即使是初學者也可以輕鬆地在任何時間範圍內進行交易。靈活且準確的自動調諧訊號演算法,可以在螢幕上看到、用英語聽到、在智慧型手機上接收。
此指標有一個用於培訓使用者的提示系統。將滑鼠指標懸停在任何物件上,您就會看到。無需下載使用手冊,而是下載免費的演示版本,並在停止測試後研究圖表上的詳細資訊。
此指標的優點和作用:
- 貨幣活動及其隨機指標的掃描儀,它會自動將螢幕切換到出現新訊號的圖表。點擊掃描器可以輕鬆建立必要的圖表。在這種情況下,1 個圖表上配置的「COLOR_SCHEME」範本將自動複製到具有指標和設定的新圖表中。在每個圖表上,建立後,您可以變更設定和時間範圍。
- 現在可用的手數及其以美元為單位的大小是在每分鐘柱的開始時計算的。
- 利潤(+ 佣金 + 隔夜利息)= 此圖表上所有未平倉訂單的總和,以每個價格變動計算。
- 如果發生意外或當您斷開交易時,建議「獲利」。此指標給出有效關閉交易的訊號,而不是在伺服器上設定通常的「止盈」和「停損」。
- 在伺服器上觸發「獲利」
这是一个简单的VWAP,但我们加入了通知功能,当价格触及或穿过VWAP线时进行通知。 这是MetaTrader 4(MT4)的传统VWAP指标。 默认参数与常规VWAP相同,但您可以修改VWAP的计算,最好的是: 当价格触及或穿越VWAP时,您将通过警报、手机通知、电子邮件或声音事件得知。 MetaTrader 4的锚定VWAP指标 。 参数: VWAP周期 VWAP在一定时间范围内进行计算。传统的VWAP每天开始一次新的分析,但在这个指标中,除了有这个选项作为默认设置外,您还可以选择要用于计算VWAP的所需周期。这意味着,即使在M1的时间框架上进行操作,也可以查看H1的VWAP计算,每次在H1时间框架上的新条形图后更新。该计算的重新启动取决于您选择的时间周期。 然而,目前无需担心,因为默认参数已根据传统VWAP进行设置。只需下载此VWAP指标并将其添加到您的MetaTrader 5(MT5)图表中。 价格类型 VWAP的默认计算使用收盘价格(Close),这对应于简单VWAP的传统方法。然而,您可以选择不同类型的价格来进行VWAP的计算。可选的类型包括: Close Open Hig
FREE

免费但先进产品概述 Turbo Trend 是一个强大的指标,旨在帮助交易者识别和跟随市场趋势。它结合了高级移动平均线和成交量分析,以提供明确的趋势方向信号。Turbo Trend 通过将市场状况分类为三种不同的状态: 上升趋势 、 下降趋势 和 中性趋势,简化了决策过程,使用易于区分的彩色线条和蜡烛高亮显示。 加入 Koala Trading Solution 频道 在mql5社区,获取有关所有Koala产品的最新新闻,加入链接如下: https://www.mql5.com/en/channels/koalatradingsolution 访问其他不错的免费工具:FVG 指标: https://www.mql5.com/en/market/product/108907 基于 Turbo Trend 的EA 现在已在市场上提供 在此访问 Turbo Trend Bot: https://www.mql5.com/en/market/product/127401 关键功能 趋势分类 :该指标使用复杂的算法来分析多个移动平均线和成交量,以提供明确的趋势洞察。 视觉信号 :趋势方向
FREE
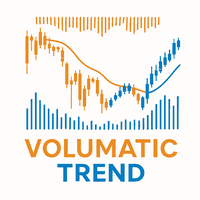
Volumatic Trend is a powerful, trend-following indicator that merges directional analysis with real-time volume behavior. By combining adaptive trend logic and volume overlays, it gives traders a detailed snapshot of market conviction and potential turning points. From instant trend shift detection to volume-weighted candle visuals, this tool brings deeper context to price movement. MT5 Version - https://www.mql5.com/en/market/product/136211/ Join To Learn Market Depth - https://www.mql5.com/
FREE

Forex Breath System 它是一个基于趋势的交易系统,可用于任何市场。您可以将此系统用于货币、金属、商品、指数、加密货币甚至股票。它也可以在任何时间范围内使用。该系统是通用的。它显示趋势并提供趋势箭头信号。当信号出现在趋势方向时,该指标还可以为您提供特殊类型的警报,从而使趋势交易成为一项简单的任务。 该指标非常易于使用,因为它根本不需要处理任何难以理解的设置。 您只需将其附加到图表中即可开始交易。无论您喜欢哪种交易风格,系统都会帮助您了解市场的方向以及趋势方向上可能的入场点。 该系统将对所有交易者有所帮助,无论他们的交易经验水平如何。 该指示器提供所有类型的警报,包括推送通知。 购买后请联系我以获得交易说明和丰厚奖金! 祝您交易愉快、盈利!

Apollo Trend Rider 是一款易于使用的箭头指标,提供买入和卖出信号。该指标不会重绘,因此您可以测试它,并根据您想要使用的任何交易工具和时间范围进行调整。该指标提供所有类型的警报,包括推送通知。 该指标基于多种策略的组合,包括趋势、突破和反转策略。您可以将其作为独立系统使用。但为了使交易更加便捷,我提供了一个免费的专用模板,可以帮助您查看交易工具的价格通道和趋势方向。 Apollo Trend Rider 指标适用于任何交易工具和时间框架。它适用于货币、指数、股票、加密货币等。实际上,它适用于任何交易工具。 购买后请联系我以获取我的交易提示、特殊模板文件和丰厚奖金! 祝您交易成功! 祝您外汇交易永远成功!

Smart Fibo Zones are powerful, auto-generated Fibonacci Retracements that are anchored to key market structure shifts . These zones serve as critical Supply and Demand levels, guiding you to identify potential price reactions and confirm market direction. Fibonacci calculations, widely used by professional traders, can be complex when it comes to identifying highs and lows. However, Smart Fibo Zones simplify this process by automatically highlighting order blocks and key zones, complete with St
[ MT5 Version ]
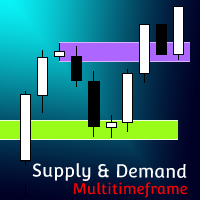
Supply and Demand Multitimeframe Supply and Demand Multitimeframe is the first indicator in the market that combines multiple aspects like trading volume, price structure and momentum to identify Supply and Demand zones for every asset. The Supply and Demand indicator analyzes simultaneously up to 4 different TFs and represents their information in the current graph. Its interactive UI highlights everytime the price enters a Supply or Demand zone even if the zones are not visibl

BEHOLD!!!
One of the best Breakout Indicator of all time is here. Multi Breakout Pattern looks at the preceding candles and timeframes to help you recognize the breakouts in real time.
The In-built function of supply and demand can help you evaluate your take profits and Stop losses
SEE THE SCREENSHOTS TO WITNESS SOME OF THE BEST BREAKOUTS
INPUTS
MaxBarsback: The max bars to look back
Slow length 1: Period lookback
Slow length 2: Period lookback
Slow length 3: Period lookback
Slow

介绍 F-16 飞机指标,这是一款领先的 MT4 工具,旨在革新您的交易体验。灵感来自于 F-16 战斗机无与伦比的速度和精准度,该指标结合了先进算法和尖端技术,在金融市场上提供卓越的性能。 通过 F-16 飞机指标,您将在竞争中腾飞,因为它提供实时分析并生成高度准确的交易信号。其动态功能旨在识别各种资产类别上的利润机会,让您能够自信地做出明智的决策。 配备用户友好的界面,F-16 飞机指标与热门的 MetaTrader 4 平台无缝集成,确保交易过程顺畅高效。无论您是初学者还是经验丰富的专业人士,该指标都可以轻松定制,以符合您独特的交易风格和偏好。 感受 F-16 飞机指标的威力,它以精确和敏捷的方式驾驭市场趋势。其先进的图表功能使您能够始终领先,检测关键的入场和出场点以实现最佳时机。掌控您的交易之旅,并凭借 F-16 飞机指标释放稳定盈利的潜力。 准备起飞,以这款出色的 MT4 指标将您的交易表现提升到新的高度。F-16 飞机指标是您在金融市场世界中的终极副驾驶员,让您以速度、精确度和自信取得成功。

指标在指定区域显示水平音量分布 (BOX) 和最大音量 (POC).
产品特点 。 1. 您可以使用刻度或仅使用价格。 2. 自适应网格间距 (M1-MN) 。 3. 自适应大容量(Median)搜索步骤取决于框大小。 4. 框线和按钮的自动变色龙颜色。 5. 多个框,易于创建和删除 。 6. 70% 体积区域(在设置中启用) 。 7. 触碰最大水平音量线有提示 (POC) 。 8. VWAP 。 9. 控制面板 。
使用成交量配置指标探索市场。 我是为自己做的,但现在你也可以使用它。
主要设置 。 Calc Histo Mode – 直方图计算方法 (Market Profile – 按价格计算, Tick Volume Profile – 按刻度计算) 。 Mode Step In Pips – 按点计算中线 。 Vertical Step – 直方图的垂直步长(以点为单位的线之间的距离) 。 Data Source – 自动选择报价时间范围(最多 H1 从 M1 获取报价) 。 Touch First Bar - 打开以使扩展 POC 线在第一次触摸时停止 。 Hide B

MT5 version | Owl Smart Leve Indicator | Owl Smart Levels策略 | FAQ
Fractals Indicator 是作者 Bill Williams 交易策略的要素之一。 它用於在價格圖表上搜索價格反轉點,從而搜索支撐位和阻力位。 Full Fractals Indicator 是改進的 Fractals,幾乎所有交易終端的工具包中都有。 唯一的區別是,為了構建分形,我們在主蠟燭的左側使用了 5 根蠟燭,在主蠟燭的右側使用了 2 根蠟燭(參見圖 1)。 除了基本構造之外,Full Fractals 還尋找價格已停止一段時間的水平。 Telegram 聊天: @it_trader_chat 新的 Expert Advisor Prop Master - 在您的交易终端中进行测试 https://www.mql5.com/zh/market/product/115375
Full Fractals Indicator 表示什麼。 分形在價格圖表上顯示為關鍵蠟燭上的向上和向下箭頭。 基於這些點,您可以自由地建
FREE

Gold Channel is a volatility-based indicator, developed with a specific timing algorithm for the XAUUSD pair, which consists of finding possible corrections in the market.
This indicator shows two outer lines, an inner line (retracement line) and an arrow sign, where the theory of the channel is to help identify overbought and oversold conditions in the market.
The market price will generally fall between the boundaries of the channel. If prices touch or move outside the channel it is a tradi
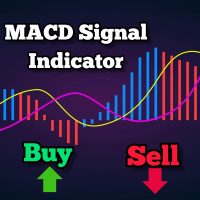
这是一种基于MACD的趋势跟踪指标,当处于200 MA之上时提供买入信号,当低于200 MA时提供卖出信号。当MACD穿过零线时,将生成信号。此指标还展示了可用作止损的支撑和阻力水平。
可调整的参数包括MA周期、MACD快速EMA、慢速EMA以及支撑-阻力间隔。它绘制在最近蜡烛的最低点和最高点。
默认设置如下: SR间隔:10, MA周期:200, 快速EMA:24, 慢速EMA:26。
调整这些值可能导致信号更频繁或更少,建议进行测试以确定最有效的配置。
推荐使用1小时或4小时的时间框架,但在任何时间框架上都可能有效。该指标适用于所有交易工具,包括外汇、股票和商品等。
欢迎进一步了解其详细应用和优势。此外,它还包含报警功能。 请查看我的其他产品: https://www.mql5.com/en/users/8587359/seller
FREE
MT5版本下载地址: https://www.mql5.com/en/market/product/50255
Telegram频道及群组: https://t.me/bluedigitsfx
VIP群组访问: 付款凭证请发送至我们的收件箱
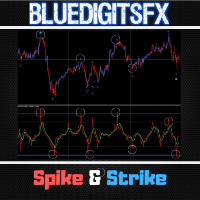
推荐经纪商: https://bit.ly/BlueDigitsFxStarTrader BlueDigitsFx Spike And Strike Reversal — 强力混合振荡器,精准识别市场反转 BlueDigitsFx Spike And Strike Reversal 是一款复合振荡器,结合多种指标信号,帮助您精准预测市场反转。 该指标集成了两个模块,其中包括基础振荡器,并通过箭头清晰标示最佳入场点。 主要功能 简单、直观且高效的反转检测 能过滤并增强您现有的交易策略 信号严格基于K线收盘触发,可靠性高 适用于所有品种和时间周期(推荐1小时及以上) 内置弹窗、邮件、推送通知及声音提醒 如何使用 BlueDigitsFx Spike And Strike Reversal 交易 买入设置: Spike and Strike 数值下

该指标可识别预测市场反转点的最常用谐波形态。这些谐波形态是外汇市场上不断重复出现的价格形态,暗示着未来可能的价格走势/ 免费 MT5 版本
此外,该指标还内置了市场进入信号以及各种止盈和止损。需要注意的是,虽然谐波形态指标本身可以提供买入/卖出信号,但建议您使用其他技术指标来确认这些信号。例如,在进行买入/卖出之前,您可以考虑使用 RSI 或 MACD 等震荡指标来确认趋势方向和动能强度。
该指标的仪表盘扫描器:( Basic Harmonic Patterns Dashboard )
包括的谐波形态 加特里 蝶形 蝙蝠型 螃蟹 鲨鱼 赛弗 ABCD
主要输入 Max allowed deviation (%): 该参数是指谐波图形形成时的允许偏差。该参数决定了谐波图样的结构可以变化多少,而指标不会将其视为有效图样。因此,如果设置的百分比越高,则模式识别的灵活性就越大,而如果设置的值越低,则限制性就越大。例如:如果设定值为 30%,那么指标将把当前价格 ±30% 范围内符合形态比例的形态视为有效形态。 Depth: 该参数决定了谐波形态的每个波浪中必须出现的最少条数,也就
FREE

Currency Strength Meter is the easiest way to identify strong and weak currencies. This indicator shows the relative strength of 8 major currencies + Gold: AUD, CAD, CHF, EUR, GBP, JPY, NZD, USD, XAU. Gold symbol can be changed to other symbols like XAG, XAU etc.
By default the strength value is normalised to the range from 0 to 100 for RSI algorithm: The value above 60 means strong currency; The value below 40 means weak currency;
This indicator needs the data of all 28 major currency pairs a
MetaTrader市场是一个简单方便的网站,在这里开发者可以出售自己的交易应用程序。
我们将帮助您发布您的产品,并向您解释如何为市场准备您的产品描述。市场上所有的应用程序都是加密保护并且只能在买家的电脑上运行。非法拷贝是不可能的。
您错过了交易机会:
- 免费交易应用程序
- 8,000+信号可供复制
- 探索金融市场的经济新闻
注册
登录