Scalping Lines System
- Indicators
- Version: 2.0
- Updated: 24 February 2026
- Activations: 10

Scalping Lines System - is a scalping trading system specifically designed for trading the Gold, XAUUSD asset on M1-H1 timeframes.
It combines indicators for trend, volatility, and overbought/oversold market analysis, gathered into a single oscillator for identifying short-term signals.
The main internal parameters for the signal lines are pre-configured.
Some parameters remain for manual adjustment: "Trend Wave Duration," which regulates the duration of a series of signals in the trend direction using the MA trend, and "Apply Smoothing to Signal Line," which adjusts signal line generation.
The indicator does not repaint when calculating the signal line at the opening price. At other prices, the signal arrow may flicker.
Signals appear after the candle closes, and several alert types are available.
Recommended timeframes for use: M1-M5-M15-M30-H1.
The indicator was originally designed for trading gold, but is also suitable for trading highly volatile assets with low spreads: BTC and cryptocurrencies, Silver, CFDs on stock indices (Nasdaq 100, etc.).
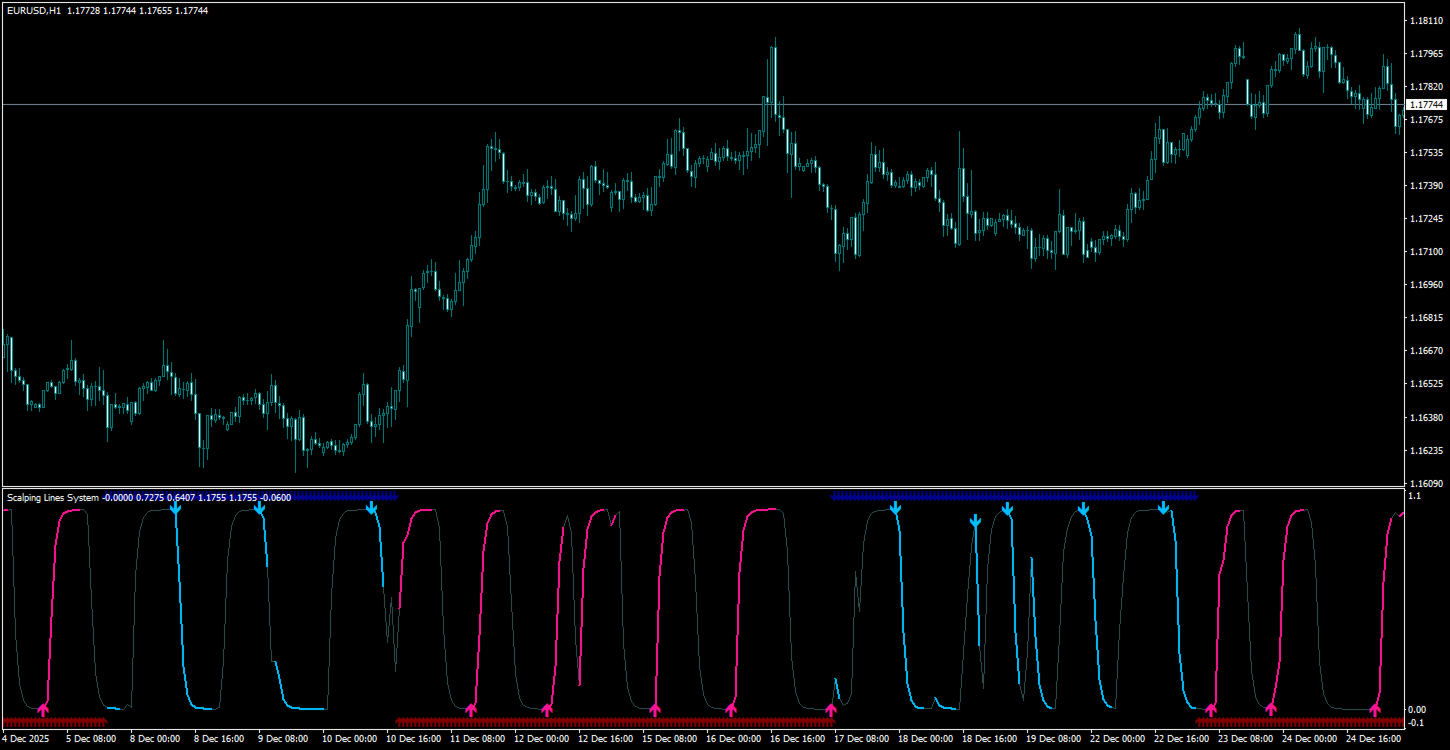
For some other trading instruments (EURUSD, GBPUSD), the indicator can be used on timeframes of M15 and higher.
How to use the indicator for trading.
For "Sell" signals:
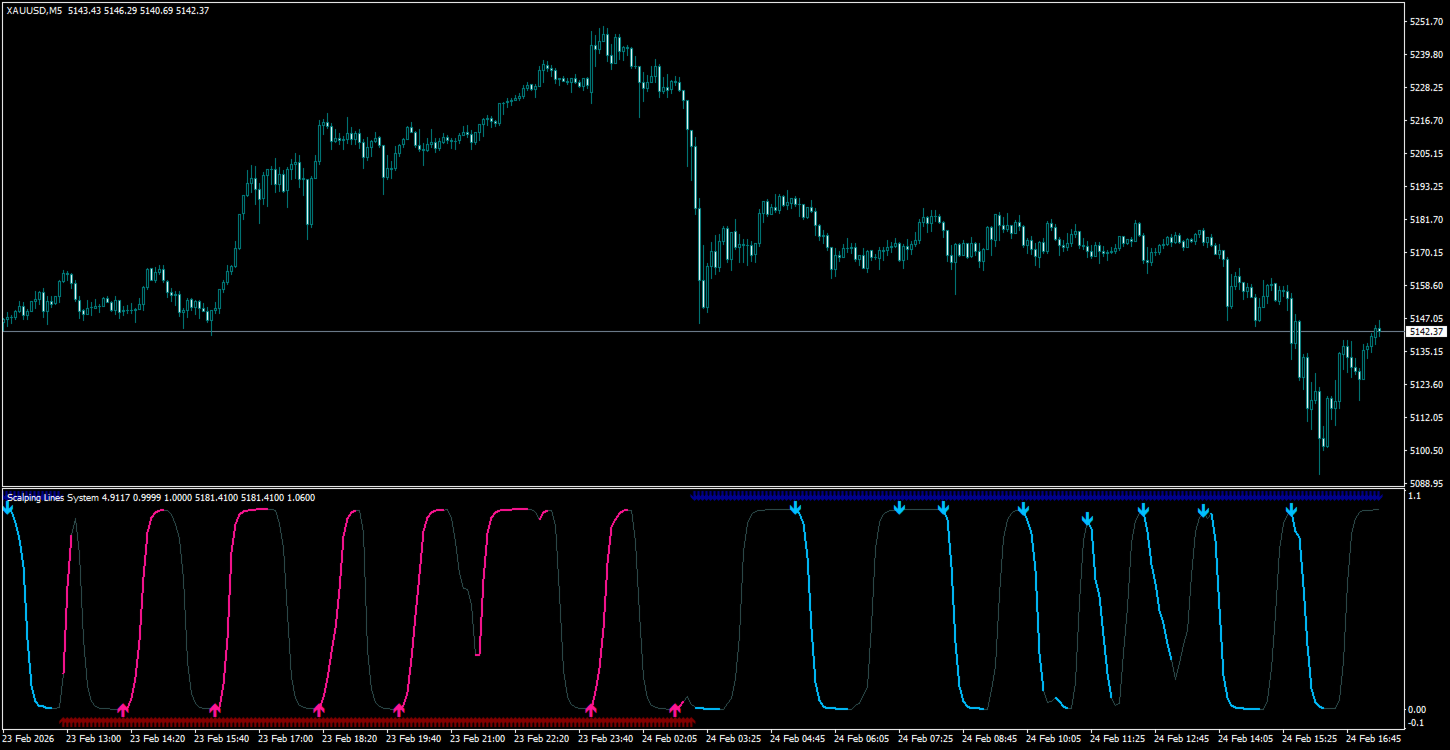
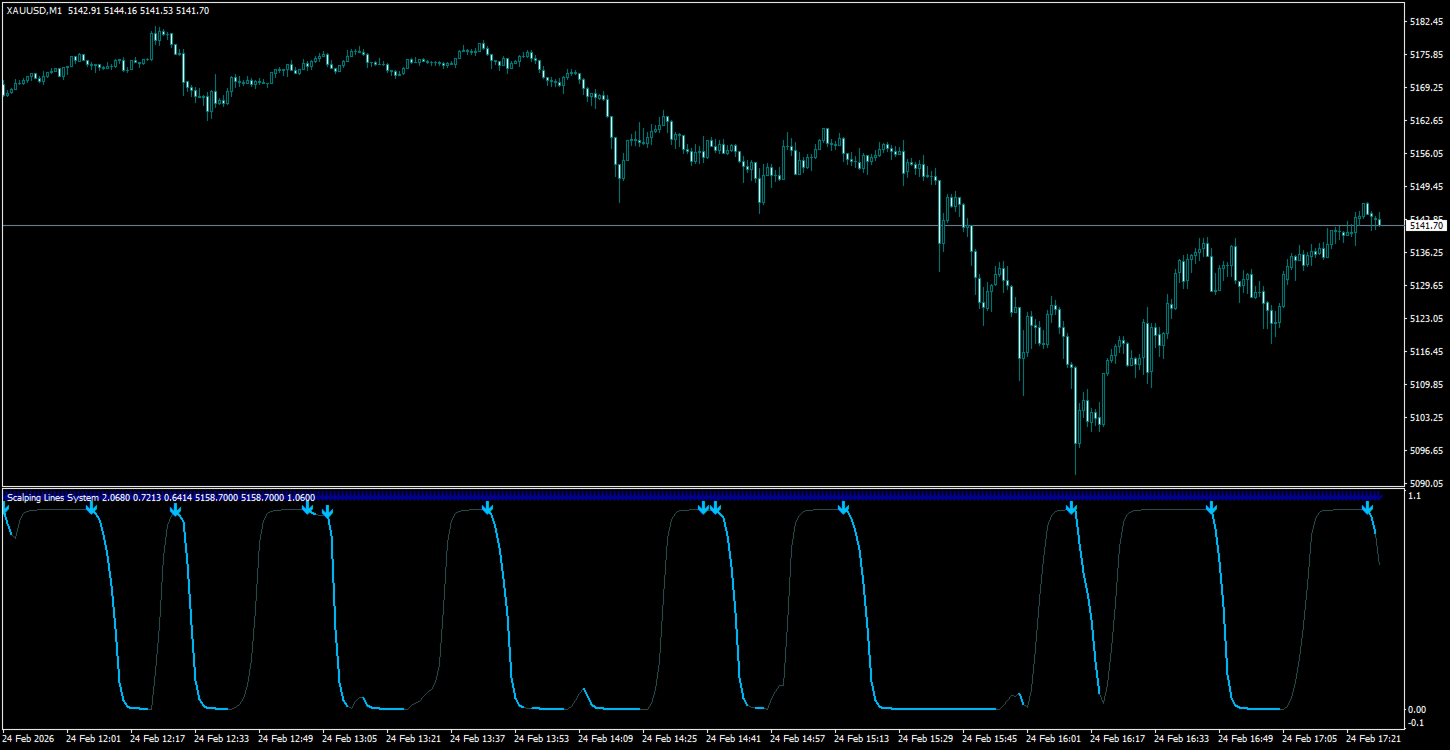
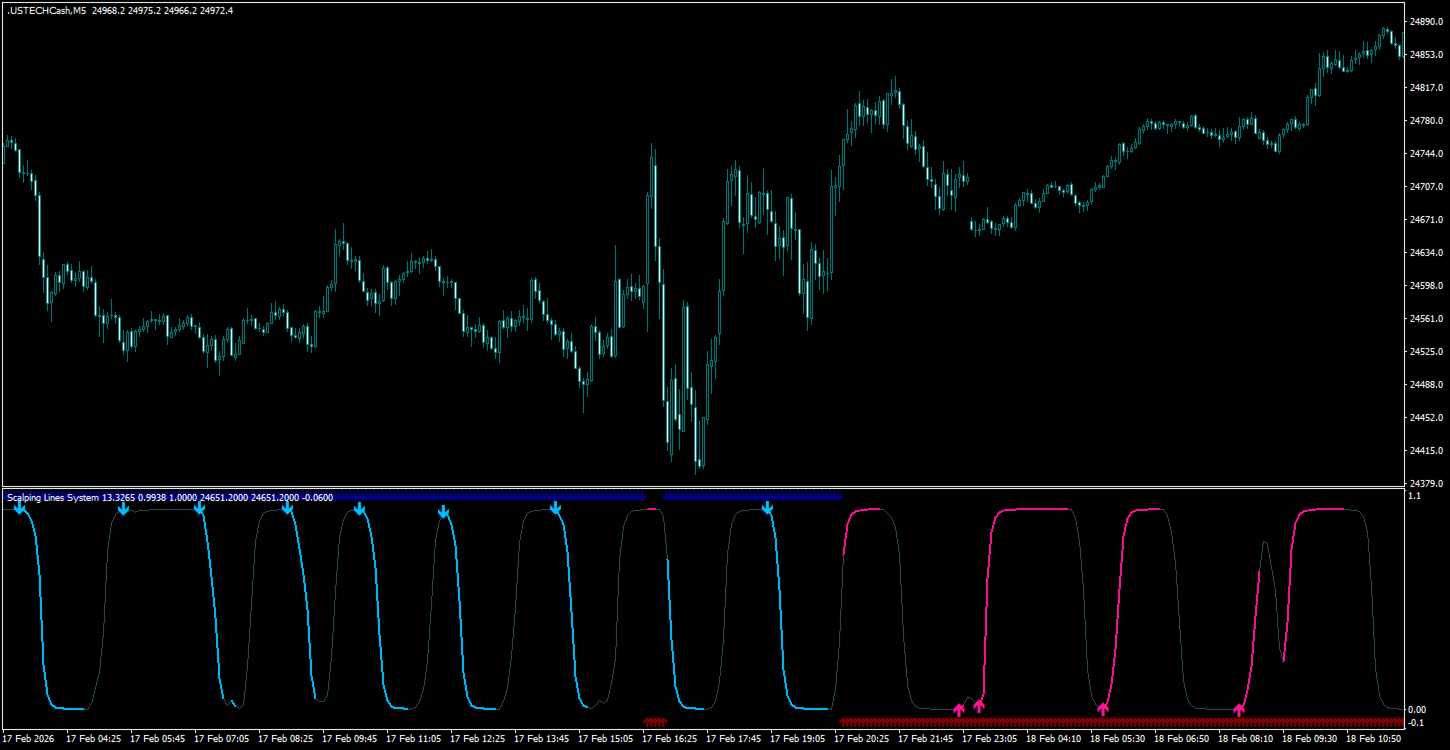
Blue downtrend arrows are at the top.
A blue arrow appears at the top of the oscillator, and the blue line after the arrow indicates the signal's support duration. Follow this line.
For "Buy" signals:
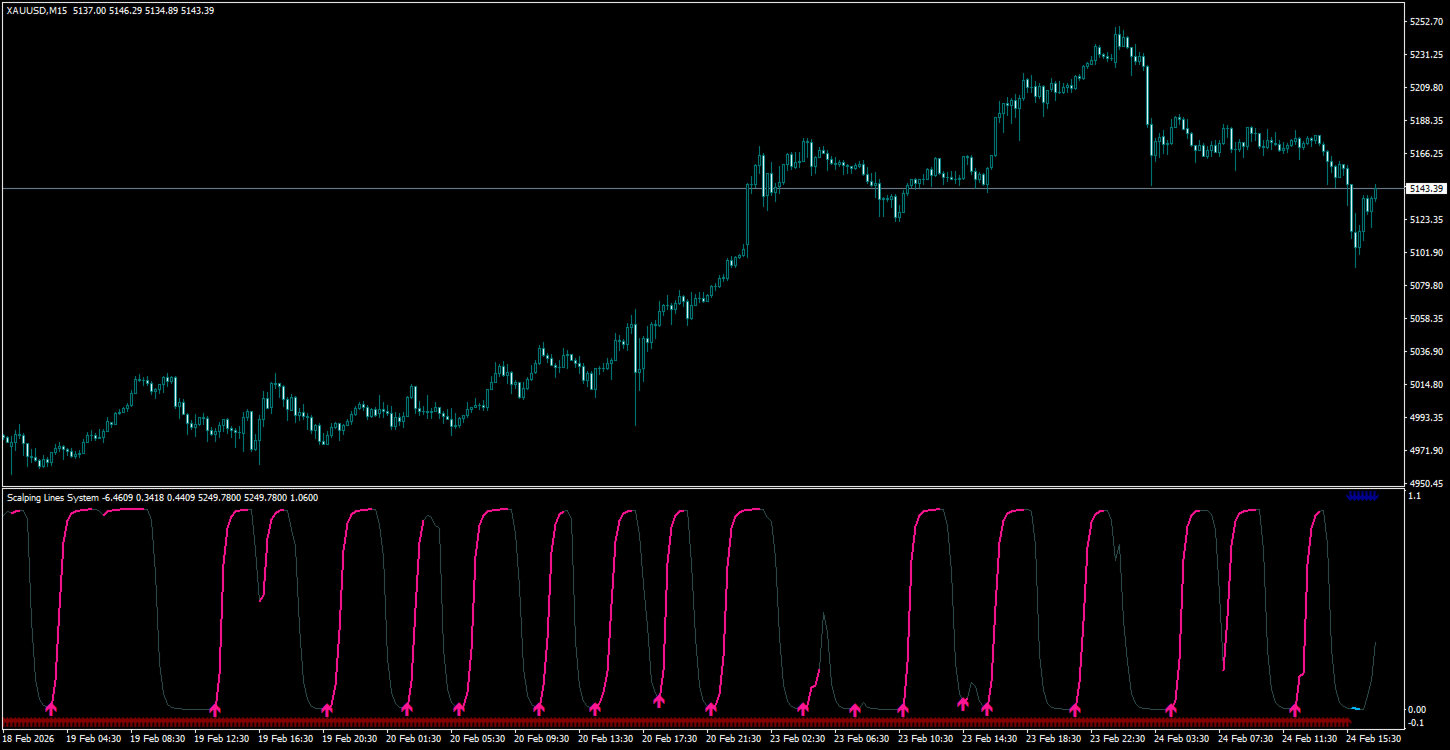
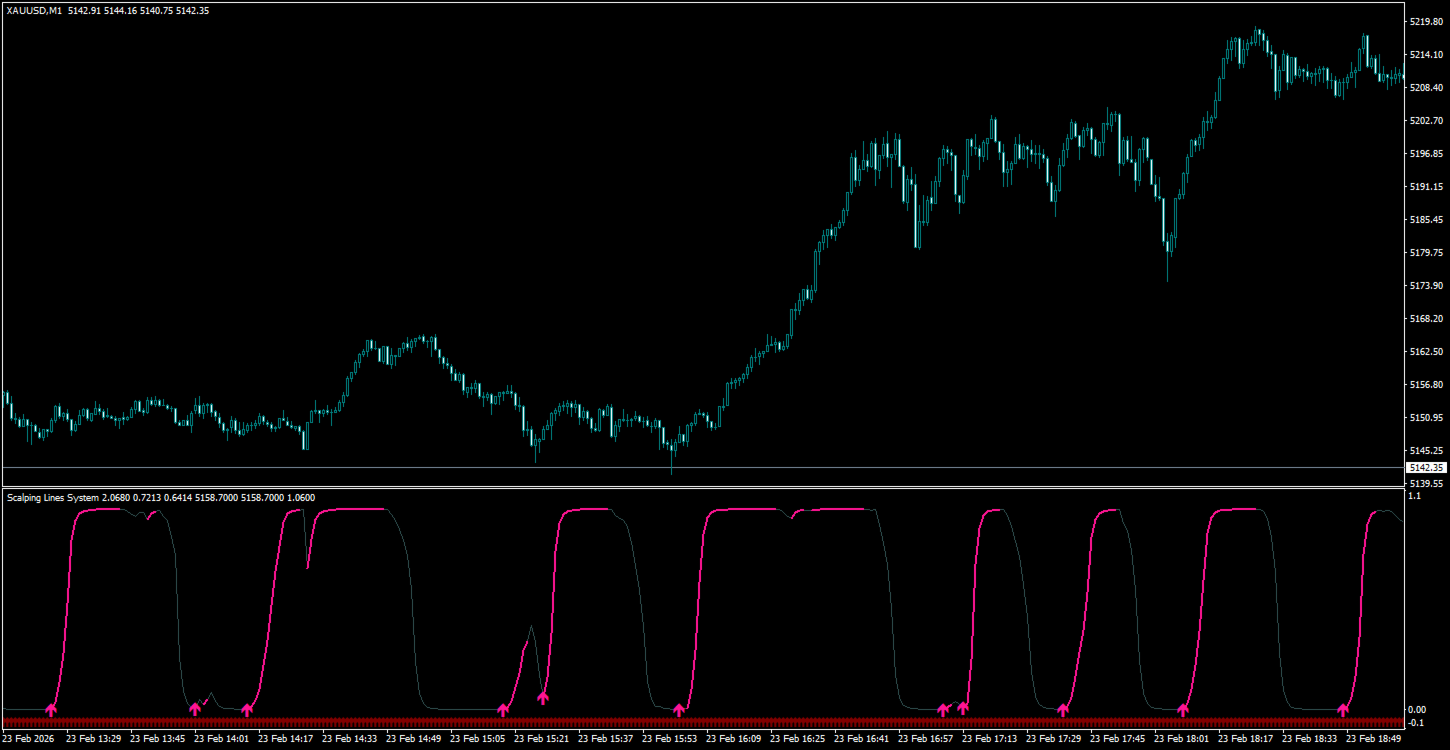
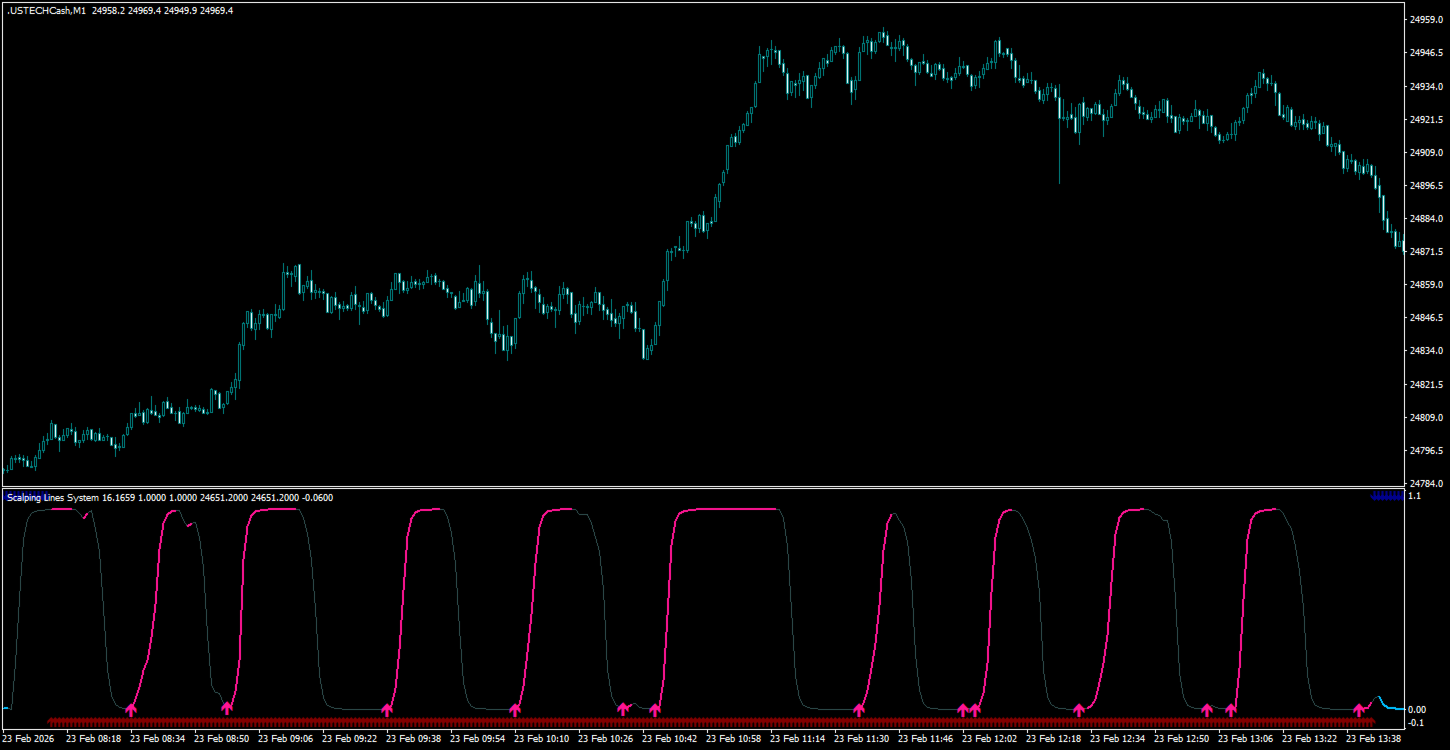
Red uptrend arrows are at the bottom.
A pink arrow appears at the bottom of the oscillator, and the pink line after the arrow indicates the signal's support duration. Follow this line.
If you disable the "Use internal MA to generate a trend" option, you can use signal lines with another trend indicator.
Hold open positions for a few candles while the price moves according to the signal.
Do not use the indicator in low-volatility conditions.
It combines indicators for trend, volatility, and overbought/oversold market analysis, gathered into a single oscillator for identifying short-term signals.
The main internal parameters for the signal lines are pre-configured.
Some parameters remain for manual adjustment: "Trend Wave Duration," which regulates the duration of a series of signals in the trend direction using the MA trend, and "Apply Smoothing to Signal Line," which adjusts signal line generation.
The indicator does not repaint when calculating the signal line at the opening price. At other prices, the signal arrow may flicker.
Signals appear after the candle closes, and several alert types are available.
Recommended timeframes for use: M1-M5-M15-M30-H1.
The indicator was originally designed for trading gold, but is also suitable for trading highly volatile assets with low spreads: BTC and cryptocurrencies, Silver, CFDs on stock indices (Nasdaq 100, etc.).
For some other trading instruments (EURUSD, GBPUSD), the indicator can be used on timeframes of M15 and higher.
How to use the indicator for trading.
For "Sell" signals:
Blue downtrend arrows are at the top.
A blue arrow appears at the top of the oscillator, and the blue line after the arrow indicates the signal's support duration. Follow this line.
For "Buy" signals:
Red uptrend arrows are at the bottom.
A pink arrow appears at the bottom of the oscillator, and the pink line after the arrow indicates the signal's support duration. Follow this line.
If you disable the "Use internal MA to generate a trend" option, you can use signal lines with another trend indicator.
Hold open positions for a few candles while the price moves according to the signal.
Do not use the indicator in low-volatility conditions.