YouTube'dan Mağaza ile ilgili eğitici videoları izleyin
Bir alım-satım robotu veya gösterge nasıl satın alınır?
Uzman Danışmanınızı
sanal sunucuda çalıştırın
sanal sunucuda çalıştırın
Satın almadan önce göstergeyi/alım-satım robotunu test edin
Mağazada kazanç sağlamak ister misiniz?
Satış için bir ürün nasıl sunulur?
MetaTrader 4 için teknik göstergeler - 3
The price is indicated only for the first 30 copies ( only 2 copies left ). The next price will be increased to $150 . The final price will be $250. Sniper Delta Imbalance is a professional tool for deep delta analysis — the difference between buyer and seller volumes. It takes volume analysis to the next level, allowing traders to see in real time who controls the price — buyers or sellers

Matrix Arrow Indicator MT4 , forex, emtialar, kripto para birimleri, endeksler, hisse senetlerigibi tüm sembollerde/araçlarda kullanılabilen %100 yeniden boyamayan çoklu zaman çerçevesi göstergesini izleyen benzersiz bir 10'u 1 arada trenddir. Matrix Arrow Indicator MT4 , mevcut eğilimi erken aşamalarında belirleyecek ve aşağıdakiler gibi 10'a kadar standart göstergeden bilgi ve veri toplayacaktır: Ortalama Yönlü Hareket Endeksi (ADX) Emtia Kanal Endeksi (CCI) Klasik Heiken Ashi mumları Hareke

Bu projeyi seviyorsanız, 5 yıldız incelemesi bırakın. Volume-weighted ortalama fiyat, toplam hacim hacmine yapılan değerin oranıdır
Belirli bir zaman ufuk üzerinde ticaret yaptı. Ortalama fiyatın bir ölçüsüdür.
Bir stoğun ticaret ufkunun üzerinde ticaret yapılır. VWAP sık sık sık kullanılır
Ticaret kriteri, mümkün olduğunca pasif olmayı amaçlayan yatırımcılar tarafından
infaz. Bu gösterge ile VWAP'ı şimdilik çizebilirsiniz: Mevcut gün. Hafta. Şimdi Ay. Şimdiki Mahallesi. Şu anki yıl. Veya: Öncek
FREE

Super Signal – Skyblade Edition
Profesyonel No-Repaint / Gecikmesiz Trend Sinyal Sistemi, Olağanüstü Kazanma Oranı ile | MT4 / MT5 için Temel Özellikler: Super Signal – Skyblade Edition, özellikle trend bazlı işlemler için geliştirilmiş akıllı bir sinyal sistemidir.
Yalnızca güçlü, yönlü ve gerçek momentum destekli piyasa hareketlerini tespit etmek amacıyla çok katmanlı bir filtreleme yapısı kullanır. Bu sistem zirve veya dip noktaları tahmin etmeye çalışmaz. Aşağıdaki üç koşul aynı anda karşıl

Auto Optimized MFI , geçmiş veriler üzerinde gerçek ticaret simülasyonları yürüterek, işlem yaptığınız piyasa ve zaman dilimine en uygun MFI alım/satım seviyelerini otomatik olarak belirleyen, kendini ayarlayan bir göstergedir. Geleneksel sabit 80/20 eşiklerine dayanan göstergelerin aksine, bu araç gerçek fiyat ve hacim davranışına göre uyum sağlar. Nasıl Çalışır Belirlediğiniz geçmiş mum aralığını tarar ve MFI sinyallerine dayalı giriş/çıkış işlemlerini simüle eder. Kazanma oranı, maksimum düşü

Ne kadar harika geriye dönük testler, canlı hesap performans kanıtları ve her yerde fantastik istatistikler sunan bir alım satım göstergesi aldınız, ancak onu kullandıktan sonra hesabınızı **patlatmakla mı sonuçlandınız?**
Bir sinyale tek başına güvenmemelisiniz, öncelikle neden ortaya çıktığını bilmeniz gerekir ve RelicusRoad Pro bunu en iyi şekilde yapar! Kullanım Kılavuzu + Stratejiler + Eğitim Videoları + VIP Erişimli Özel Grup + Mobil Sürüm Mevcut
Piyasaya Bakmanın Yeni Bir Yolu
RelicusR

Currency Strength Meter is the easiest way to identify strong and weak currencies. This indicator shows the relative strength of 8 major currencies + Gold: AUD, CAD, CHF, EUR, GBP, JPY, NZD, USD, XAU. Gold symbol can be changed to other symbols like XAG, XAU etc.
By default the strength value is normalised to the range from 0 to 100 for RSI algorithm: The value above 60 means strong currency; The value below 40 means weak currency;
This indicator needs the data of all 28 major currency pairs a

Was: $299 Now: $99 Supply Demand uses previous price action to identify potential imbalances between buyers and sellers. The key is to identify the better odds zones, not just the untouched ones. Blahtech Supply Demand indicator delivers functionality previously unavailable on any trading platform. This 4-in-1 indicator not only highlights the higher probability zones using a multi-criteria strength engine, but also combines it with multi-timeframe trend analysis, previously confirmed swings
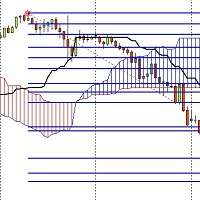
I have developed an indicator based on both the fibo musang strategy and the price breaking of the ichimoku cloud and it has amazing results
the features are:
1- Once activated it give you the trend where you are from the chart
2- After a trend change it gives you an alert on PC or notification on your phone if you are away.
3- It sends you the exact prices to take an order and 3 take profit levels and your stoploss.
4- It works on every timeframes from 1m to MN.
5- It works on pairs and C

volatility level indicator is a volatility oscillator to see trend reversal points. price trends has reverese when volatility inreased . this indicator show trend reversal points volatility. mostly same level up and down volatility is reversal points. red colour shows up points of volatilty.and probably trend will down. blue colour oscillator shows deep point of price when increased volatiliyty. on pictures horizontal lines on oscillator has drawed by hand.to see the before level and compare now

LH ve HL kesintilerini bulmak için saf fiyat eylemiyle yapılan gelişmiş hesaplama.
Piyasada size büyük bir geri dönüş noktası verecektir.LH ve HL sinyalleri trengle çıkışları için de kullanılabilir.
Koparma gerçekleştiğinde, güçlü bir geri dönüş olduğunu gösterir.Hareketli Ortalamalar için güzel bir filtre.Bunu trend göstergeleriyle kullanmanızı şiddetle tavsiye ederim.
Destek ve direnç, arz talep göstergeleri için ekstra bir onay olarak kullanılabilir.
Daha fazla ayrıntı aşağıdaki forex iş p

Currently switched to the 4 hour chart - but use other time frames for confirmation. :-) I change my main time frame based on the market movement at the time. The Hurricane Forex Indicator is a multi time frame indicator that includes such things as Trade Notifications, Trade Calculator, Momentum Indicator, risk reward and much more. We have a free Trade room for our users as well. Please check out the video for full details of how this indicator works as it has over 15 years worth of developme

This indicator is another variant of the famous powerful indicator Fibonacci-SS https://www.mql5.com/en/market/product/10136 but has different behaviour in placing Pending Order and TP Line. Automatically places Fibonacci retracement lines from the last highest and lowest visible bars on the chart with: An auto Pending Order (Buy/Sell). Taking Profit 1, Taking Profit 2 is pivot point and Taking Profit 3 for extended reward opportunity. The best risk and reward ratio.
Simple and powerful indicat

Contact me after payment to send you the user manual PDF file. Introduction The moving average indicator is the most well-known and one of the most popular indicators among traders. It is very simple to work with, but a basic question has always become a big challenge among traders: What is the most optimal setting of the moving average for each chart-time frame? The answer to this question is very difficult, you have to try different settings of the moving average indicator for different chart
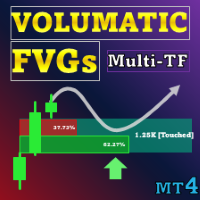
Özel teklif : ALL TOOLS , her biri sadece $35 ! Yeni araçlar $30 olacaktır ve ilk hafta veya ilk 3 satın alma için geçerlidir! Trading Tools Channel on MQL5 : En son haberler için MQL5 kanalıma katılın Volumatic Fair Value Gaps (FVG), anlamlı fiyat dengesizliği bölgelerini belirleyip korur ve her gap içindeki yönlü hacmi ayrıştırır. Hacim, daha düşük zaman diliminden (varsayılan M1, kullanıcı seçilebilir) alınır, Alım/Satım paylarına bölünür ve toplamı %100 olan iki yüzde çubuğu olar

Temel amaç: "Pin Çubukları", finansal piyasa grafiklerindeki pin çubuklarını otomatik olarak algılamak için tasarlanmıştır. Bir pim çubuğu, karakteristik bir gövdeye ve uzun bir kuyruğa sahip, bir trendin tersine çevrilmesini veya düzeltilmesini işaret edebilen bir mumdur.
Nasıl çalışır: Gösterge, grafikteki her mumu analiz ederek mumun gövdesinin, kuyruğunun ve burnunun boyutunu belirler. Önceden tanımlanmış parametrelere karşılık gelen bir pim çubuğu algılandığında, gösterge, pim çubuğunun y
FREE
Trend Line PRO göstergesi bağımsız bir işlem stratejisidir. Trend değişimini, işleme giriş noktasını gösterir ve ayrıca üç seviyede Kar Al ve Zarar Durdur korumasını otomatik olarak hesaplar. Trend Line PRO , tüm Meta Trader sembolleri için mükemmeldir: para birimleri, metaller, kripto para birimleri, hisse senetleri ve endeksler.
Gösterge, gerçek hesaplarda işlem yaparken kullanılır ve bu da stratejinin güvenilirliğini doğrular.
Trend Line PRO ve gerçek Sinyal kullanan robotlar burada bu

MT4 Sürümü: https://www.mql5.com/tr/market/product/125434 MT5 Sürümü: https://www.mql5.com/tr/market/product/157662
MT4 ASİSTANI: https://www.mql5.com/tr/market/product/107986
RALLİ TABAN RALLİSİ (RBR), DÜŞÜŞ TABAN RALLİSİ (DBR), DÜŞÜŞ TABAN DÜŞÜŞ (DBD), DÜŞÜŞ TABAN DÜŞÜŞ (RBD), ADİL DEĞER AÇIĞI (FVG) / DENGESİZLİK, GİZLİ TABAN
Finans piyasalarının dinamik dünyasında hassasiyet ve güvenle gezinmeniz için en iyi aracınız olan "Arz Talep MT4" Göstergesi'ni sunuyoruz. Bu son teknoloji Gösterge,
FREE

Gartley Hunter Multi - An indicator for searching for harmonic patterns simultaneously on dozens of trading instruments and on all classic timeframes: (m1, m5, m15, m30, H1, H4, D1, Wk, Mn). Manual (Be sure to read before purchasing) | Version for MT5 Advantages 1. Patterns: Gartley, Butterfly, Shark, Crab. Bat, Alternate Bat, Deep Crab, Cypher
2. Simultaneous search for patterns on dozens of trading instruments and on all classic timeframes
3. Search for patterns of all possible sizes. From t
Delta Fusion Pro – Gün İçi İşlem için Gelişmiş Emir Akışı Analizi
Delta Fusion Pro, MetaTrader 4 için profesyonel bir göstergedir. Agresif emir akışını ortaya çıkarır ve kurumsal baskının yoğunluğunu ve yönünü gerçek zamanlı olarak gösterir. Geleneksel hacim göstergelerinden farklı olarak, Ask ve Bid hacimleri arasındaki delta farkını analiz eder; dönüşleri önceden tahmin eder, trendleri doğrular ve profesyonel ilgi alanlarını belirler. Ana Özellikler Akıllı Otomatik Ayar Sistemi
Tüm parametr

The "Gold Trader Pro Indicator" is an advanced technical analysis tool for the MetaTrader 4 platform, designed to help you make informed trading decisions about gold. Using a combination of moving averages, RSI, ADX, MACD, and volume analysis, this indicator provides clear trading signals across multiple timeframes, including M5, M15, M30, H1, H4, and D1. My indicators for free. I only ask that leave your feedback to help me improve them or as a thank you. Have a good trade! Main Features Multi
FREE

Otomatik Optimize Edilmiş Bollinger Bantları – Gerçek Piyasa Davranışına Dayalı Uyarlanabilir Volatilite Aracı Bu gelişmiş MT4 göstergesi, geçmiş veriler üzerinde işlem simülasyonu yaparak en iyi dönem ve standart sapma değerlerini otomatik olarak bulur. Sabit parametreler yerine, piyasa değişimlerine ve fiyat yapısına dinamik olarak uyum sağlar; böylece gerçek zamanlı volatiliteyi daha doğru yansıtan bantlar oluşturur. Manuel ayar gerekmez. Temel Özellikler: Tarihsel verilere dayalı otomatik Bo
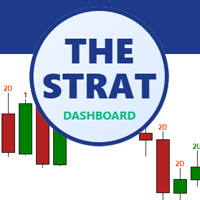
The Strat Dashboard - Rob Smith’in “The Strat” Stratejisi için Çoklu Sembol Tarayıcı Gerçek Zamanlı Çoklu Sembol Analiziyle İşlemlerinizi Dönüştürün The Strat Dashboard, Rob Smith’in ünlü “The Strat” fiyat hareketi stratejisini kullanan trader’lar için özel olarak tasarlanmış profesyonel bir göstergedir.
Birden fazla sembolü aynı anda farklı zaman dilimlerinde izleyin, yüksek olasılıklı formasyonları anında bulun ve hiçbir fırsatı kaçırmayın. MT5 Version :- https://www.mql5.com/en/market/pro
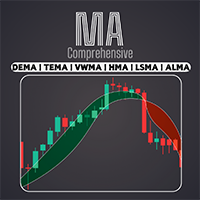
Profesyonel Kapsamlı Hareketli Ortalama göstergemizle EMA, SMA, WMA ve çok daha fazlası dahil olmak üzere çok çeşitli hareketli ortalamalara erişin. Teknik analizinizi, benzersiz ticaret tarzınıza uyacak şekilde hareketli ortalamaların mükemmel kombinasyonu ile özelleştirin / MT5 Sürümü
Özellikler
Farklı ayarlarla iki MA'yı etkinleştirme imkanı. Grafik ayarlarını özelleştirme imkanı. Çapraz MA'lara veya MA'larla çaprazlanan fiyata bağlı olarak mum çubuklarının rengini değiştirme imkanı. MA'lar
FREE

Royal Scalping Indicator is an advanced price adaptive indicator designed to generate high-quality trading signals. Built-in multi-timeframe and multi-currency capabilities make it even more powerful to have configurations based on different symbols and timeframes. This indicator is perfect for scalp trades as well as swing trades. Royal Scalping is not just an indicator, but a trading strategy itself. Features Price Adaptive Trend Detector Algorithm Multi-Timeframe and Multi-Currency Trend Low

Benzersiz Adil Değer Açığı MT4 Göstergemiz (FVG) ile daha önce hiç olmadığı gibi bir ticaret deneyimi yaşayın
Sınıfının en iyisi olarak kabul edilen bu MQL5 piyasa göstergesi, sıradanlığın ötesine geçiyor.
Yatırımcılara piyasa dinamikleri hakkında eşsiz bir doğruluk ve içgörü düzeyi sunuyoruz. EA Sürümü: WH Fair Value Gap EA MT4
SMC Tabanlı Gösterge: WH SMC Indicator MT4 Özellikler:
Sınıfının En İyisi Adil Değer Farkı Analizi. Çoklu Zaman Çerçevesi desteği. Özelleştirme. Gerçek zamanlı u
FREE
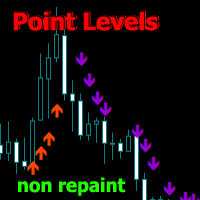
Point Directions - Fiyat hareket ettiğinde destek ve direnç noktalarının seviyelerini gösteren bir gösterge. Oklar, belirtilen yönlerde fiyat sıçramalarını gösterir.
Oklar yeniden çizilmez, mevcut mum üzerinde oluşturulurlar. Tüm zaman dilimlerinde ve ticaret enstrümanlarında çalışır. Birkaç uyarı türü vardır.
Herhangi bir grafik için sinyalleri özelleştirmek için gelişmiş ayarlara sahiptir. Trend ve düzeltmelerle işlem yapmak üzere yapılandırılabilir.
Ok çizmek için 2 tür hareketli ortalama ve
SL Curruncy impulse https://www.mql5.com/en/market/product/82593 SL Session Strength 28 Pair flow of this intraday Asian London New York Sessions strength.SL Session Strength 28 indicator best for intraday scalper. market powerful move time you can catch best symbol. because you'll know which currencies are best to trade at that moment. Buy strong currencies and sell weak currencies (Diverging currencies). Suggested timeframes to trading : M5 - M15 - M30 - You can however just change session

Special offer : ALL TOOLS , just $35 each! New tools will be $30 for the first week or the first 3 purchases ! Trading Tools Channel on MQL5 : Join my MQL5 channel to update the latest news from me MT5 için devrim niteliğindeki RSI Kernel Optimized with Scanner’ı sunuyoruz. Bu gelişmiş araç, güçlü Çekirdek Yoğunluk Tahmin (KDE) algoritmasını entegre ederek geleneksel RSI analizini yeniden tanımlıyor. Bu gelişmiş gösterge, sadece piyasadaki trendlerle ilgili gerçek zamanlı bilgiler

The Fair Value Gap (FVG) is a price range where one side of the market liquidity is offered, typically confirmed by a liquidity void on the lower time frame charts in the same price range. Price can "gap" to create a literal vacuum in trading, resulting in an actual price gap. Fair Value Gaps are most commonly used by price action traders to identify inefficiencies or imbalances in the market, indicating that buying and selling are not equal. If you're following the ICT Trading Strategy or Smart
FREE
Bu VWAP basit bir VWAP'tir, ancak fiyatın VWAP çizgisine ulaştığında veya geçtiğinde bilgi veren bildirimler ekledik. Bu gösterge, MetaTrader 4 (MT4) için geleneksel bir VWAP göstergesidir. Varsayılan parametreler normal VWAP'inkilerdir, ancak VWAP hesaplamasını ve en iyisini değiştirme yeteneğine sahipsiniz: Fiyat VWAP'a dokunduğunda veya geçtiğinde, sizi uyarılar, cep telefonu bildirimleri, e-posta veya ses olayları aracılığıyla bilgilendirir. MetaTrader 4 için VWAP göstergesi . Parametreler:
FREE
The indicator allows you to instantly determine the current trend by color and FIBO levels. Higher Timeframe the panel shows the current trend of higher periods, helping to determine the strength of the trend Trade according to the trend when changing the color of candles or trade against the trend when the price hit the extreme levels of the FIBO Trend PRO indicator Advantages of the FIBO Trend PRO
Indicator never repaint and does not change their values Very easy to use and intuitive

IX Power: Endeksler, Emtialar, Kripto Paralar ve Forex Piyasaları için İçgörüler Genel Bakış
IX Power , endeksler, emtialar, kripto paralar ve forex sembollerinin gücünü analiz etmek için tasarlanmış çok yönlü bir araçtır. FX Power , tüm kullanılabilir döviz çiftlerinin verilerini kullanarak döviz çiftleri için maksimum doğruluk sağlarken, IX Power yalnızca temel sembolün piyasa verilerine odaklanır. Bu, IX Power 'ı forex dışındaki piyasalar için ideal ve daha basit forex analizleri için güven

The official release price is $65 only for the first 10 copies, ( only 2 copies left ). Next price: $125 Gold Scalper System is a multifunctional trading system that combines a breakout strategy for key liquidity levels with confirmation and a built-in Smart DOM Pro module for market depth analysis. The system identifies zones of limit order accumulat

The indicator is a trading system for short-term trading.
Scalper Assistant helps to determine the direction of the transaction, and also shows the entry and exit points.
The indicator draws two lines (possible points for opening positions).
At the moment of the breakdown of the upper line up (and when all trading conditions are met), an up arrow appears (a buy signal), as well as 2 goals.
At the moment of the breakdown of the lower line down (and when all trading conditions are met), a down ar

ŞU ANDA %20 INDIRIMLI!
Yeni Başlayanlar veya Uzman Tüccarlar için En İyi Çözüm!
Bu Gösterge uygun fiyatlı bir ticaret aracıdır çünkü yeni bir formülle birlikte bir dizi tescilli özelliği bir araya getirdik.
Gelişmiş Birikmiş Döviz Hacmi Göstergesi, ana 28 Forex çifti için uzmanlaşmıştır ve tüm zaman dilimlerinde çalışır. Tek bir grafik üzerinde AUD, CAD, CHF, EUR, GBP, JPY, NZD ve USD'nin tüm döviz hacmini (C-Hacmi) çıkaran yeni bir formüldür. Bu, ticarette büyük bir avantajdır. Hacim tüccar

What indicator do you look at most on your MT4 charts? Is it the Moving Average? I d o not believe that the default grid lines on MT4 charts—which you likely see hundreds or thousands of times—are designed with the intent of helping the user win. This is why MT4 users apply various indicators and go through trial and error. Because it is a chart you look at every day, it must present reliable information that we humans can recognize intuitively. This indicator was born from a single core concep

Special offer : ALL TOOLS , just $35 each! New tools will be $30 for the first week or the first 3 purchases ! Trading Tools Channel on MQL5 : Join my MQL5 channel to update the latest news from me Volumetrik Sipariş Blokları Çoklu Zaman Çerçevesi göstergesi, önemli piyasa katılımcılarının siparişleri biriktirdiği kilit fiyat bölgelerini belirleyerek piyasa davranışına daha derin bir içgörü arayan tüccarlar için tasarlanmış güçlü bir araçtır. Bu bölgeler, Volumetrik Sipariş Bloklar

Candle Probability Scalper Kullanım Kılavuzu Bu gösterge, scalping'i kolay ve %100 sezgisel hale getirir. Candle Probability Scalper , GERÇEK ZAMANLI olarak mevcut mum üzerinde alıcıların ve satıcıların güç yüzdelerini bir bakışta gösterir. Yüzdeler her tikte güncellenir, bu sayede alıcı ve satıcıların çoğunluğunun ne yaptığını saniye saniye gecikme olmadan bilirsiniz. Bu, her bir tarafın gücünü belirlemenize veya doğrulamanıza ve dolayısıyla fiyatın olası yönünü tahmin etmenize büyük ölçüde ya

BinaryIndicator is a highly accurate indicator for trading binary options. It shows excellent results in scalping. This indicator is based in multifactor analysis of trend indicators, as well as confirmation oscillators, which in the end gives an increased accuracy of signals.
Advantages of the indicator Increased accuracy of signals. Excellent results when trading binary options with a short expiration time from M30 to M1 . It works on any timeframes. Works with any trade symbols.
Parameters
Özel teklif : TÜM ARAÇLAR , her biri sadece $35 ! Yeni araçlar ilk hafta veya ilk 3 satın alma için $30 olacaktır! MQL5’te Trading Tools Kanalı : Benden gelen en son haberler için MQL5 kanalıma katılın Stochastic Z-Score, fiyatı Z-Score ile normaleştirip stokastik mantıkla sınırlandıran ve HMA ile yumuşatan bir moment osilatörüdür; uzun vadeli bağlam için ALMA kullanır. İsteğe bağlı öğeler arasında histogram, dinamik bantlar ve dönüş etiketleri bulunur.
MT5 sürümü için bkz.: Stochast
Volumatic Trend is a powerful, trend-following indicator that merges directional analysis with real-time volume behavior. By combining adaptive trend logic and volume overlays, it gives traders a detailed snapshot of market conviction and potential turning points. From instant trend shift detection to volume-weighted candle visuals, this tool brings deeper context to price movement. MT5 Version - https://www.mql5.com/en/market/product/136211/ Join To Learn Market Depth - https://www.mql5.com/
FREE
SEE THE TREND ON EVERY TIME FRAME. INTELLIGENT INDICATOR READS PRICE ACTION TO SPOT TRUE MARKET CYCLES AND TREND. This advanced multi-currency and multi-time frame indicator, reads trend in real-time so you always know the trends of the markets you want to trade.
Trend-Viewer Pro has been specifically designed to read the trend of every time frame and every market , simultaneously, making it much easier for you to find markets with time frame correlation , so you can focus on the best markets

Hydra Trend Rider is a non-repainting, multi-timeframe trend indicator that delivers precise buy/sell signals and real-time alerts for high-probability trade setups. With its color-coded trend line, customizable dashboard, and mobile notifications, it's perfect for traders seeking clarity, confidence, and consistency in trend trading. Setup & Guide: Download MT5 Version here. To learn how to use the Indicator: Indicator Manual & Guide - Read Here
Exclusively for you: It's your chance to st
Speed Trend Matrix Ultimate (Sürüm 5.10) Speed Trend Matrix (STM) , tek bir gösterge içinde kapsüllenmiş kapsamlı bir ticaret sistemidir. Yalnızca aşırı alım veya aşırı satım koşullarını gösteren standart osilatörlerin aksine, STM piyasa volatilitesine (ATR) göre fiyat hareketinin "hızını" analiz eder. Yalnızca trend yönünü değil, aynı zamanda hareketin arkasındaki gücü de belirler ve trader'ların sıklıkla yanlış sinyallere yakalandığı düşük momentumlu "Düz (Flat)" dönemleri filtreler. Bu araç,

Support And Resistance Screener, MetaTrader için tek bir gösterge içinde birden fazla araç sağlayan tek bir Düzey göstergesindedir. Kullanılabilir araçlar şunlardır: 1. Piyasa Yapısı Eleme Aracı. 2. Geri Çekilme Bölgesi Boğa. 3. Geri Çekilme Bölgesi Ayı. 4. Günlük Pivot Noktaları 5. haftalık Pivot Noktaları 6. aylık Pivot Puanları 7. Harmonik Modele ve hacme dayalı Güçlü Destek ve Direnç. 8. Banka Seviyesi Bölgeleri. SINIRLI SÜRELİ TEKLİF : YG Destek ve Direnç Göstergesi sadece 50 $ ve ömür boy
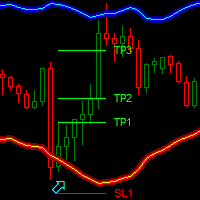
Dark Bands is an Indicator for intraday trading. This Indicator is based on Counter Trend strategy but use also Volatility. We can enter in good price with this Indicator, in order to follow the inversions on the current instrument.
Key benefits
Easily visible take profit/stop loss lines Reliable bands lines with futuristic colors, and Intuitive directional arrows Useful statistics , which indicate the win rate of the signals Plus Package available, leave a feedback to receive
FREE

ICT, SMC, SMART MONEY CONCEPTS, SMART MONEY, Smart Money Concept, Support and Resistance, Trend Analysis, Price Action, Market Structure, Order Blocks, BOS/CHoCH, Breaker Blocks , Momentum Shift, Supply&Demand Zone/Order Blocks , Strong Imbalance, HH/LL/HL/LH, Fair Value Gap, FVG, Premium & Discount Zones, Fibonacci Retracement, OTE, Buy Side Liquidity, Sell Side Liquidity, BSL/SSL Taken, Equal Highs & Lows, MTF Dashboard, Multiple Time Frame, BigBar, HTF OB, HTF Market Structure,
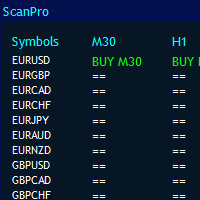
MT4 Universal Panel pro , ex4 dosyaları da dahil olmak üzere tüm göstergeler ve zaman dilimleri için tasarlanmıştır.
Bilgisayarınızın gücüne ve 10 zaman dilimine kadar sınırsız sayıda çifti tarayabilir. Panelin boyutu otomatik olarak düzenlenecektir.
arabelleklerle herhangi bir göstergeyi arayabilirsiniz.
Tüm varsayılan ve özel göstergeler için çalışır. Heikan ashi, rsi, parabolik, renko, fraktallar, destek direnci, arz talep, sapma, yüksek ve düşük hareketli ortalamalar için kullanabilirsi

My Intraday trading session indicator. SL Session Strength 28 Pair https://www.mql5.com/en/market/product/57585 This strategy is even used by the Banks to make profits. They take a strong currency and pitch against a weak currency This indicator allows you to analyze the hidden trends and correlations between the 8 most traded currencies via unique strength meter which creates multiple charts in a single window based on the price action of each currency in relation to all other currenci

Özel MT4 göstergemizle başarılı forex ticaretinin sırrını keşfedin!
Strategy with RangeBars https://youtu.be/jBaDCAPTtHc
Forex piyasasında nasıl başarıya ulaşacağınızı hiç merak ettiniz, riski en aza indirirken sürekli olarak kar kazandınız mı? İşte aradığınız cevap! Ticaret yaklaşımınızda devrim yaratacak tescilli MT4 göstergimizi tanıtmamıza izin verin.
Benzersiz çok yönlülük
Göstergemiz, Renko ve RangeBar Mum oluşumlarını tercih eden kullanıcılar için özel olarak tasarlanmıştır. Bu grafik t

The Currency Index indicator enables traders to display any index of eight major currencies. It uses a special calculation that considers specific currency pairs and their weights.
The default weights are based on the BIS Triennial Central Bank Survey results. Because of this advantage, the trader can see each currency's true strength and weakness.
Note: If the indicator is used in Strategy Tester (demo version), please keep in mind that all currency pairs' data must be downloaded in History

Supply Demand Analyzer is an advanced trading indicator meticulously designed for the precise identification, analysis, and management of supply and demand zones. By integrating real-time data and advanced algorithms, this tool enables traders to recognize market phases, price movements, and structural patterns with unparalleled accuracy. It simplifies complex market dynamics into actionable insights, empowering traders to anticipate market behavior, identify trading opportunities, and make info

Auto Optimized RSI: Profesyonel Piyasa Adaptasyonu Çoğu trader başarısız olur çünkü dinamik bir piyasada statik araçlar kullanırlar. Her grafikte 70/30 gibi sabit RSI seviyelerini kullanmak matematiksel bir hatadır. Mantıksal bir temeli olmayan "sihirli bir ok" arıyorsanız, bu gösterge size göre değildir. Bu araç, trading'de hayatta kalmanın tek anahtarının "Optimizasyon" olduğunu anlayan profesyoneller için tasarlanmıştır. Standart göstergeler işlem yaptığınız sembolü veya zaman dilimini dikkat
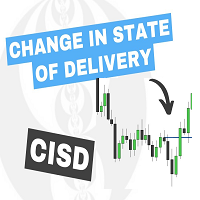
The Change In State Of Delivery (CISD) indicator detects and displays Change in State Of Delivery, a concept related to market structures.
Users can choose between two different CISD detection methods. Various filtering options are also included to filter out less significant CISDs.
USAGE Figure 2 A Change in State of Delivery (CISD) is a concept closely related to market structures, where price breaks a level of interest, confirming trends and their continuations from the resulting

The Area of Interest (AOI) Indicator is a powerful tool designed to help traders identify key market zones where price reactions are highly probable. This indicator specifically highlights two critical zones: Seller AOI (Area of Interest) : This zone represents areas where sellers are likely to enter the market, often acting as resistance. When the price approaches or touches this zone, it signals that a potential sell-off could occur. Buyer A OI (Area of Interest) : The BOI zone identifies re
FREE

Ücretsiz ama gelişmiş ürünün genel bakışı Turbo Trend, yatırımcıların piyasa trendlerini tanımlamalarına ve bu trendlere göre işlem yapmalarına yardımcı olmak için tasarlanmış güçlü bir göstergedir. İleri düzey hareketli ortalamalar ve hacim analizi kombinasyonu kullanarak, trend yönü için net sinyaller sağlar. Turbo Trend, piyasa koşullarını üç farklı duruma ayırarak karar alma sürecini basitleştirir: Yükseliş Trendi , Düşüş Trendi ve Nötr Trend, kolayca ayırt edilebilen renk kodlu çizgiler ve
FREE

ForexVitals Vital Trend Signals Grafikte net al/sat sinyalleri üreten ve risk seviyelerini doğrudan grafik üzerinde projekte eden bir trend-takip göstergesidir. Temiz bir görsel iş akışı isteyen yatırımcılar için tasarlanmıştır: sinyal, stop referansı, hedef projeksiyonu ve isteğe bağlı grafik içi istatistikler. Neler sunar Trend koşulları uyumlandığında grafikte Al/Sat okları Mevcut stop mesafesi ve TP_Ratio değerine göre isteğe bağlı TP/SL projeksiyon çizgileri Kompakt bir sinyal özeti sunan
FREE

MT4 Multi-timeframe Order Blocks detection indicator. Features - Fully customizable on chart control panel, provides complete interaction. - Hide and show control panel wherever you want. - Detect OBs on multiple timeframes. - Select OBs quantity to display. - Different OBs user interface. - Different filters on OBs. - OB proximity alert. - ADR High and Low lines. - Notification service (Screen alerts | Push notifications). Summary Order block is a market behavior that indicates order collection
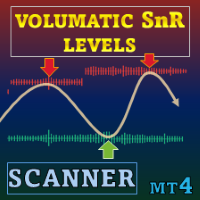
Özel teklif : ALL TOOLS , tanesi sadece $35 ! Yeni araçlar ilk $30 için ilk hafta veya ilk 3 alışveriş te olacak! Trading Tools Channel on MQL5 : En son haberler için MQL5 kanalımı takip edin Volumatic Support/Resistance Levels Scanner, fiyat yapısına hacim bağlamı ekleyen bir destek‑direnç göstergesidir. İşlem hareketinin son pivotlar çevresinde nasıl kümelendiğini göstererek, alım veya satım ilgisinin en yoğun olduğu seviyeleri görmeyi sağlar. MT5 sürümü için: Volumatic Support

Gösterge, belirtilen alandaki (BOX) yatay hacim profilini ve maksimum hacmi (POC) görüntüler.
Ürün Özellikleri. 1. Keneleri veya sadece fiyatı kullanabilirsiniz. 2. Uyarlanabilir ızgara aralığı (M1-MN). 3. Kutu boyutuna bağlı olarak uyarlanabilir yüksek hacimli (medyan) arama adımı. 4. Kutu çizgileri ve düğmeler için otomatik bukalemun rengi. 5. Çoklu kutular, oluşturulması ve silinmesi kolay. 6. %70 hacim alanı (ayarlardan etkinleştirilir). 7. Maksimum yatay hacim çizgisine (POC) dokunmak için
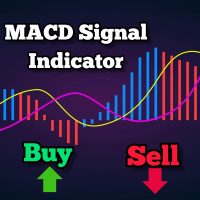
Bu, MACD tabanlı bir trend takip göstergesidir ve 200 MA'nın üzerindeyken alım sinyalleri, altındayken satış sinyalleri sağlar.
Sinyal, MACD'nin sıfır çizgisini geçtiğinde üretilir. Gösterge aynı zamanda stop loss olarak kullanılabilecek bir destek ve direnç seviyesini de görüntüler. Ayarlanabilir parametreler arasında MA dönemi, MACD hızlı EMA, yavaş EMA ve destek-direnç aralığı bulunur. Son mumların en düşük ve en yüksek noktalarına çizilir.
Varsayılan ayarlar:
SR aralığı: 10 MA dönemi: 20
FREE

Ortalama Günlük Aralık, belirli sayıda periyot üzerinden ölçülen bir Forex çiftinin ortalama pip aralığını gösterir. Yatırımcılar, ortalama günlük hareketin dışındaki potansiyel fiyat hareketini görselleştirmek için ADR'yi kullanabilir. ADR ortalamanın üzerinde olduğunda, günlük oynaklığın normalden daha yüksek olduğu anlamına gelir, bu da döviz çiftinin normunun ötesine geçebileceği anlamına gelir.
ADR Analizörümüz 5 ana özellikten oluşmaktadır: Aralık ( ADR ) Screener: Çoklu para birimi ADR

Bu gösterge, piyasanın tersine dönme noktalarını tahmin eden en popüler Harmonik Kalıpları tanımlar. Bu harmonik modeller, forex piyasasında sürekli tekrar eden ve gelecekteki olası fiyat hareketlerini öneren fiyat oluşumlarıdır / Ücretsiz MT5 Sürümü
Buna ek olarak, bu gösterge yerleşik bir piyasaya giriş sinyalinin yanı sıra çeşitli kar alma ve zararı durdurma sinyallerine de sahiptir. Harmonik formasyon göstergesi kendi başına al/sat sinyalleri sağlayabilse de, bu sinyallerin diğer teknik gö
FREE

Everyone who purchases the Scalping signals M1 indicator receives a FREE BONUS — a fully automated Expert Advisor that trades based on the indicator’s signals.
The indicator shows the arrows — the robot can execute the trades for you, following all signals and risk-management rules. Scalping signals M1 – a ready-made trend-following entry system for M1 Scalping signals M1 is an indicator that turns your chart into a clear action map:
a colored trend channel shows the direction of the market, and
Binary Trader Master , mumun kapanışını tahmin eden ok tabanlı bir göstergedir. Analizini sadece bir mum içerisinde yapar. Mum açıldığında, analiz yapmak ve mumun kapanışını tahmin etmek için birkaç dakika gerekir. Sonra bir sinyal üretir. Gösterge ayrıca, analiz için kullanabileceği zaman sınırlarını uygulamanıza izin verir; bu, göstergeye, mum içinde analiz için ne kadar zamana sahip olmasına gerçekten izin verildiğini söyleyebileceğiniz anlamına gelir. Gösterge, mumlardaki özel hacim kalıplar

Bu gösterge, temiz ve doğru sinyalleri tercih eden traderlar için tasarlanmış, basit ama son derece güvenilir bir trend yönü tahmin aracıdır. Ana Özellikler Trend tahmin okları – fiyat hareketine göre Buy/Sell sinyalleri. Az ama yüksek doğrulukta sinyal – genelde günde 1 sinyal. Exit sinyalleri – en uygun kapanış zamanı için Exit okları. Repaint yok – oklar asla değişmez. Buffer desteği – özel araçlar veya EA için uygun. Uyarılar dahil – popup, ses ve push bildirimleri. Ayarlanabilir ok boyutu –

Özel teklif : ALL TOOLS , her biri sadece $35 ! Yeni araçlar $30 olacak; ilk hafta veya ilk 3 satın alma için! Trading Tools Channel on MQL5 : En güncel haberlerimi almak için MQL5 kanalım’a katılın Liquidation Reversal Signals Z-score hacim uç değerlerini ve Supertrend durum değişimlerini birleştirerek yönlü likidasyon fazlarını işaretlemek ve dönüş noktalarını doğrulamak için tasarlanmış bir göstergedir. Trend yalnızca “renk değiştirirken” her seferinde bir ok
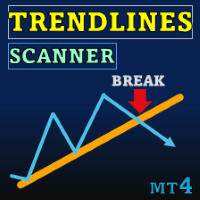
Special offer : ALL TOOLS , just $35 each! New tools will be $30 for the first week or the first 3 purchases ! Trading Tools Channel on MQL5 : Join my MQL5 channel to update the latest news from me Trendlines with Breaks Scanner , traderların kritik trendleri tanımlamasına ve gerçek zamanlı olarak kırılmaları tespit etmesine yardımcı olmak için tasarlanmış son teknoloji bir ticaret aracıdır. Pivot noktalarına dayalı olarak otomatik üretilen trend çizgileri sayesinde, bu gösterge tr

Pivot Flow Pro - Trend-structure market direction using pivot highs and lows to form a dynamic bull/bear band.
Non-repainting trend-structure indicator that identifies market direction using averaged pivot highs and lows to form a dynamic bull/bear band, with signals confirmed strictly on closed candles. When price closes above or below the adaptive pivot levels, the indicator shifts trend and prints a flip arrow, while continuation dots highlight valid breakout points in the direction of the c
MetaTrader mağazası, alım-satım robotları ve teknik göstergelerin benzersiz bir deposudur.
Yatırımcılara sunduğumuz benzersiz hizmetler hakkında daha fazla bilgi edinmek için MQL5.community - Kullanıcı notunu okuyun: alım-satım sinyallerini kopyalama, freelancerlar tarafından geliştirilen özel uygulamalar, ödeme sistemi aracılığıyla otomatik ödemeler ve MQL5 Bulut Ağı.
Alım-satım fırsatlarını kaçırıyorsunuz:
- Ücretsiz alım-satım uygulamaları
- İşlem kopyalama için 8.000'den fazla sinyal
- Finansal piyasaları keşfetmek için ekonomik haberler
Kayıt
Giriş yap
Gizlilik ve Veri Koruma Politikasını ve MQL5.com Kullanım Şartlarını kabul edersiniz
Hesabınız yoksa, lütfen kaydolun
MQL5.com web sitesine giriş yapmak için çerezlerin kullanımına izin vermelisiniz.
Lütfen tarayıcınızda gerekli ayarı etkinleştirin, aksi takdirde giriş yapamazsınız.