Something Interesting - page 18
You are missing trading opportunities:
- Free trading apps
- Over 8,000 signals for copying
- Economic news for exploring financial markets
Registration
Log in
You agree to website policy and terms of use
If you do not have an account, please register
Tom DeMark’s TD Sequential :
TD Sequential - indicator for MetaTrader 4
TD Sequential - indicator for MetaTrader 4
-----
The New Science of Technical Analysis
by Thomas R. Demark
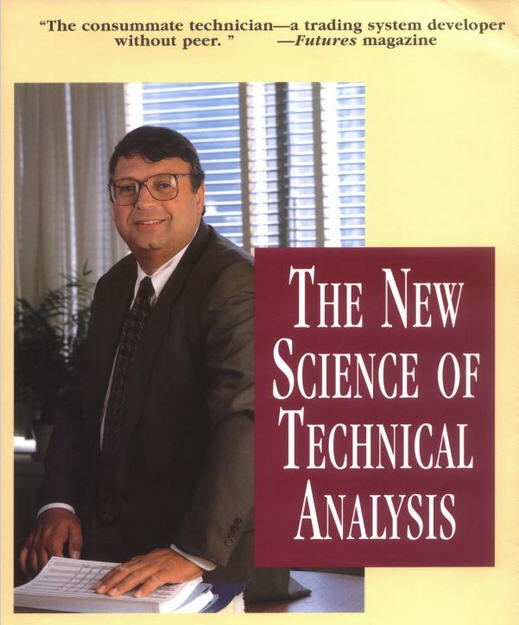
From the Foreword by John J. Murphy "DeMark's work as a consultant has been restricted to large institutions and many of the legendary traders in the world today. By sharing his creative ideas with us, as well as his passion for precision and improvement, Tom DeMark's emphasis on the 'new science' of technical analysis helps push the technical frontier another step forward. With the unprecedented attention now being paid to technical analysis, this new book couldn't have come at a better time."-John J. Murphy, bestselling author of Technical Analysis of the Futures Markets and Intermarket Technical Analysis, and technical analyst for CNBC
"This book is filled with innovative, creative, and clever new ideas on technical analysis. Tom DeMark has done a wonderful job of turning subjective techniques into objective strategies and tactics."
- Courtney Smith President and CIO Pinnacle Capital Management, Inc.
"Those who know him and his work call him the consummate technician--a trading system developer without peer."
- Futures magazine
"DeMark is the ultimate indicator and systems guy. No one touches him. I know the Holy Grail of trading systems doesn't exist because if it did, Tom would have found it by now."
- James Bianco Director of Arbor Trading
"Tom DeMark is a genuine leader who has been behind-the-scenes until now. Publishing DeMark is a coup."
- Ralph Vince author of The Mathematics of Money Management
Forum on trading, automated trading systems and testing trading strategies
Discussion of article "The Implementation of Automatic Analysis of the Elliott Waves in MQL5"
Sergey Golubev, 2014.03.13 09:39
Keys to Investor Success - Elliott Wave Theory (based on thetechnicaltraders article)
Elliott Wave Theory - Plenty of people will freely offer you advice on how to spend or invest your money. “Buy low and sell high,” they’ll tell you, “that’s really all there is to it!” And while there is a core truth to the statement, the real secret is in knowing how to spot the highs and lows, and thus, when to do your buying and selling. Sadly, that’s the part of the equation that most of the advice givers you’ll run across are content to leave you in the dark about.
The reality is that no matter how many times you are told differently, there is no ‘magic bullet.’ There is no plan, no series of steps you can follow that will, with absolute certainty, bring you wealth. If you happen across anyone who says otherwise, you can rely on the fact that he or she has an agenda, and that at least part of that agenda involves convincing you to open your wallet.
In the place of a surefire way to make profits, what is there? Where can you turn, and what kinds of things should you be looking for?
The answers to those questions aren’t as glamorous sounding as the promises made by those who just want to take your money, but they are much more effective. Things like careful, meticulous research. Market trend analysis. Paying close attention to extrinsic factors that could impact whatever industry you’re planning to invest in, and of course, Elliott wave theory. If you’ve never heard of the Elliott wave, you owe it to yourself to learn more about it.
Postulated by Ralph Nelson Elliott in the late 1930’s, it is essentially a psychological approach to investing that identifies specific stimuli that large groups tend to respond to in the same way. By identifying these stimuli, it then becomes possible to predict which direction the market will likely move, and as he outlined in his book “The Wave Principle,” market prices tend to unfold in specific patterns or ‘waves.’
The fact that many of the most successful Wall Street investors and portfolio managers use this type of trend analysis in their own decision making process should be compelling evidence that you should consider doing the same. No, it’s not perfect, and it is certainly not a guarantee, but it provides a strong framework of probability that, when combined with other research and analysis, can lead to consistently good decisions, and at the end of the day, that’s what investing is all about. Consistently good decision making.
We can use Elliott Wave Theory in real time by looking at the larger patterns of the SP 500 index for example. We can deploy Fibonacci math analysis to prior up and down legs in the markets to determine where we are in an Elliott Wave pattern. This will help us decide if to be aggressive when the markets correct, go short the market, or to do nothing for example. It also prevents from making panic type decisions, whether that be in chasing a hot stock too higher or selling something too low before a reversal. We also can use Elliott Wave Theory to determine when to be aggressive in selling or buying, on either side of a trade.For many, its not practical to employ Elliott Wave analysis with individual stocks and trading, but it can be done with experience.
Knowing when to enter and exit a position whether your time frame is short, intermediate, or longer… can often be identified with good Elliott Wave Theory practices. Your results and your portfolio will appreciate it
Forum on trading, automated trading systems and testing trading strategies
Something Interesting to Read March 2014
Sergey Golubev, 2014.03.13 09:30
The Wave Principleby Ralph Nelson Elliott
The Elliott Wave Principle is a form of technical analysis that some traders use to analyze financial market cycles and forecast market trends by identifying extremes in investor psychology, highs and lows in prices, and other collective factors. Ralph Nelson Elliott, a professional accountant, discovered the underlying social principles and developed the analytical tools. He proposed that market prices unfold in specific patterns, which practitioners today call Elliott waves, or simply waves. Elliott published his theory of market behavior in this book "The Wave Principle". Elliott stated that "because man is subject to rhythmical procedure, calculations having to do with his activities can be projected far into the future with a justification and certainty heretofore unattainable."
Forum on trading, automated trading systems and testing trading strategies
Expert Advisors: ElliottWaveMaker 3.0
Sergey Golubev, 2013.10.19 12:21
How to Understand the Three Building Blocks for Trading Elliott Wave
Talking Points
- How To Understand the Basic Pattern
- How To Understand Corrections vs. Impulses In Markets
- How To Understand Fibonacci In Relation To Wave Development
“I attribute a lot of my own success to the Elliott Wave approach.”-Paul Tudor Jones, Tudor Jones Capital
Elliott Wave is a great trading tool for trading trends. However, it’s not as confusing as a lot people make it out to be when you consider the primary objective of the tool. Elliott Wave is meant to put the current move of the market in context for you, the trader.
Putting the market in context for you is of great help. For starters, if you know a market that has recently been in a strong trend is correcting, you can look for a resumption of the prior trend to enter at a favorable price. Also, you can look to see if the pattern is starting to break down to see if the prior trend has exhausted itself, and look to either take profits or enter a new trade in the direction of the new trend.
Understand the Basic Pattern
The picture above is a mock-up that shows the progression of markets as seen in Elliott Wave. As you can see, the market is often broken up by strong trends and minor moves against the trend. The with-trend moves are known as impulse or motive waves and the counter trend moves are known as correction.
Another key aspect of Elliott Wave is that trends are fractal. Simply put, that means that each impulsive wave can be broken down into 5 smaller waves and each correction can be broken into 3 smaller segments of a counter-trend move. However, it’s often not overly necessary to label every single aspect of the wave.
How to Understand Corrections vs. Impulses in Markets
As illustrated above, the trend or impulse unfolds in 5-waves whereas corrections unfold often in a 3-wave pattern. You’ll often hear Elliott wave fans discussing trading based on 5-s & 3-s and that is because they identify the trend and countertrend moves based on the unfolding of a move in 5 & 3-wave patterns.
Furthermore, in understanding the basic 5-wave impulse or trend, you can be on the lookout for a 3-wave correction or developing correction. The purpose of looking for a correction is that as the trend resumes, you can look for the correction to be losing steam so that you can enter at a good price. What many traders who are unfamiliar with Elliott wave often end up doing is chasing the price or enter on the extension of the trend right before the correction begins. This causes them to get stopped out because they did not understand the context of the market and current trend when they entered the trade.
When looking at the 5-wave pattern and 3-wave correction to get context, you can see how the breaking down of GBPUSD has us looking for a correction to continue. Therefore, I’m taking the context as provided by Elliott Wave to get a better feel for GBPUSD. Once this corrective move to the downside completes, then I can look for a buy on a resumption of the overall trend to higher prices.
If you’re not trading GBPUSD, you can take a look at the chart you’re trading and see if you can identify any 5-wave or 3-wave structures. That will help you grab a context of the current market so that you can look for the maturity of the current trend or ideally the exhaustion of the correction. After you’ve identified a current market as ready to resume the trend, you can then look to Fibonacci numbers in order to see where the market is likely go to go as according to Elliott Wave.
How to Understand Fibonacci In Relation To Wave Development
“When R.N. Elliott wrote Nature’s Law, he explained that the Fibonacci sequence provides the mathematical basis of the Wave Principle”
-Elliott Wave Principle, Frost & Prechter pg. 91
Once you’ve been able to get context for the current trend, you can then look to Fibonacci numbers in order to find price objectives within Elliott Wave. In other words, the reason why Elliott Wave traders often utilize Elliott Wave is because you can have definitive levels as to where the correction may end with Fibonacci Retracements. Furthermore, you can have price objectives by utilizing the Fibonacci Expansion tool.
One key thing to note when utilizing Fibonacci retracements within Elliott Wave is that there are levels to watch out for but rarely a level that the market must hit. Therefore, you want to focus on price action near levels like the 61.8% on a wave 2 and a 38.2% on wave 4. If you see a lack of conviction past these levels then you can look to a resumption of the overall trend off of these levels.
In terms of price objectives, you can use the Fibonacci expansion tool. The expansion tool takes three points on the chart to project the exhaustion of the next impulse. The most-commonly used targets are the 61.8%, 100% & 161.8% expansion. This simply means that this impulse is either 61.8%, 100% or 161.8% of the prior wave and simply shows you the progression and strength of the current trend.
Closing thoughts
Elliott can be a headache if you worry about labeling every wave and every correction. Instead, I’d recommend focusing on the big picture. In other words, are we in an impulse or a correction? More importantly, if we’re in a correction that’s about to be exhausted, where can we enter on the resumption of the trend?
Forum on trading, automated trading systems and testing trading strategies
Expert Advisors: ElliottWaveMaker 3.0
Sergey Golubev, 2013.12.15 14:24
Elliott Wave (based on thetechnicaltraders article)
Every investor has seen the odd phenomena of stocks going down when there is good news about the stock or conversely stocks going up when there is bad news about the stock. Is there a system that can be used to help analyze these trends and to be able to then predict stock trends? The answer is yes, and one possibility is Elliot Wave Theory.
Elliot Wave Theory examines how groups of individuals react en masses to things in their environment and the psychological reasons for such reactions. Elliot Wave Theory then groups those reactions into predictable patterns or ‘waves. Once you have identified a particular trigger, you can then predict the coming waves and how groups will behave in accordance to those waves.
Elliot Waves: mini waves make up bigger waves
The key component of Elliot Wave Theory are the Elliot Waves themselves. Several mini Elliot Waves will make up one bigger wave. The bigger wave is known as a fractal. Fractals can then be grouped together to create an even larger wave showing a complete trend based one trigger.
Elliot Wave Predictions
The stock market is an excellent vehicle to use Elliot Wave Theory to analyze potential market trends. Once a potential trigger has been identified, the potential movement of the stock can be predicted by the applying the Elliot Wave principles. Opportunities for solid Elliot Wave Predictions exist whether the stock is moving in an upwards or downwards trend as Elliot Wave Theory accounts for upwards and downwards movement.
Elliot Wave Gold
Elliot Wave Theory can be applied to anything that is traded, including gold. Elliot Wave Gold systems can provide an opportunity for excellent growth. The key of course is being able to identify a trigger, understand that triggers implications, and then predict how groups of investors will react. That’s where solid, proven Elliot Wave Theory application can give you an edge in your invested strategies.
GG-TimeBox - indicator for MetaTrader 4
Timeframe indicator. Customizable timeboxes on any chart.
Just the examples:
How To Trade - Heiken Ashi indicator and How Does It Work (adapted from the article)
Heikin-Ashi chart looks like the candlestick chart, but the method of calculation and plotting of the candles on the Heikin-Ashi chart is different from the candlestick chart. In candlestick charts, each candlestick shows four different prices: Open, Close, High and Low price.
But Heikin-Ashi candles are different and each candle is calculated and plotted using some information from the previous candle:
1- Open price: the open price in a Heikin-Ashi candle is the average of the open and close of the previous candle.
2- Close price: the close price in a Heikin-Ashi candle is the average of open, close, high and low prices.
3- High price: the high price in a Heikin-Ashi candle is chosen from one of the high, open and close price of which has the highest value.
4- Low price: the low price in a Heikin-Ashi candle is chosen from one of the low, open and close price of which has the lowest value.
So candles of a Heikin-Ashi chart are related to each other because the open price of each candle should be calculated using the previous candle close and open prices, and also the high and low price of each candle is affected by the previous candle. So a Heikin-Ashi chart is slower than a candlestick chart and its signals are delayed.
The Heikin-Ashi chart is delayed and the candlestick chart is much faster and helps us to make more profit. Why should we use a Heikin-Ashi chart then? As it was already explained, because of the delay that the Heikin-Ashi chart has, it has less number of false signals and prevent us from trading against the market. On the other hand, Heikin-Ashi candles are easier to read because unlike the candlesticks they don’t have too many different patterns.
Free to Download
There are many Heiken Ashi indicators (and EA) on MT5 CodeBase, for example :
Trading signals module based on Heiken_Ashi_Smoothed indicator
Heiken_Ashi_Smoothed_HTF_Signal
Heiken Ashi Smoothed
Heiken-Ashi
========
An Example of a Trading System Based on a Heiken-Ashi Indicator
Heiken Ashi based EAForum on trading, automated trading systems and testing trading strategies
Press review
Sergey Golubev, 2014.03.07 09:08
Who Can Trade a Scalping Strategy? (based on dailyfx article)
The term scalping elicits different preconceived connotations to different traders. Despite what you may already think, scalping can be a viable short term trading methodology for anyone. So today we will look at what exactly is scalping, and who can be successful with a scalping based strategy.
What is a Scalper?
So you’re interested in scalping? A Forex scalper is considered anyone that takes one or more positions throughout a trading day. Normally these positions are based around short term market fluctuations as price gathers momentum during a particular trading session. Scalpers look to enter the market, and preferably exit positions prior to the market close.
Normally scalpers employ technical trading strategies utilizing short term support and resistance levels for entries. While normally fundamentals don’t factor into a scalpers trading plan, it is important to keep an eye on the economic calendar to see when news may increase the market’s volatility.
High Frequency Trading
There is a strong misconception that all scalpers are high frequency traders. So how many trades a day does it take to be considered a scalper? Even though high frequency traders ARE scalpers, in order for you to qualify as a scalper you only need to take 1 position a day! That is one of the benefits of scalping. You can trade as much or as little as you like within a giving trading period.
This also falls in line with one of the benefits of the Forex market. Due to the 24Hr trading structure of Forex, you can scalp the market at your convenience. Take advantage of the quiet Asia trading session, or the volatile New York – London overlap. Trade as much or as little as you like. As a scalper the choice is ultimately yours to make!
Risks
There are always risks associated with trading. Whether you are a short term, long term, or any kind of trader in between any time you open a position you should work on managing your risk. This is especially true for scalpers. If the market moves against you suddenly due to news or another factor, you need to have a plan of action for limiting your losses.
There are other misconceptions that scalpers are very aggressive traders prone to large losses. One way to help combat this is to make scalping a mechanical process. This means that all of your decisions regarding entries, exits, trade size, leverage and other factors should be written down and finalized before approaching the charts. Most scalpers look to risk 1% or even less of their account balance on any one position taken!
Who can Scalp?
So this brings us to the final question. Who can be a scalper? The answer is anyone with the dedication to develop a trading strategy and the time to implement that strategy on any given trading day.
=================
Trading examples
Metaquotes demo
GoMarkets broker, initial deposit is 1,000
Alpari UK broker initial deposit is 1,000
RoboForex broker initial deposit is 1,000
Forum on trading, automated trading systems and testing trading strategies
PriceChannel Parabolic system
Sergey Golubev, 2013.03.22 14:04
PriceChannel Parabolic system
PriceChannel Parabolic system basic edition
Latest version of the system with latest EAs to download
How to trade
The settingas for EAs: optimization and backtesting
Trading examples
Metaquotes demo
GoMarkets broker, initial deposit is 1,000
Alpari UK broker initial deposit is 1,000
RoboForex broker initial deposit is 1,000
Forum on trading, automated trading systems and testing trading strategies
Grid Based EA
Sergey Golubev, 2014.03.09 09:23
MT5 CodeBase (grid related tools - free to download):
Forum on trading, automated trading systems and testing trading strategies
Something Interesting
Sergey Golubev, 2016.01.08 08:50
RdzGridTraps EA (Grid Trading EA)
This is EA for MT4, with ex4 file only but free to use, and this EA was not uploaded to our CodeBase. But the discussion thread is this one.
It is placing the pending orders (I am using 'Grid Order Count (each side)' setting as 6, and different magic number for every pair. This is very interesting about how this EA will perform during the NFP today for example.
As we see - I am already in profit (15 dollars) since today morning:
Interesting indicator was found in CodeBase:
iPivot - indicator for MetaTrader 4Forum on trading, automated trading systems and testing trading strategies
Press review
Sergey Golubev, 2016.07.21 18:16
Introduction to Technical Indicators - Oscillators: RSI, Stochastics, CCI, MACD (based on the article)
Oscillators give traders an idea of how momentum is developing on a specific currency pair. When price treks higher, oscillators will move higher. When price drops lower, oscillators will move lower. Whenever oscillators reach an extreme level, it might be time to look for price to turn back around to the mean. However, just because an oscillator reaches “Overbought” or “Oversold” levels doesn’t mean we should try to call a top or a bottom. Oscillators can stay at extreme levels for a long time, so we need to wait for a valid sign before trading.
RSI
The Relative Strength Index is arguably the most popular oscillator out there. A big component of its formula is the ratio between the average gain and average loss over the last 14 periods. The RSI is bound between 0 – 100 and is considered overbought above 70 and oversold when below 30. Traders generally look to sell when 70 is crossed from above and look to buy when 30 is crossed from below.
Stochastics
Stochastics offer traders a different approach to calculate price oscillations by tracking how far the current price is from the lowest low of the last X number of periods. This distance is then divided by the difference between the high and low price during the same number of periods. The line created, %K, is then used to create a moving average, %D, that is placed directly on top of the %K. The result is two lines moving between 0-100 with overbought and oversold levels at 80 and 20. Traders can wait for the two lines to crosses while in overbought or oversold territories or they can look for divergence between the stochastic and the actual price before placing a trade.
CCI
The Commodity Channel Index is different than many oscillators in that there is no limit to how high or how low it can go. It uses 0 as a centerline with overbought and oversold levels starting at +100 and -100. Traders look to sell breaks below +100 and buy breaks above -100.
MACD
The Moving Average Convergence/Divergence tracks the difference between two EMA lines, the 12 EMA and 26 EMA. The difference between the two EMAs is then drawn on a sub-chart (called the MACD line) with a 9 EMA drawn directly on top of it (called the Signal line). Traders then look to buy when the MACD line crosses above the signal line and look to sell when the MACD line crosses below the signal line. There are also opportunities to trade divergence between the MACD and price.
Forum on trading, automated trading systems and testing trading strategies
Press review
Sergey Golubev, 2016.07.21 18:23
Introduction to Technical Indicators - Trend Following: Moving Averages, Ichimoku, ADX (based on the article)
Trend following indicators were created to help traders trade currency pairs that are trending up or trending down. We have all heard the phrase “the trend is your friend.” These indicators can help point out the direction of the trend and can tell us if a trend actually exists.
Moving Averages
A Moving Average (MA for short) is a technical tool that averages a currency pair’s price over a period of time. The smoothing effect this has on the chart helps give a clearer indication on what direction the pair is moving either up, down, or sideways. There are a variety of moving averages to choose from. Simple Moving Averages and Exponential Moving Averages are by far the most popular.
Ichimoku
Ichimoku is a complicated looking trend assistant that turns out to be much simpler than it initially appears. This Japanese indicator was created to be a standalone indicator that shows current trends, displays support/resistance levels, and indicates when a trend has likely reversed. Ichimoku roughly translates to “one glance” since it is meant to be a quick way to see how price is behaving on a chart.
ADX
The Average Direction Index takes a different method when it comes to analyzing trends. It won’t tell you whether price is trending up or down, but it will tell you if price is trending or is ranging. This makes it the perfect filter for either a range or trend strategy by making sure you are trading based on current market conditions.