Discussion of article "The Implementation of Automatic Analysis of the Elliott Waves in MQL5" - page 2
You are missing trading opportunities:
- Free trading apps
- Over 8,000 signals for copying
- Economic news for exploring financial markets
Registration
Log in
You agree to website policy and terms of use
If you do not have an account, please register
....Someday I will post a variant with optimisation, it analyses hours and four hours in a couple of minutes.

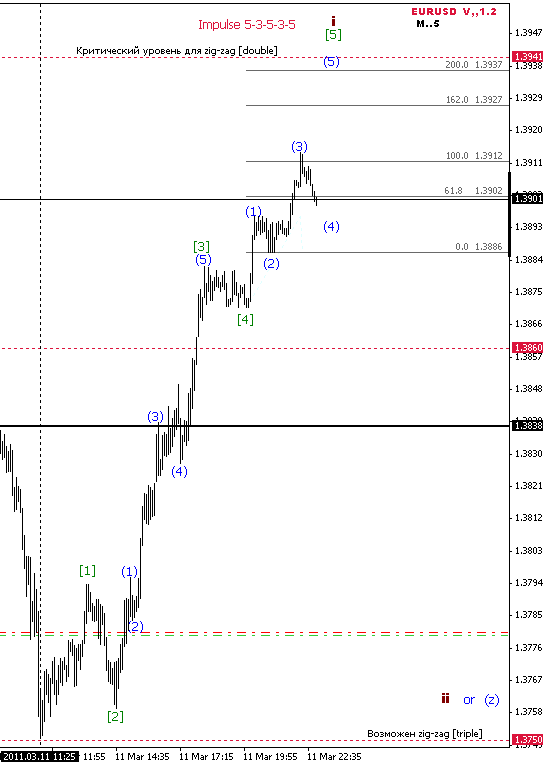
There are two charts in front of you. H1, and M5. Let me explain. Senior TF MUST link any movement in a general wave structure, it is very difficult, because there are many scenarios and which of them will choose the price..... who knows? Ready wave models are formed on the lower TFs. In particular, Impulses, as the most common models on Forex. (from 80 to 200 pips). On which TF it is easier for the programme to see the beginning and end of the impulse? I think you can see from the charts.
I would like to draw your attention to the fact that Wave Theory at this point in time is fundamentally divided into two branches - classical and modern. The first one - in the unchanged strict Elliottian form, the second one, including Neely's version, Wozny 's versions, as well as Frost and Prechter , etc., etc., should be referred to the daughter branches.
... Neely's version looks quite structured and thus suitable for programming. Can you tell me, is it really so, or when working directly "according to Neely" there are a lot of situations (questions) that do not have an unambiguous resolution?
Exactly so. There is no system in wave analysis, where there is a clear answer, what wave pattern is formed (with rare exceptions) or what exactly is formed in the overall wave structure. Neely's system is no exception.
The program must know all possible scenarios of price behaviour in this particular case and the critical levels where some scenarios are replaced by others.
Another way. The programme should "catch" waves "A" and "C", which in essence are impulses or NDT_KDT.
The program should know all possible scenarios of price behaviour in this particular case and critical levels where some scenarios are replaced by others.
Another way. The programme should "catch" waves "A" and "C", which, in their essence, are impulses or NDT_KDT.
And why? imho, if the programme is able to build waves correctly, the human task is reduced only to determining where the price is now - at the beginning of a new trend or at the end of the previous one.
I would like to know how much this code correctly finds impulse waves, if it is correct, then this code is a great help for developing trend strategies.
... ... imho, if the programme knows how to build waves correctly, then the human task is reduced only to determining where the price is now - at the beginning of a new trend or at the end of the previous one.
My original question implied fully automatic trading. And, as far as I understood, MILLL answered with this aspect in mind.
The program must know all possible scenarios of price behaviour, in this particular case, and the critical levels where some scenarios are replaced by others.
New article The Implementation of Automatic Analysis of the Elliot Waves in MQL5 is published:
Author: Roman Martynyuk
cool!
Describing the wave model "CLINE", you did not take into account a very important circumstance that the 5th wave is always used to the top of the 3rd wave.
.
There are three types of impulses. Classical five-wave, final and initial diagonal triangles. And if truncations are allowed in the first two, why should they not appear in wedges as well? Especially since the properties of initial and final diagonals are becoming more and more similar. Some authors already allow triples in the wedge, and fives in the acting waves of the diagonal, which is confirmed by numerous examples from the market.
Perhaps, the last property, by which the two types of diagonals were distinguished until recently, was the possibility or impossibility of truncation in the model. However, the market formed convincing examples of truncation in the wedge even a few years ago.
"According to the fractality of waves, analyses are done "top-down", from larger waves to smaller ones"
I don't know which fractality you are talking about exactly, but I completely disagree. In the Elliott Wave Theory, in order to correctly determine the place of a wave in the overall wave structure of the market, the smaller timeframe takes precedence over the larger one, and only in this way, not otherwise. When marking manually go from larger to smaller to save effort and time, but if there are difficulties with the identification of the wave all the nuances are clarified on a smaller timeframe. And if you are going to entrust this routine and very subjective business to the computer, the algorithm of the programme should be built from smaller to larger, not vice versa; if you are programming on the basis of Neely's works, you should have understood it long ago, another question is if there are difficulties with the implementation of such an algorithm.
The question is how we use it to get take profit and stop loss targets?